Intelligent Buildings International, 2014
Vol. 6, No. 2, 112–134, http://dx.doi.org/10.1080/17508975.2014.883299
Is it hot in here or is it just me? Validating the post-occupancy evaluation
Max Paul Deublea* and Richard John de Dearb
a
Department of Environment and Geography, Faculty of Science, Macquarie University, Sydney, NSW 2109,
Australia; bFaculty of Architecture, Design and Planning, The University of Sydney, Sydney, NSW 2006,
Australia
(Received 11 May 2012; accepted 6 January 2014)
Historically, post-occupancy evaluation (POE) was developed to evaluate actual building
performance, providing feedback for architects and building managers to potentially
improve the quality and operation of the building. Whilst useful in gathering information
based on user satisfaction, POE studies have typically lacked contextual information,
continued feedback and physical measurements of the building’s indoor climate. They,
therefore, sometimes over-exaggerate poor building performance. POEs conducted in two
academic office buildings: a mixed-mode (MM) and a naturally ventilated (NV) building
located within a university in Sydney, Australia, suggest high levels of occupant
dissatisfaction, especially in the MM building. In order to test the validity of the POE
results, parallel thermal comfort studies were conducted to investigate the differences in
occupant satisfaction and comfort perceptions between these two questionnaires.
Instrumental measurements of each building’s indoor environment reveal that occupants
tended to over-exaggerate their POE comfort responses. Analysis of thermal satisfaction and
acceptability in each building indicate that occupants of the NV building were more tolerant
of their thermal environment despite experiencing significantly warmer temperatures than
their MM counterparts. In discussing these results, along with participant comments and
anecdotal evidence from each building, this article contends that POE does not accurately
evaluate building performance, suggesting occupants can and do use POE as a vehicle for
complaint about general workplace issues, unrelated to their building. In providing a critical
review of current POE methods, this article aims to provide recommendations as to how
they can be improved, encouraging a more holistic approach to building performance
evaluation.
Keywords: adaptive thermal comfort; forgiveness factor; occupant satisfaction; postoccupancy evaluation; thermal acceptability
1.
Introduction
Two buildings much alike in dignity, in fair Sydney, where we lay our scene … 1
The main purpose of any building is to provide a safe and comfortable environment that neither
impairs the health of its occupants nor hinders their performance. Buildings are primarily
designed and built for their intended occupants, but in many cases this is done without much consideration of the buildings end-users’ needs or preferences (Vischer 2001; Way and Bordass
2005). As a result, many occupants do not understand how to operate their building which can
*Corresponding author. Email: deuble.max@gmail.com
© 2014 Taylor & Francis
�Intelligent Buildings International
113
often lead to high levels of discontent (Leaman and Bordass 2007). As building managers and
designers continually strive to improve occupant satisfaction and productivity by ensuring comfortable and healthy working conditions, post-occupancy evaluation (POE) represents a systematic quality assurance process towards these ends.
POE is a global and rather general term for a variety of types of field studies in built environments based on assessing the responses, behaviour and perceptions of a building’s occupants. In
the past, POEs have been viewed as a means to measure the performance of a building from the
occupant’s perspective in a systematic and rigorous manner after they were built and occupied for
some time (Preiser, Rabinowitz, and White 1988; Preiser 2001a; BCO 2007). Used extensively
worldwide, POE studies aim to investigate whether buildings are performing as intended/
designed. In effect, they provide ‘feedback’ to the architects and building managers on potential
areas for improvement (Vischer 2004; Bordass and Leaman 2005b). They are often targeted
towards the users’ perception of the building rather than actual building performance metrics,
such as energy consumption, temperature and humidity, lighting, noise, etc. (Zimring and Reizenstein 1980; Hartkopf, Loftness, and Mill 1986; Preiser 1995; Derbyshire 2001; Nicol and Roaf
2005). There are, however, many differing definitions of what constitutes POE. Within this
article, the authors define POE as a process of evaluating the performance of a building after it
has been built and occupied for some time (Preiser, Rabinowitz, and White 1988). However,
this article argues that POEs should not only involve feedback from the building users, but
also include the use of instrumental data, such as the measurement of indoor environmental
quality (IEQ) indicators. Therefore, this article aims to critically examine the validity of POE
as a measure of a building’s performance through user perceptions by comparing the results
from POEs and thermal comfort studies conducted in two academic office buildings in
Sydney, Australia. In analysing forgiveness factors and thermal sensation votes, along with occupants’ comments, these results suggest that participants use POE surveys as a conduit for general
complaint which may have nothing to do with the building in question.
1.1. Post-occupancy evaluation: an evolutionary background
Before we can effectively critique POE methods it is instructive to review the context in which
they were originally developed. Up until the 1950s, systematic information on building performance from the occupants’ perspective was not easily accessible. Following the rapid expansion of
architectural projects in the UK in the 1960s, the Royal Institute of British Architects (RIBA
1962) identified the need to gather and disseminate information and experience on the requirements of building users. The RIBA called for the study of buildings in use, from both the technical
and cost points of view, as well as in terms of design (RIBA 1962; Cooper 2001; Derbyshire
2001). The RIBA’s Handbook of Architectural Practice and Management (1965) was instrumental
in defining the sequence of stages related to building construction, including briefing/programming, design, specification, tendering, completion and use (Cooper 2001; Preiser and Vischer
2005; Preiser and Nasar 2008). This report also incorporated a final stage to the building life
cycle called ‘feedback’. Within this stage, architects were advised to inspect their completed
buildings after they had been built as a means of improving service for future clients (Preiser
2001b; Bordass and Leaman 2005a). Thus, the concept of ‘POE’ was born from this need to
provide feedback to building managers on the performance of their building after completion
(Derbyshire 2001; BCO 2007). Despite RIBA’s best efforts, POE was largely ignored by the
design and construction industry in the UK because of its potential to deliver evidence to
clients about under-performance or just plain building design (Cooper 2001; Hadjri and
Crozier 2009). Following the large number of housing studies in the 1970s and 1980s in the
USA, as well as its emergence in Australia and New Zealand since the 1990s, POE has steadily
�114
M.P. Deuble and R.J. de Dear
gained credibility as a mechanism of scientific inquiry for user satisfaction within buildings
(Preiser 1995; Vischer 2001; Bordass and Leaman 2005a). However, it was not until the 1990s
that the UK construction industry realized the true potential and value of POE as a significant
development in architectural research (Cooper 2001).
Over the past 30 years, numerous adaptations and improvements have been made to POE
methods (Preiser and Vischer 2005; Mallory-Hill, Preiser, and Watson 2012). The term POE
was originally intended to reflect that assessment taking place after the client had taken occupancy
of a building (Preiser 2001a; Zimring and Rosenheck 2001). Early descriptions focused on POE
as a stand-alone practice aimed at understanding a building from the users’ perspective (Preiser
2001a; Bordass and Leaman 2005a; Preiser and Vischer 2005), and often included aspects of
architectural design, technical performance, indoor climate, occupant satisfaction and environmental impact (Zimring and Reizenstein 1980; Hartkopf, Loftness, and Mill 1985; Vischer and
Fischer 2005; Loftness et al. 2006; Gonchar 2008). POEs are generally classified into three
main types, as identified in Preiser, Rabinowitz, and White (1988): (1) indicative POEs
involve walk-through observations as well as selected interviews which typically raise awareness
of the major strengths and weaknesses of a particular building’s performance; (2) investigative
POEs carry out more in-depth evaluations and often comply with particular building performance
standards or guidelines on a given building type. One of the most commonly found type of POEs,
these provide a thorough understanding of the causes and effects of issues in building performance; and (3) diagnostic POEs provide very detailed information about the buildings performance.
These evaluations gather physical environmental data which are then correlated with subjective
occupant responses (Preiser, Rabinowitz, and White 1988; Preiser 2001a). However, more
recent applications of POEs, especially in office buildings, fail to recognize the limitations of
POE studies (Mallory-Hill, Preiser, and Watson 2012). Despite more recent POE discussions
having emphasized the need for a more holistic and process-oriented approach to evaluating
building performance (Preiser 2001a; Vischer 2001; Preiser and Vischer 2005; Vischer 2008a;
Meir et al. 2009), such notions are yet to be transformed into practice.
1.2.
Uses and misuses of post-occupancy evaluations in buildings
Over the past four decades, POE has become a widely used tool in evaluating building performance (Preiser, Rabinowitz, and White 1988; Preiser 1995; Riley, Moody, and Pitt 2009). Since the
early studies on the housing needs of disadvantaged groups in the 1970s (Bechtel and Srivastava
1978; Vischer 1985), POEs have broadened their scope to applications in various other building
types, such as healthcare facilities (McLaughlin 1975; Cooper, Ahrentzen, and Hasselkus 1991;
Carthey 2006; Leung, Yu, and Yu 2012), residential buildings (CABE 2007; Gupta and Chandiwala 2010; Stevenson and Leaman 2010), educational buildings (Baird 2005; Watson 2005; Loftness et al. 2006; Turpin-Brooks and Viccars 2006; Riley, Kokkarinen, and Pitt 2010; Zhang and
Barrett 2010) and commercial/office buildings (Leaman and Bordass 1999; Leaman and Bordass
2001; Zagreus et al. 2004; Bordass and Leaman 2005c; Vischer 2005; Abbaszadeh et al. 2006;
Leaman and Bordass 2007; Leaman, Thomas, and Vandenberg 2007). Apart from providing
designers with feedback, numerous researchers (Preiser 2001b; Vischer 2001; Whyte and Gann
2001; Bordass and Leaman 2005a; Loftness et al. 2006; Turpin-Brooks and Viccars 2006;
Preiser and Nasar 2008; Hadjri and Crozier 2009; Loftness et al. 2009; Riley, Kokkarinen, and
Pitt 2010) suggest a number of other plausible benefits of POE, including: (1) improving commissioning process; (2) definition of user requirements; (3) improving management procedures; (4)
providing knowledge for design guides and regulatory processes and (5) targeting of
refurbishment.
�Intelligent Buildings International
115
Notwithstanding these benefits, many barriers to conducting POEs have also been identified
(Cooper 2001; Vischer 2001; Zimmerman and Martin 2001; Zimring and Rosenheck 2001). The
extensive discussion of these problems suggests a growing frustration with the lack of progress
towards POE becoming a mainstream activity in the process of building procurement (Hadjri
and Crozier 2009; Meir et al. 2009). The more commonly identified barriers to the widespread
adoption of POE include cost, fragmented incentives and benefits within the procurement and
operation processes, potential liability for designers, engineers, builders and owners, lack of
agreed and reliable indicators, time and skills (Bordass et al. 2001; Cooper 2001; Vischer
2001; Zimmerman and Martin 2001). Moreover, Zimmerman and Martin (2001) suggest that
standard practice in the facility delivery process does not recognize the concept of continual
improvement or any ongoing involvement on the part of the designers. Despite one of the
primary goals for conducting POEs is to enable designers to revisit their designs, improve their
skills and produce more efficient buildings, the idea of continual improvement via feedback
has lacked emphasis in both the North American and UK contexts (Derbyshire 2001; Preiser
2001b; Preiser and Vischer 2005). Whilst many agree with these barriers, there are still some challenges in the use of contemporary POE methods (Preiser and Vischer 2005), especially in commercial office buildings. From the literature, three key issues in the POE method have been
identified: ‘lack of context’; ‘lack of feedback’ and the ‘lack of instrumental data’ (Hartkopf, Loftness, and Mill 1986; Vischer 2001; Jarvis 2009; Loftness et al. 2009). It should be noted that the
following issues are predominantly focused on POE studies conducted in office buildings.
1.2.1. Lack of context
Traditionally, POE has been viewed as a final, one-off process as the term ‘post’ reflects only that
time after a building was completed (Bordass and Leaman 2005a; Preiser and Vischer 2005). Yet,
POE is not the end phase of a building project; rather it is an integral part of the building delivery
process (Federal Facilities Council 2001; Preiser 2001b; Vischer 2001). The technique should be
used more regularly to ensure buildings continue to deliver at their intended design specifications
and, in return, appropriate levels of satisfaction amongst the end-users (Preiser 2001b; Preiser and
Nasar 2008; Vischer 2008a; Riley, Kokkarinen, and Pitt 2010). Much literature suggests POE
should be cyclical in nature rather than simply providing a final feedback component in the occupancy phase (Preiser 1995; Bordass et al. 2001; Cohen et al. 2001; Vischer 2001).
POE practice has mainly focused on assessing specific cases (Federal Facilities Council 2001;
Turpin-Brooks and Viccars 2006). Even when evaluators have been able to create databases of
findings, they have often been used to benchmark single cases rather than to develop more
general conclusions (Zimring and Rosenheck 2001; Baird 2011). POE studies involving office
buildings often lack the contextual information in which the building was built and occupied.
Prior to moving into their new building or space, occupants could already harbour distrust of management (Vischer 2001, 2008b; Vischer and Fischer 2005). Workers may also have high expectations that are not met when balanced against the possible constraints of an existing building that
limits the creation of effective workspace (Schwede, Davies, and Purdey 2008). Ultimately, the
uncertainty generated by moving to a new building or space affects employee’s perception of
their environment (Vischer 2005; Vischer and Fischer 2005). If left unresolved, these attitudes
and predispositions are likely to carry forward into the new workspace. As such, the actual
impact a building has on its users remains unaccounted for in the analysis and interpretation of
the results. Many discussions have risen for the evaluation of a building prior to occupation
(Federal Facilities Council 2001; Preiser and Vischer 2005). Leaman, Stevenson, and Bordass
(2010) suggest that building performance studies should seek and reveal the context behind the
building, i.e. occupants’ personal history and attitudes towards the building. These psychosocial
�116
M.P. Deuble and R.J. de Dear
factors play an important role in determining people’s concerns with their environment (Vischer
1986; Chigot 2005; Vischer and Fischer 2005; Turpin-Brooks and Viccars 2006) and may well
affect their perception of the building. Furthermore, the consideration of occupants’ demands
and experience in the design process helps to achieve more positive design outcomes (Vischer
1985, 2005; Fischer, Tarquinio, and Vischer 2004; Schwede, Davies, and Purdey 2008).
1.2.2. Lack of feedback (or has the loop become a noose?)
Improvement of building performance requires the identification of positives and negatives
through rapid feedback (Cohen et al. 2001; Bordass and Leaman 2005b). The UK’s building
use studies (BUS) in the 1990s launched the post-occupancy review of buildings and their engineering (PROBE) project (Cohen et al. 2001; Cooper 2001; Derbyshire 2001; Fisk 2001). In conducting POE studies for a wide range of non-domestic buildings, the PROBE project helped
develop a standardized POE method, accumulating a wide range of studies around the world
into a homogenized database against which future POE studies could be benchmarked
(Bordass et al. 2001; Leaman and Bordass 2001). Following these landmark PROBE studies,
POE advocates stressed the need to close the loop between building managers and the building’s
end-users (NCEUB 2004; Building Research and Information 2005). In agreement, Leaman and
Bordass (2001) suggest that the provision of a knowledge base of lessons learned from users in
completed projects should be utilized to either improve spaces in existing buildings or form a programming platform for future buildings (Leaman and Bordass 2001; Zimmerman and Martin
2001; Preiser and Schramm 2002). Ten years on, however, there is evidence to suggest that a
lack of communication and feedback still exists amongst these parties (Preiser and Vischer
2005; Thomas 2010).
To date, occupants still remain a largely untapped source of information to building managers
and, as such, are rarely involved in the stages of building construction and commission (Zagreus
et al. 2004). Due to this lack of involvement, many occupants do not understand how to operate
nor occupy their building, which often leads to high levels of discontent. Consequently, as Cohen
et al. (2001) suggests, occupants will blame ‘negative’ workplace feelings on the physical
environment as a way of voicing their dissatisfaction. Furthermore, occupants will often resort
to using the POE as a means to report problems in the workplace, e.g. uncomfortable conditions,
poor lighting or ventilation, lack of control and even bullying which is not measured in POEs
(Loftness, Hartkopf, and Mill 1989; Preiser 2001b; Vischer 2004; Vischer and Fischer 2005;
Turpin-Brooks and Viccars 2006).
1.2.3. Lack of instrumental data
The landmark PROBE studies in the UK set the benchmark as to how such studies should be conducted (Hartkopf, Loftness, and Mill 1986; Vischer 1986; Ventre 1988; Loftness, Hartkopf, and
Mill 1989; Vischer and Fischer 2005; Loftness et al. 2009; Meir et al. 2009). These studies relied
on three evaluation components: energy assessment and reporting methodology; BUS occupant
questionnaire and an air pressure test (Cohen et al. 2001). Subsequent use of these tools,
however, has focused more on occupant satisfaction with the building, thereby relying on
more subjective criteria (Federal Facilities Council 2001; Fisk 2001; Turpin-Brooks and
Viccars 2006; Jarvis 2009; Leaman, Stevenson, and Bordass 2010). Whilst many agree such
metrics are more easily assessed than alternatives, such as productivity or health (Leaman and
Bordass 1999), it is often argued that occupant satisfaction is not a meaningful measure for
judging building performance (Hartkopf, Loftness, and Mill 1985, 1986; Heerwagen and
Diamond 1992; Leaman, Stevenson, and Bordass 2010). Despite providing a first-hand
�Intelligent Buildings International
117
account of how the building is affecting the occupants, such assessments are susceptible to bias.
Since POEs do not account for any psychosocial or contextual (non-physical) factors that may
affect occupants in the workplace, participants’ responses may be either positively or negatively
biased. Sometimes known as the ‘Hawthorne effect’, the behaviour or responses of an individual
or group will often change to meet the expectations of the observer/researcher (Roethlisberger and
Dickson 1939).
The use of such measures, therefore, presents a specific challenge: respondents’ subjective
assessments of their environment might be affected by non-building-related factors (Ventre
1988; Zagreus et al. 2004; Jarvis 2009; Loftness et al. 2009). Many aspects of building performance are readily quantifiable, such as lighting, acoustics, temperature and humidity, durability of
materials, amount and distribution of space, etc. (Hartkopf, Loftness, and Mill 1985, 1986; Preiser
2001a). Despite this, POEs typically do not obtain instrumental measurements of indoor building
environmental conditions, potentially leading to unsubstantiated complaints against a building’s
indoor environment. In order to get a complete picture of a building’s actual performance from a
technical and occupants’ perspective, the subjective data from occupant feedback surveys could
be correlated against the quantitative data measured from physical monitoring (Vischer 1986;
Ventre 1988; Turpin-Brooks and Viccars 2006; Choi, Aziz, and Loftness 2010; Gupta and Chandiwala, 2010). Several researchers, however, argue that there are inherent difficulties in matching
user’s subjective responses with objective environmental data (Vischer 1986; Vischer and Fischer
2005; Jarvis 2009; Loftness et al. 2009). POEs often record occupant perceptions of thermal
comfort on past seasonal events occurring 3–12 months before the survey was administered. In
order to achieve a successful correlation between the occupants’ thermal comfort ratings and
the internal thermal environment of the building, the surveys need to be conducted on a ‘righthere-right-now’ basis for the results to be reliable. However, Vischer (1993) also suggests that
humans draw on experience outside the immediate time frame of the present to make their
summary judgements of comfort conditions. Instruments, on the other hand, are temporally
limited to sampling actual building conditions as a snapshot or over a prolonged period of
time. By adopting a more diagnostic approach to POEs, the temporal and calibration limitations
on instrument-based data collection can be avoided. Furthermore, measurements of building
systems performance can be carried out as a follow-up procedure to help understand the
meaning behind the feedback yielded by users on their perceptions of building conditions
(Vischer 1986, 2001; Vischer and Fischer 2005). This study, therefore, aims to investigate the
differences between occupant satisfaction and comfort perceptions between POE and thermal
comfort questionnaires within two case study buildings. Furthermore, measurements of each
building’s indoor thermal environment will help to gain a better understanding and insight into
occupant satisfaction ratings.
2.
Methods
2.1. Sydney’s climate
Located on the eastern coast of Australia, the Sydney metropolitan region (34°S, 151°E) is
characterized by a moderate sub-tropical climate. Influenced from complex elevated topography
surrounding the region to the north, west and south and due to close proximity to the Tasman Sea
to the east, Sydney avoids the high temperatures commonly associated with more inland regions
of the same latitude (BoM 1991). In regard to summer, the months of December to February can
be described as warm-to-hot with moderate-to-high humidity peaking in February to March.
Within the winter months of June to August, Sydney experiences cool-to-cold winters. The
two case study buildings are located within a suburban tertiary educational institution,
�118
M.P. Deuble and R.J. de Dear
approximately 16 km north-west of Sydney’s central business district (33°46′ S, 151°6′ E). As
shown in Figure 1, seasonal variations range from mean summer daily maximum temperatures
of 26–28°C, a mean winter daily maximum of 17°C and an annual mean daily maximum of
22–23°C. Mean minimum daily temperatures range from 5–8°C in winter to 17–18°C over the
summer months, with an annual daily minimum temperature of 11–13°C (BoM 2011). Given
the city’s seasonal variations, Sydney’s climate is well suited to natural ventilation. For much
of the year, thermal comfort indoors can be easily achieved through simple passive design principles and various adaptive behaviours employed by the occupants, such as opening/closing
windows, adjusting their clothing or by change of position (Aggerholm 2002; Rowe 2003).
2.2. Case study buildings
Two academic office buildings were selected for this study. The mixed-mode (MM) building was
commissioned in 2006 and has a total usable floor area of 6541 m2. The naturally ventilated (NV)
building was built in the 1960s and covers an area of approximately 5808 m2. Since both buildings were located on the same university campus, both occupied by academics employed by the
same organization with comparable occupancy densities of 0.03 occupants/m2, they make for an
ideal field study. Due to both buildings having north–south orientations, the north-facing facades
are directly irradiated from the Sun, creating warmer internal temperatures than the south-facing
perimeter zones:
1. MM building: Presented in Figure 2(a) and 2(b), this seven-storey academic office building features operable windows on all north and south perimeter cellular offices. These are
separated with an air-conditioned (AC) central open-plan office zone. Automated high and
low external louvres provide natural ventilation to each floor, with adjustable internal
grilles to control airflow, supplemented with user-operable windows (Figure 2(b)). As
depicted in Figure 2(a), the building also features additional solar shading over the northern (sun-facing) windows. Indoor temperature and outdoor weather sensors prompt the
building management system (BMS) to switch into the AC mode whenever a temperature
greater than 25°C is sensed within any zone. During the AC mode, internal temperatures
are maintained at 24°C (+1°C) as defined in the building’s algorithm. BMS switch-over to
the NV mode is conditional when external meteorological conditions and the indoor
thermal climate fall into an acceptable zone for the occupants. Around 200 academic
Figure 1. Climatology of the case study building site (adapted from BoM 2011).
�Intelligent Buildings International
119
Figure 2. (a) The MM building as viewed from the north facade featuring operable windows with external
solar shading devices on north-facing windows. (b) User-operated windows and internal grilles in the north
and south perimeter offices of the MM building.
and administrative staff (55% female; 45% male, with an average age range of 40–50)
from economics and finance disciplines occupy this building.
2. NV building: Illustrated in Figure 3(a) and 3(b), the NV building features a narrow floor
plate traversed by a central corridor with single- and dual-occupant cellular offices on
either side. Each office contains at least two occupant-operated sash windows than can
be opened to create effective cross-ventilation throughout the building interior. This building does not have any external shading along the north facade which results in increased
solar heat gains in the north-facing offices. Unlike the MM building, there is no centralized
heating or cooling systems, with the exception of occupant-controlled room air conditioners (as seen in Figure 3(a)) that were retrospectively added to some offices. Figure
3(b) illustrates that occupants often resort to using portable fans and heaters throughout
Figure 3. (a) The NV building as viewed from the north facade featuring occupant-operated windows with
some individual air conditioner units. (b) Occupants often use portable fans or heaters in conjunction with
operable windows for additional cooling/heating throughout the year.
�120
M.P. Deuble and R.J. de Dear
the year for additional cooling in summer and/or heating in winter. The building’s total
population of 200 occupants (53% female; 47% male, with an average age range of 40–
50) is composed of academic and administrative staff as well as post-graduate students
from a variety of science-related disciplines, such as environmental science, physics,
geology and mathematics.
2.3.
Measurements
Simultaneous objective (indoor and outdoor climate) and subjective (self-assessed comfort perceptions) measurements were collected throughout this study. Dataloggers were randomly
located throughout each building to record air temperature, globe temperature and relative humidity at 5-minute intervals throughout the study. The study was conducted over 12 months (from
March 2009 to April 2010) to represent the full cycle of the seasons. Air velocity was measured
during each questionnaire session using a handheld thermal anemometer (TSI VelociCalc).
Loggers were placed within 1 m of the occupants’ workstation to characterize the immediate
thermal environment experienced by the occupant under normal working conditions. Outdoor
weather observations were obtained from a nearby automatic weather station. The building’s
AC/NV mode status and indoor temperature records were collected from the BMS after the
field campaign had finished.
2.4.
Questionnaires and data analysis
The recruitment process consisted of building-wide emails sent to all occupants of each building
informing them of the study, its aims and their involvement should they consent to participate.
Response to this email was regarded as consent to participate in the study. Two separate questionnaires were used in this study, i.e. the BUS POE and ‘right-here-right-now’ thermal comfort
questionnaire:
1. POE: The three-page BUS POE questionnaire (Usable Buildings Trust 2008; BUS 2009)
features a wide range of 7- and 9-point Likert scales, with space for commentary, that aim
to measure occupant satisfaction towards building performance. These include operational
factors, e.g. desk space, cleanliness and furniture layout; environmental factors, e.g.
thermal, visual and acoustic comfort, indoor air quality; personal environmental control
factors over heating, ventilation, cooling, lighting and noise; and satisfaction factors, e.
g. perceived health and productivity (Baird 2010). Combinations of these scores enable
the calculation of various comfort and satisfaction indices, including the ‘forgiveness
factor’, unique to the BUS survey. The forgiveness factor is derived as a ratio of
Overall Comfort score to the average of the scores for the six environmental factors: Lighting Overall, Noise Overall, Temperature Overall in both winter and summer, and Air
Overall in both winter and summer. This index purports to quantify the user’s tolerance
of the environmental conditions in the building, with values greater than unity taken to
indicate occupants being more tolerant, or ‘forgiving’ of a building’s thermal environmental conditions (Leaman and Bordass 2007). These questionnaires, in accordance to
the original BUS methodology, were delivered in person to each occupant within the
building. To preserve occupant anonymity, participants placed their completed questionnaires inside a blank, sealed envelope which was collected at the end of the same day.
2. Thermal comfort questionnaires: Paper-based subjective comfort questionnaires were used
to record occupant perceptions of their thermal environment on a ‘right-here-right-now’
basis. Subjects were asked to assess their thermal sensation (actual mean vote) on the
�Intelligent Buildings International
121
ASHRAE 7-point scale, which included the possibility of fractional votes placed between
two comfort categories. Thermal acceptability was addressed as a binary ‘acceptable’ or
‘unacceptable’ response, whereas thermal preference was assessed on the 3-point McIntyre scale (1980), on which occupants listed if they preferred to feel ‘warmer’, ‘cooler’
or ‘no change’. In terms of air movement, subjects registered if the air velocity was ‘acceptable’ or ‘unacceptable’ and their reason: whether it was ‘too low’, ‘too high’ or ‘enough’
air movement. Subjects were also asked if they preferred ‘no change’, ‘more’ or ‘less’ air
movement. Standardized self-assessed clothing garment (clo) and metabolic activity
checklists (ASHRAE 2001; ISO 2003) within the subjective comfort questionnaires
allowed the calculation of various comfort indices using ASHRAE’s WinComf software
(Fountain and Huizenga 1997), including predicted mean vote (PMV) and predicted percentage dissatisfied (PPD). Finally, a section was added for the researcher to identify the
respondents’ location and mode of operation for each participant’s office at the time of
each questionnaire. This information was used to match the questionnaire responses
with the instrumental measurements.
3.
Results
In order to show the differences between each building based on both subjective (occupant satisfaction) and objective measurements (instrumental measurements), it is instructive to
compare both buildings’ performance under similar weather conditions. POEs were conducted
in each building between March and April 2009 and 2010 to reflect occupants’ perceptions of
thermal comfort and other IEQ performance through the previous winter–summer cycle.
Thermal comfort field studies were conducted simultaneously in both buildings from October
2009 to April 2010 in which the outdoor weather conditions were comparable to those from
the previous summer period (2008–2009).
3.1. Summertime thermal environment
Presented in Figure 4 are the concurrent indoor temperatures recorded at the time when each
comfort questionnaire was administered across both buildings throughout the study (October
2009–April 2010). As illustrated, the data in Figure 4 highlight discrepancies between the internal
Figure 4. Summertime thermal environment recorded for the MM and the NV building (October 2009 to
April 2010). Each data point corresponds to days in which thermal comfort questionnaires were
administered.
�122
M.P. Deuble and R.J. de Dear
operative temperatures within these buildings during the study period. The NV building experienced significantly warmer indoor temperatures (average = 25.4°C, p = .000) compared to the
MM building over the same period (average = 23.8°C). Recorded during occupied office hours
(8 am–6 pm), the average daily outdoor air temperature of 24.4°C was typical for Sydney’s
summer months. Figure 4 indicates internal temperatures within the NV building tracking
changes in the outdoor weather conditions. Temperatures in the MM building ranged from
21°C to 25°C in accordance with the BMS algorithm switching into the AC mode whenever
average indoor air temperatures reach a 25°C trigger temperature. In contrast, temperatures
inside the NV building varied between 20°C and 30°C. Internal temperatures in the NV building
exceed the 25°C threshold on 27 days during the study, which equates to over 50% of all occupied
office hours. Thus, objectively, the NV building is significantly warmer than the MM building
during summer months.
3.2.
Occupant satisfaction
POEs were delivered face to face on a Tuesday morning to all occupants within each building, as
recommended by the BUS (2009) methodology. This was done to ensure the best possible
response rates. In total, 163 POE questionnaires were distributed in the MM building and 120
in the NV building.2 With a 53% response rate, the MM building returned 86 completed questionnaires (39 male, 47 female), and 81 (38 male, 43 female) were completed from the NV building
(68% response rate). Incomplete responses were omitted from the subsequent analysis. The
thermal comfort variables are measured using a 7-point scale with 4 as the mid-point; scores
greater than 4 express satisfaction and scores lower than 4 express dissatisfaction. Calculated
as the percentage of scores less than 4 to the total number of scores recorded, Table 1 shows
the percentage of dissatisfaction votes for each of the thermal comfort variables, i.e. temperature
in summer, ventilation in summer, noise, lighting, perceived productivity, comfort overall and forgiveness factor.
The values in Table 1 demonstrate that occupants of the MM building rated their building
quite poorly in terms of thermal comfort with over half the study population (55%) registering
dissatisfaction with overall comfort. Similarly, 58% and 57% of subjects surveyed found the
temperature and ventilation in summer to be unacceptable, respectively. Fewer people were dissatisfied with temperature and ventilation in the NV building (28% and 25%, respectively). In
terms of overall lighting, noise and perceived productivity, both buildings scored similar percentages of occupant satisfaction. Values greater than 1 on the forgiveness factor index are taken to
indicate that occupants may be more tolerant, or ‘forgiving’ of the conditions (Leaman and
Table 1. Forgiveness factor and dissatisfaction percentages of variables in the POE for the MM and the NV
building.
Dissatisfaction (%)
Variable
Temperature in summer
Ventilation in summer
Comfort overall
Lighting overall
Noise overall
Perceived productivity
Forgiveness factor
MM (n = 86)
NV (n = 81)
58
57
55
16
35
33
0.99
28
25
44
23
38
58
1.14
�Intelligent Buildings International
123
Bordass 2007). Therefore, the forgiveness factor of the NV building (1.14) suggests that occupants were more prepared to forgive the buildings’ less-than-ideal conditions, as opposed to
their MM counterparts (forgiveness factor = 0.99).
Sixty subjects were recruited from each building for the summer thermal comfort field studies.
In total, 713 ‘right-here-right-now’ questionnaires were collected from the MM building (average
of 15 per day), and 607 were collected from the NV building (average of 13 per survey day). In
order to analyse these results against comparable conditions in each building, actual percentage
dissatisfied (APD) and PPD based on Fanger’s heat-balance comfort model (1970) were
plotted against binned indoor operative temperature. As mentioned previously, PPD values
were calculated based on the PMV equation using ASHRAE’s WinComf software (Fountain
and Huizenga 1997). APD was derived as the percentage of thermal sensation votes greater
than +1.5 and less than −1.5 recorded within the limits of a 1°C indoor operative temperature
bin, e.g. 21.5–22.49°C, against the total number of votes for each corresponding bin. Those
votes registered outside ±1.5 were regarded as expressing dissatisfaction (as described by
Fanger 1970). Figure 5(a) and 5(b) show the results of these analyses for the MM and NV building, respectively. Since the central zone in the MM building is constantly AC and does not have
the capability to operate under natural ventilation, it was not included in the following analyses.
Furthermore, when APD equals 100% this indicates that all subjects surveyed voted their thermal
sensation to be greater than ±1.5 units outside thermal neutrality. Conversely, APD is ‘zero’ when
all subjects’ thermal sensations were between the votes of slightly warm (+1) and slightly cool
(−1) on the ASHRAE 7-point scale of thermal sensation.
As illustrated in Figure 5(a), occupants of the MM building were found to be quite dissatisfied
with the thermal environment. Observed levels of thermal dissatisfaction (APD) were greater than
or equal to those predicted on the basis of actual environmental conditions using the PMV–PPD
model at modest indoor temperatures, i.e. 22–26°C. This suggests that occupants found these
temperatures to be overwhelmingly unacceptable despite PPD values falling at or below the
10–20% dissatisfied threshold. In contrast, the NV building results indicate PPD levels, on
average, higher than the APD values registered by occupants (Figure 5(b)). Fewer occupants
expressed dissatisfaction compared to the PPD levels for temperatures ranging from 19°C to
25°C, indicating that, despite the much warmer indoor environmental conditions with PPD
levels well above the recommended 20% margin, occupants still voted these temperatures as
acceptable.
These results also highlight fundamental differences between occupants of these two buildings. Even under similar thermal conditions, occupants of the NV building, on average, registered
lower APD values compared to those in the MM building. For instance, at an indoor operative
temperature of 23°C, 15% of occupants in the MM building were thermally dissatisfied,
whereas all subjects surveyed in the NV building at the same temperature voted the indoor
thermal environment as satisfactory. Again, at an indoor operative temperature of 25°C, only
8% of the subjects surveyed in the NV building recorded thermal sensations outside the band
of thermal acceptability (±1.5), whereas in the MM building, 18% of occupants surveyed
expressed thermal dissatisfaction.
3.3. Thermal acceptability
The preceding analyses inferred acceptability from the sensation scale, and in doing so, afforded
comparisons between observed thermal dissatisfaction and that predicted in the same setting by
Fanger’s PPD (1970). A more direct approach on our subjective comfort questionnaires used a
binary item, i.e. was the thermal environment simply ‘acceptable’ or ‘unacceptable’? The
numbers of ‘acceptable’ and ‘unacceptable’ votes recorded in each indoor operative temperature
�124
M.P. Deuble and R.J. de Dear
Figure 5. Average APD and PPD recorded in: (a) the MM building (above) and (b) the NV building
(below).
bin were tallied (Figure 6(a) and 6(b)). As shown in Figure 6(a), a higher percentage of occupants
in the MM building voted the thermal environment as ‘unacceptable’ compared to those in the NV
building (shown in Figure 6(b)). Within the MM building, over 20% of occupants surveyed found
the indoor temperature to be unacceptable, even at moderate temperatures, e.g. 20–26°C. In contrast, Figure 6(b) demonstrates that fewer occupants (as low as 5%) in the NV building found the
indoor temperature to be unacceptable. Between temperatures of 20°C and 25°C, over 80% of the
study population in the NV building found these temperatures to be acceptable. Not surprisingly,
the number of ‘unacceptable’ votes recorded in both buildings increased under warmer indoor
conditions. Interestingly, even at similar indoor temperatures of 26°C, the NV building recorded
90% acceptability (grey bars), whereas the MM building recorded just over 70%.
�Intelligent Buildings International
125
Figure 6. Percentage of thermal acceptability votes registered in (a) the MM building (above) and (b) the
NV building (below).
4.
Discussion
Despite indoor operative temperatures in the MM building being significantly cooler than the NV
building (Figure 4), the subjects’ POE responses reflect lower levels of satisfaction (40–50%)
with the thermal environment. Objectively, the thermal environment in the NV building
appears significantly worse than the adjacent MM building. On average, temperatures in the
NV building during the summer months were 2°C warmer than the MM building. As shown
in Figure 4, the MM building rarely exceeds the 25°C threshold due to the building switching
into the AC mode when indoor temperatures are greater than 25°C. But despite these lessthan-ideal conditions, occupants of the NV building reported moderate levels of satisfaction
(around 80%) and this was borne out by their forgiveness levels (1.14) compared to their MM
counterparts (0.99).
�126
M.P. Deuble and R.J. de Dear
In regard to the results from the thermal comfort studies, occupants’ perceptions of comfort
and thermal acceptability were quite different between these buildings. Even though indoor
environmental conditions experienced within the NV building were less-than-ideal, APD were,
on average, lower than the predicted PPD values. In comparison, occupants of the MM building
registered much higher APD levels than the PPD values predicted using Fanger’s heat-balance
model. Despite temperatures within the MM building being constrained during summer
between 20°C and 25°C, occupants expressed significantly greater levels of thermal discomfort.
These discrepancies in occupant satisfaction and thermal comfort could be due to the fact that the
MM building is about 40 years younger than the NV building. This age difference could contribute to different environmental conditions which may reflect differing survey responses by the
buildings’ users.
Although outside the stated scope of this article, the results also highlight another important
issue regarding the use of subjective and objective building performance metrics. According to
ASHRAE Standard 55 (2010), the PMV–PPD model is used to evaluate the thermal environment
of AC buildings. The adaptive comfort standard, as an alternative to the PMV–PPD model, is
restricted in scope to NV or ‘free-running’ buildings (de Dear and Brager 2002; Nicol and Humphreys 2010). This article demonstrates the complexities of relying solely on subjective indicators
of building performance, e.g. APD and acceptability or POE in general. Many building guidelines
and comfort standards recommend the use of objective criteria, such as temperature and PMV–
PPD to assess a building’s thermal environment. However, this study has shown that PPD
results significantly underestimated the observed levels of thermal dissatisfaction in one building
(MM case study) and overestimated them in another (NV building). If purely assessed using
Fanger’s PMV–PPD model (1970), as expressed in ASHRAE 55–2010, the MM building
would be deemed comfortable as indoor operative temperatures fell within the 80% acceptability
PPD limits. The NV building, however, would be deemed uncomfortable as indoor operative
temperatures were well above the upper limit of 25°C. Despite this, the APD results in Figure
5(b) suggest that the NV occupants found the thermal environment to be quite acceptable
across a broad range of indoor operative temperatures (20–25°C). Occupants of the MM building
expressed greater levels of thermal dissatisfaction (i.e. higher APD values in Figure 5(a)) across
the same range of temperatures. The better-than-predicted acceptability scores in the NV building
have been discussed in terms of forgiveness factors and adaptive opportunities, suggesting that
occupants of both buildings are exhibiting some degree of thermal adaptation to their indoor
environment (de Dear and Brager 1998; de Dear and Brager 2002). However, both case study
buildings possess similar degrees of occupant-orientated environmental control or adaptive
opportunities (Baker and Standeven 1996) to control air movement/ventilation (operable
windows) and lighting (shades and artificial lighting). The only difference is that the MM building
uses centralized heating, ventilation and air-conditioning (HVAC) whenever indoor temperatures
exceed the 25°C trigger temperature. From these findings, it is apparent that occupants’ acceptability of the thermal environment is influenced by their expectations as suggested by the adaptive
hypothesis (de Dear and Brager 2002). Considering only 71% of occupants in the MM building
found the thermal environment to be acceptable as opposed to 85% of occupants surveyed in the
NV building, it, therefore, seems that something extra other than thermal adaptation (Brager and
de Dear 1998) is required to explain the worse-than-expected acceptability in the MM building.
4.1.
Analysis of occupants’ comments and anecdotal evidence
Occupant-based comments and anecdotal evidence are considered important contextual information in POE studies (Bordass and Leaman 2005b; Moezzi and Goins 2011). Since the comparison of quantitative IEQ survey data often lacks the context and complexity of user experiences,
�Intelligent Buildings International
127
text responses can be analysed to provide a deeper understanding of the POE results (Baird 2011;
Moezzi and Goins 2011; Baird, Leaman, and Thompson 2012). Especially in situations when the
results of the POE may not match the physical environmental data, as is the case presented in the
MM building, such data can be used to verify the validity and reliability of both the subjective and
objective results. Many POE questionnaires, such as the BUS POE, offer subjects the option to
give their own comments regarding particular IEQ variables. Other surveys, such as the Occupant
IEQ Satisfaction Survey developed by Center for the Built Environment (Zagreus et al. 2004;
CBE 2012), offer a more detailed response from the participants. Using similar keyword and
phrase extraction methods employed by Moezzi and Goins (2011), text responses were analysed
and compared between each building to validate their respective POE results in Table 1.
The BUS POE questionnaire provides space for commentary. Gathered from the POE questionnaires, occupants’ comments and feedback from the POE, along with their responses, were
entered into spreadsheets. Text searches were used to filter out those comments featuring keywords and/or phrases related to temperature, ventilation, noise and lighting, e.g. ‘too hot’, ‘too
cold’, ‘draught’, ‘noise’, ‘loud’, ‘glare’, etc. The results and list of words used to identify negative
comments, or ‘complaints’, relating to each category across both case study buildings are presented in Table 2. In total, 167 complaints were recorded for the MM building and 108 for the
NV building. Since the NV building predominantly relies on natural ventilation, its users are
prone to complain about uncomfortable working conditions, especially during summer and
winter. As expected, ‘temperature’ was the most common complaint within the NV building
with 56% of comments using phrases such as ‘too hot’ and ‘too cold’. However, within the
MM building, temperature was the second most reported problem with 31% of the comments.
‘Noise from outside’ and ‘from colleagues’ was frequently reported within both buildings,
especially in the MM building wherein it was the most common complaint (38% of the total;
64 comments). Noise complaints were only mentioned 25 times (23%) within the NV building.
The MM building, in comparison to the NV building, also recorded more comments relating to
lighting, i.e. ‘too much glare’ (15% and 9%, respectively) and ventilation, i.e. ‘ventilation’ and
‘draught’ (MM: 16%; NV: 12%).
These results shed light on a common theme evident in many recent POE studies in NV and
MM buildings. By definition, green buildings aim to reduce their environmental impact and
improve the quality of life for the people who live and work in them by incorporating natural ventilation capabilities. However, such buildings are often hotter in summer, colder in winter and
contain more glare (Leaman and Bordass 2007). Many studies reveal air movement, temperature,
glare and noise as the most common causes for dissatisfaction in green buildings (Abbaszadeh
et al. 2006; Brager and Baker 2009; Moezzi and Goins 2011; Baird and Dykes 2012).
However, whilst these studies demonstrate potential areas of improvement and lessons to be
learned in future green building construction, they also illustrate that occupants can potentially
use POE as a conduit to complain. Participants in both buildings expressed lengthy complaints,
often incorporating emotional language into their responses. Occupants predisposed to complain,
Table 2.
List of keywords and phrases used to identify complaints in each category.
Category
Keywords and phrases
Temperature
Hot, cold, heat, temperature
and air conditioning
Air, ventilation, draught and humidity
Noise, outside, students and talking
Glare, lighting, window and blinds
Ventilation
Noise
Lighting
MM building (n = 167)
NV building (n = 108)
51 (31%)
60 (56%)
27 (16%)
64 (38%)
25 (15%)
13 (12%)
25 (23%)
10 (9%)
�128
M.P. Deuble and R.J. de Dear
either due to contextual (e.g. work-related) or physical (e.g. temperature) factors, will exaggerate
poor building performance (Loftness et al. 2009; Vischer 2009; Baird and Dykes 2012; Baird,
Leaman, and Thompson 2012). Whereas the MM case study building was deemed comfortable
on objective criteria, its occupants complained about the building’s performance, particularly
its thermal environment. Furthermore, the discrepancies between occupants’ thermal satisfaction
and acceptability and the POE results suggest the occupants, rather than the building, may be the
problem.
Whilst purely based on anecdotal evidence and occupants’ comments, it is interesting to note
the faculty occupying this contentious MM building. Whilst both buildings are occupied by staff
from the same organization at the same location, there are clearly differences in the occupants’
expectations and attitudes of the thermal environment. We speculate that the occupants of the
MM building are dissatisfied due to a number of non-building-related factors. The building is
occupied by academic and administrative staff from a variety of business and economics departments, including accounting and finance, actuarial studies and business studies. Responsible for
one of the university’s largest student populations, the staff to student ratio for this faculty is the
lowest in the entire university. As a result of these high teaching workloads, staff morale within
this building is commonly acknowledged to be quite low compared to the NV building which is
occupied by various science departments, such as geology, physics, environmental sciences and
astronomy. Prior to moving into their new MM building, the business and economics departments
occupied a conventional AC building. They were deeply distrustful of management and suspicious of the motives behind the new building’s partial air conditioning (MM). Additionally,
given the initial teething problems with the MM building due to deficient commissioning,
these occupants were predisposed to respond to the POE questionnaire in a strongly negative
mood. Figure 4 suggests that these initial technical glitches in the MM system had been corrected.
Nonetheless, the occupants’ perceptions of their MM building remain coloured by their negative
first impressions.
4.2. Recommending an improved methodology for conducting building performance
studies
Since inception, POE has taken several approaches varying from highly technological methodologies involving physical environmental data (Hartkopf, Loftness, and Mill 1986; Sanders
and Collins 1995; Vischer and Fischer 2005; Turpin-Brooks and Viccars 2006; Loftness et al.
2009; Choi, Aziz, and Loftness 2010) to socio-psychological interests where more subjective parameters are employed to evaluate building performance (Vischer and Fischer 2005; Abbaszadeh
et al. 2006; Leaman, Thomas, and Vandenberg 2007; Brown and Cole 2009). However, such
studies are more commonly based on an ‘investigative’ approach utilizing qualitative interviews
and questionnaires (Preiser 1995, 2001a). The POE results from this article raise concerns about
the validity of adopting a single approach. When compared with more objective data collected in
each building, i.e. temperature, thermal satisfaction and acceptability, the different results from
each building were inconsistent. Therefore, POEs alone do not adequately evaluate the overall
performance of a building, nor the extent to which the building meets the needs of its endusers (Vischer 2009). In order to provide a better understanding of how occupants use and interact
with their building, this article recommends more holistic and robust performance evaluations that
incorporate physical environmental data with subjective occupant responses (Ventre 1988; Preiser
2001a; Vischer 2001; Loftness et al. 2009).
Because POEs have commonly focused on building user feedback, much of the information
received can be negative in nature (Vischer 2001). Hence, one of the challenges of POEs going
forward is to identify a reasonable system of informed weighting of user feedback; allowing data
�Intelligent Buildings International
129
to be interpreted according to balanced positive and negative categories (Preiser 2001b; Vischer
2001). Preiser (2001a) suggests that more ‘diagnostic’ POE approaches can combat this problem.
These types of POEs provide a highly sophisticated and detailed assessment enabling the correlation between physical environmental measures with subjective occupant response measures
(Hartkopf, Loftness, and Mill 1986; Preiser 2001a; Preiser and Vischer 2005). Socio-cultural
observation and functional comfort surveys would be further enhanced by the monitoring and
analysis of scientific data on ‘real-time’ workplace environmental conditions, e.g. thermal, acoustic and visual comfort; occupants’ satisfaction and behaviour; as well as physiological and
psychological comfort (Preiser and Vischer 2005; Turpin-Brooks and Viccars 2006; Vischer
2008b; Meir et al. 2009). This information could be used to gauge any adjustments needed in
the controls or environmental settings of the workplace, but also verify users’ problems with
the indoor environment/building performance; thus enabling systematic and reliable feedback
(Vischer 2008a; Loftness et al. 2009).
In summary, whilst a number of alternative methods are available, it is clear that ‘one size does
not fit all’ especially in regard to the physical, psychological and psychosocial influences on
workplace satisfaction. Several studies have demonstrated that a combined approach POE
using more than one tool of assessment can enhance the understanding of a building’s performance (Hartkopf, Loftness, and Mill 1986; Vischer and Fischer 2005; Turpin-Brooks and Viccars
2006; Loftness et al. 2009; Choi, Aziz, and Loftness 2010). A more holistic POE, combining
objective building performance data and subjective satisfaction ratings, may in fact gain a
deeper insight into occupant satisfaction ratings as well as offer a more valid and reliable evaluation of a building’s success.
5.
Conclusions
Over the last four decades, a large number of POEs have been conducted around the world, in a
variety of different building types, using a wide range of methods, goals and frameworks.
However, despite the potential of POE to have a positive effect on subsequent building delivery
and management, the full potential has not yet been realized. In its current form, POE remains a
superficial assessment of building performance, merely providing a face-value assessment of buildings by their occupants. Used in isolation, POE surveys may not be a fair reflection of the building’s
actual performance, i.e. energy consumption/efficiency and IEQ indicators. Since such studies do
not typically obtain parallel instrumental measurements of these variables, e.g. indoor climate, they
lack an objective benchmark against which poor satisfaction ratings can be verified.
The aim of this article was intended to illustrate how supplementary instrumental measurements of a building’s indoor climate could lead to a fundamental reinterpretation of POE
results in office environments. Whilst the study only looked at two office buildings from a tertiary
education institution in Sydney, Australia, it highlights the need for a more robust and holistic
approach to building performance evaluation that includes both objective and subjective data.
However, this does not require a re-invention of the wheel. POE is simply one of a suite of
tools to measure building performance and should be used in conjunction with other methods
to evaluate all aspects of a building, including the social, psychological and physical. It is the
authors view that the combination of objective building performance data and subjective satisfaction ratings may offer a more valid and reliable evaluation of a building’s success.
Acknowledgements
We are enormously grateful to Adrian Leaman for permission to use the BUS questionnaire under license and
his assistance in data analysis. We would also like to thank the University’s Office of Facilities Management
�130
M.P. Deuble and R.J. de Dear
for their support. Finally, and most importantly, we express our appreciation to all the building occupants
who responded to the questionnaires.
Funding
This project was funded in part by an Australian Research Council Discovery Grant [DP0880968].
Notes
1.
2.
Adapted from William Shakespeare’s Romeo and Juliet, Act 1, Prologue.
Questionnaires were administered to all occupants located on floors 6, 7 and 8 in the NV building
between March and April 2009. A separate follow-up study was conducted in March 2010 using the
rest of the occupants (located on floors 2–5).
References
Abbaszadeh, S., L. Zagreus, D. Lehrer, and C. Huizenga. 2006. “Occupant Satisfaction with Indoor
Environmental Quality in Green Buildings.” Proceedings of the healthy buildings 2006 conference:
creating a healthy indoor environment for people, Lisbon, Portugal, June 4–8.
Aggerholm, S. 2002. Hybrid Ventilation and Control Strategies in the Annex 35 Case Studies. IEA Annex 35
Technical Report. Hertfordshire: International Energy Agency.
ASHRAE. 2001. “Chapter 8: Thermal Comfort.” In Handbook of Fundamentals, edited by Ashrae, 8.1–
8.29. Atlanta: American Society of Heating, Refrigerating and Air-Conditioning Engineers.
ASHRAE. 2010. Thermal Environmental Conditions for Human Occupancy. ASHRAE Standard 55–2010.
Atlanta: American Society of Heating, Refrigerating and Air-Conditioning Engineers.
Baird, G. 2005. “Responses to Sustainable Design – User Perceptions of Eight Academic and Library
Buildings.” The 2005 world sustainable buildings conference, Tokyo, Japan, September 27–29, 2009.
Baird, G. 2010. Sustainable Buildings in Practice: What the Users Think. Abingdon: Routledge.
Baird, G. 2011. “Did that Building Feel Good for You? Or – Isn’t it just as Important to Assess and
Benchmark Users’ Perceptions of Buildings as it is to Audit their Energy Efficiency?” Intelligent
Buildings International 3 (2): 124–130.
Baird, G., and C. Dykes. 2012. “The Potential for the Use of the Occupants’ Comments in the Analysis and
Prediction of Building Performance.” Buildings 2 (1): 33–42.
Baird, G., A. Leaman, and J. Thompson. 2012. “A Comparison of the Performance of Sustainable Buildings
with Conventional Buildings from the Point of View of the Users.” Architectural Science Review 55 (2):
135–144.
Baker, N., and M. Standeven. 1996. “Thermal Comfort for Free Running Buildings.” Energy and Buildings
23 (3): 175–182.
BCO. 2007. Guide to Post Occupancy Evaluation. London: British Council for Offices.
Bechtel, R., and R. Srivastava. 1978. Post-Occupancy Evaluation of Housing. Washington, DC: US
Department of Housing and Urban Development.
BoM. 1991. Sydney, New South Wales. Canberra: Bureau of Meteorology, Australian Government
Publishing Service.
BoM. 2011. “Marsfield (Willandra Village).” Climatic Statistics for Australian Locations. Accessed August
23, 2011. http://www.bom.gov.au/climate/averages/tables/cw_066156.shtml
Bordass, B., R. Cohen, M. Standeven, and A. Leaman. 2001. “Assessing Building Performance in Use 2:
Technical Performance of the Probe Buildings.” Building Research and Information 29 (2): 103–113.
Bordass, B., and A. Leaman. 2005a. “Phase 5: Occupancy – Post-Occupancy Evaluation.” In Assessing
Building Performance, edited by W. F. E. Preiser and J. C. Vischer, 72–79. Oxford: Elsevier
Butterworth-Heinemann.
Bordass, W., and A. Leaman. 2005b. “Making Feedback and Post-Occupancy Evaluation Routine 1: A
Portfolio of Feedback Techniques.” Building Research and Information 33 (4): 347–352.
Bordass, W., and A. Leaman. 2005c. “Making Feedback and Post-Occupancy Evaluation Routine 3: Case
Studies of the Use of Techniques in the Feedback Portfolio.” Building Research and Information 33
(4): 361–375.
�Intelligent Buildings International
131
Brager, G., and L. Baker. 2009. “Occupant Satisfaction in Mixed-Mode Buildings.” Building Research and
Information 37 (4): 369–380.
Brager, G. S., and R. J. de Dear. 1998. “Thermal Adaptation in the Built Environment: A Literature Review.”
Energy and Buildings 27 (1): 83–96.
Brown, Z., and R. J. Cole. 2009. “Influence of Occupants’ Knowledge on Comfort Expectations and
Behavior.” Building Research and Information 37 (3): 227–245.
Building Research and Information. 2005. “Special Issue: Building Performance Evaluation.” Building
Research and Information 33 (4): 317–375.
BUS. 2009. “Usable Buildings Trust.” Accessed June 27, 2009. http://www.usablebuildings.co.uk/
WebGuideOSM/index.html
CABE. 2007. A Sense of Place – What Residents Think of Their New Homes. Research Report. London:
Commission for Architecture in the Built Environment.
Carthey, J. 2006. “Post Occupancy Evaluation: Development of a Standardised Methodology for Australian
Health Projects.” The International Journal of Construction Management 6 (1): 63–80.
CBE. 2012. “Occupant Indoor Environmental Quality (IEQ) Survey and Building Benchmarking.” Accessed
November 30, 2012. http://www.cbe.berkeley.edu/research/briefs-survey.htm
Chigot, P. 2005. “Effects of Sound in Offices: Subjective Experience vs. Objective Assessment.” Facilities
23 (3/4): 152–163.
Choi, J., A. Aziz, and V. Loftness. 2010. “Investigation on the Impacts of Different Genders and Ages on
Satisfaction with Thermal Environments in Office Buildings.” Building and Environment 45 (6):
1529–1535.
Cohen, R., M. Standeven, B. Bordass, and A. Leaman. 2001. “Assessing Building Performance in Use 1:
The Probe Process.” Building Research and Information 29 (2): 85–102.
Cooper, I. 2001. “Post-Occupancy Evaluation – Where are You?” Building Research and Information 29 (2):
158–163.
Cooper, B. A., S. Ahrentzen, and B. R. Hasselkus. 1991. “Post-Occupancy Evaluation: An EnvironmentBehaviour Technique for Assessing the Built Environment.” Canadian Journal of Occupational
Therapy 58 (4): 181–188.
de Dear, R. J., and G. Brager. 1998. “Developing an Adaptive Model of Thermal Comfort and Preference.”
ASHRAE Transactions 104 (1): 145–167.
de Dear, R. J., and G. S. Brager. 2002. “Thermal Comfort in Naturally Ventilated Buildings: Revisions to
ASHRAE Standard 55.” Energy and Buildings 34 (6): 549–561.
Derbyshire, A. 2001. “Probe in the UK Context: Editorial.” Building Research and Information 29 (2): 79–
84.
Fanger, P. O. 1970. Thermal Comfort. Copenhagen: Danish Technical Press.
Federal Facilities Council. 2001. Learning from Our Buildings: A State-of-the-Practice Summary of Post
Occupancy Evaluation. Washington, DC: National Academy Press.
Fischer, G. N., C. Tarquinio, and J. C. Vischer. 2004. “Effects of the Self-Schema on Perception of Space at
Work.” Journal of Environmental Psychology 24 (1): 131–140.
Fisk, D. 2001. “Sustainable Development and Post-Occupancy Evaluation.” Building Research and
Information 29 (6): 466–468.
Fountain, M. E., and C. Huizenga. 1997. “A Thermal Sensation Prediction Tool for Use by the Profession.”
ASHRAE Transactions 103 (2): 63–69.
Gonchar, J. 2008. “Looking back and Moving Forward.” Architectural Record 196 (2): 160–169.
Gupta, R., and S. Chandiwala. 2010. “Understanding Occupants: Feedback Techniques for Large-Scale
Low-Carbon Domestic Refurbishments.” Building Research and Information 38 (5): 530–548.
Hadjri, K., and C. Crozier. 2009. “Post-Occupancy Evaluation: Purpose, Potential and Barriers.” Facilities
27 (1/2): 21–33.
Hartkopf, V., V. Loftness, and P. Mill. 1985. “Building Performance Criteria.” In The Building Systems
Integration Handbook, edited by R. Rush, 231–317. New York: John Wiley.
Hartkopf, V. H., V. E. Loftness, and P. A. D. Mill. 1986. “The Concept of Total Building Performance and
Building Diagnostics.” In Building Performance: Function, Preservation and Rehabilitation, ASTM
STP 901, edited by G. Davis, 5–22. Philadelphia, PA: American Society for Testing and Materials.
Heerwagen, J. H., and R. C. Diamond. 1992. Adaptations and Coping: Occupant Response to Discomfort in
Energy Efficient Buildings. 1992 Summer Study on Energy in Buildings. Pacific Grove, CA: American
Council for an Energy Efficient Economy.
ISO. 2003. Ergonomics of the Thermal Environment: Estimation of the Thermal Insulation and Evaporative
Resistance of a Clothing Ensemble. ISO/CD 9920. Geneva: International Standards Organisation.
�132
M.P. Deuble and R.J. de Dear
Jarvis, I. A. 2009. “Closing the Loops: How Real Building Performance Data Drives Continuous
Improvement.” Intelligent Buildings International 1 (4): 269–276.
Leaman, A., and B. Bordass. 1999. “Productivity in Buildings: The ‘Killer’ Variables.” Building Research
and Information 27 (1): 4–19.
Leaman, A., and B. Bordass. 2001. “Assessing Building Performance in Use 4: The Probe Occupant Surveys
and their Implications.” Building Research and Information 29 (2): 129–143.
Leaman, A., and B. Bordass. 2007. “Are Users More Tolerant of ‘Green’ Buildings?” Building Research and
Information 35 (6): 662–673.
Leaman, A., F. Stevenson, and B. Bordass. 2010. “Building Evaluation: Practice and Principles.” Building
Research and Information 38 (5): 564–577.
Leaman, A., L. Thomas, and M. Vandenberg. 2007. “‘Green’ Buildings: What Australian Users Are Saying.”
EcoLibrium 6 (10): 22–30.
Leung, M.-Y., J. Yu, and S. Yu. 2012. “Investigating Key Components of the Facilities Management of
Residential Care and Attention Homes.” Facilities 30 (13/14): 611–629.
Loftness, V. A., A. Aziz, J.-H. Choi, K. Kampschroer, K. Powell, M. Atkinson, and J. Heerwagen. 2009.
“The Value of Post-Occupancy Evaluation for Building Occupants and Facility Managers.”
Intelligent Buildings International 1 (4): 249–268.
Loftness, V., V. Hartkopf, and P. Mill. 1989. “A Critical Framework for Building Evaluation: Total Building
Performance, Systems Integration, and Levels of Measurement and Assessment.” In Building
Evaluation, edited by W. F. E. Preiser, 149–166. New York: Plenum Publishing Corporation.
Loftness, V., V. Hartkopf, L. K. Poh, M. Snyder, Y. Hua, Y. Gu, J. Choi, and X. Yang. 2006. “Sustainability
and Health are Integral Goals for the Built Environment.” Proceedings of the healthy buildings 2006
conference: creating a healthy indoor environment for people, Lisbon, Portugal, June 4–8.
Mallory-Hill, S., W. F. E. Preiser, and C. G. Watson. 2012. “Introduction to Building Performance
Evaluation: Milestones in Evolution.” In Enhancing Building Performance, edited by S. MalloryHill, W. F. E. Preiser, and C. G. Watson, 3–18. Chichester: Wiley-Blackwell.
McIntyre, D. A. 1980. Indoor Climate. London: Applied Science Publishers.
McLaughlin, H. 1975. “Post-Occupancy Evaluation of Hospitals.” AIA Journal 64 (1): 30–34.
Meir, I. A., Y. Garb, D. Jiao, and A. Cielsky. 2009. “Post-occupancy Evaluation: An Inevitable Step toward
Sustainability.” Advances in Building Energy Research 3 (1): 189–220.
Moezzi, M., and J. Goins. 2011. “Text Mining for Occupant Perspectives on the Physical Workplace.”
Building Research and Information 39 (2): 169–182.
NCEUB. 2004. Proceedings of the 2004 Windsor Conference: Closing the Loop: Post-Occupancy
Evaluation: The Next Steps. Windsor: Network for Comfort and Energy Use in Buildings. Accessed
April 29 –May 2, 2004. http://nceub.org.uk
Nicol, F., and M. A. Humphreys. 2010. “Derivation of the Adaptive Equations for Thermal Comfort in FreeRunning Buildings in European Standard EN15251.” Building and Environment, 45 (1): 11–17.
Nicol, F., and S. Roaf. 2005. “Post-Occupancy Evaluation and Field Studies of Thermal Comfort.” Building
Research and Information 33 (4): 338–346.
Preiser, W. F. E. 1995. “Post-Occupancy Evaluation: How to Make Buildings Work Better.” Facilities 13
(11): 19–28.
Preiser, W. F. E. 2001a. “The Evolution of Post-Occupancy Evaluation: Toward Building Performance and
Universal Design Evaluation.” In Learning from Our Buildings: A State-of-the-Practice Summary of
Post Occupancy Evaluation, edited by Federal Facilities Council, 9–22. Washington, DC: National
Academy Press. Technical Report No. 145.
Preiser, W. F. E. 2001b. “Feedback, Feedforward and Control: Post Occupancy Evaluation to the Rescue.”
Building Research and Information 29 (6): 456–459.
Preiser, W. F. E., and J. L. Nasar. 2008. “Assessing Building Performance: Its Evolution from PostOccupancy Evaluation.” International Journal of Architectural Research 2 (1): 84–99.
Preiser, W. F. E., H. Z. Rabinowitz, and E. T. White. 1988. Post-Occupancy Evaluation. New York: Van
Nostrand Reinhold.
Preiser, W. F. E., and U. Schramm. 2002. “Intelligent Office Building Performance Evaluation.” Facilities 20
(7): 279–287.
Preiser, W. F. E., and J. C. Vischer. 2005. “The Evolution of Building Performance Evaluation: An
Introduction.” In Assessing Building Performance, edited by W. F. E. Preiser and J. C. Vischer, 3–14.
Oxford: Elsevier.
RIBA. 1962. The Architect and His Office: A Survey of Organisation, Staffing, Quality of Service and
Productivity. London: Royal Institute of British Architects.
�Intelligent Buildings International
133
RIBA. 1965. Handbook of Architectural Practice and Management. RIBA Publications. London: Royal
Institute of British Architects.
Riley, M., N. Kokkarinen, and M. Pitt. 2010. “Assessing Post Occupancy Evaluation in Higher Education
Facilities.” Journal of Facilities Management 8 (3): 202–213.
Riley, M., C. Moody, and M. Pitt. 2009. “A Review of the Evolution of Post-Occupancy Evaluation as a
Viable Performance Measurement Tool.” Proceedings of the BEAN conference, Built Environment
and Sustainable Technologies (BEST) Research Centre, John Moores University, Liverpool, UK,
May 19–20.
Roethlisberger, F. J., and W. J. Dickson. 1939. Management and the Worker. Cambridge, MA: Harvard
University Press.
Rowe, D. 2003. “A Study of a Mixed Mode Environment in 25 Cellular Offices at the University of Sydney.”
International Journal of Ventilation: HybVent – Hybrid Ventilation Special Edition 1 (4): 53–64.
Sanders, P. A., and B. L. Collins. 1995. Post-Occupancy Evaluation of the Forrestal Building. NISTIR 5591.
Washington, DC: U.S. Department of Commerce.
Schwede, D. A., H. Davies, and B. Purdey. 2008. “Occupant Satisfaction with Workplace Design in New and
Old Environments.” Facilities 26 (7/8): 273–288.
Stevenson, F., and A. Leaman. 2010. “Evaluating Housing Performance in Relation to Human Behaviour:
New Challenges.” Building Research and Information 38 (5): 437–441.
Thomas, L. E. 2010. “Evaluating Design Strategies, Performance and Occupant Satisfaction: A Low Carbon
Office Refurbishment.” Building Research and Information 38 (6): 610–624.
Turpin-Brooks, S., and G. Viccars. 2006. “The Development of Robust Methods of Post Occupancy
Evaluation.” Facilities 24 (5/6): 177–196.
Usable Buildings Trust. 2008. Building Use Studies 2-Page Occupant Questionnaire 2008 Version. Licensed
18 February 2008–18 February 2010. London: Usable Buildings Trust.
Ventre, F. 1988. “Sampling Buildings Performance.” Facilities 2000 Symposium, Grand Rapids, MI.
Vischer, J. C. 1985. “The Adaptation and Control Model of User Needs: A New Direction for Housing
Research.” Journal of Environmental Psychology 5 (3): 287–298.
Vischer, J. C. 1986. “A Conceptual Framework for Buildings-In-Use: The Merging of Objective and
Subjective Approaches to Building Performance Assessment.” In The Impact of the Work
Environment on Productivity, edited by M. Dolen and R. Ward, 17–19. Washington, DC:
Architectural Research Centres Consortium.
Vischer, J. C. 1993. “Using Feedback from Occupants to Monitor Indoor Air Quality.” Proceedings of the
IAQ93 conference, Denver, CO, American Society of Heating, Refrigeration and Air Conditioning
Engineers, November 7–10.
Vischer, J. 2001. “Post-Occupancy Evaluation: A Multifaceted Tool for Building Improvement.” In
Learning from Our Buildings: A State-of-the-Practice Summary of Post Occupancy Evaluation,
edited by Federal Facilities Council, 23–24. Washington, DC: National Academy Press. Technical
Report No. 145.
Vischer, J. 2004. Revaluing Construction: Building Users’ Perspective. Mini-Report for the CIB World
Building Congress 2004. Torondo: CIB.
Vischer, J. C. 2005. “Measuring the Impact of Moving on Building Users: Can New Workspace Change
Organisational Culture.” EcoLibrium 4 (September): 22–27.
Vischer, J. 2008a. “Towards a User-Centred Theory of the Built Environment.” Building Research and
Information 36 (3): 231–240.
Vischer, J. 2008b. “Towards an Environmental Psychology of Workspace: How People Are Affected by
Environments at Work.” Architectural Science Review 51 (2): 97–108.
Vischer, J. 2009. “Applying Knowledge on Building Performance: From Evidence to Intelligence.”
Intelligent Buildings International 1 (4): 239–248.
Vischer, J. C., and G. N. Fischer. 2005. “User Evaluation of the Work Environment: A Diagnostic
Approach.” Le travail humain 68 (1): 73–96.
Watson, C. 2005. Post Occupancy Evaluation – Braes High School, Falkirk. Edinburgh, UK: Scottish
Executive.
Way, M., and W. Bordass. 2005. “Making Feedback and Post-Occupancy Evaluation Routine 2: Soft
Landings – Involving Design and Building Teams in Improving Performance.” Building Research
and Information 33 (4): 353–360.
Whyte, J., and D. M. Gann. 2001. “Closing the Loop between Design and Use: Post-Occupancy Evaluation.”
Building Research and Information 29 (6): 460–462.
�134
M.P. Deuble and R.J. de Dear
Zagreus, L., C. Huizenga, E. Arens, and D. Lehrer. 2004. “Listening to the Occupants: A Web-Based Indoor
Environmental Quality Survey.” Indoor Air 14 (Suppl. 8): 65–74.
Zhang, Y., and P. Barrett. 2010. “Findings from a Post-Occupancy Evaluation in the UK Primary Schools
Sector.” Facilities 28 (13): 641–656.
Zimmerman, A., and M. Martin. 2001. “Post-occupancy Evaluation: Benefits and Barriers.” Building
Research and Information 29 (2): 168–174.
Zimring, C. M., and J. E. Reizenstein. 1980. “Post-Occupancy Evaluation: An Overview.” Environment and
Behavior 12 (4): 429–450.
Zimring, C., and T. Rosenheck. 2001. “Post-Occupancy Evaluation and Organisational Learning.” In
Learning from Our Buildings: A State-of-the-Practice Summary of Post-Occupancy Evaluation,
edited by Federal Facilities Council, 42–53. Washington, DC: National Academy Press, Technical
Report No. 145.
�Copyright of Intelligent Buildings International is the property of Earthscan and its content
may not be copied or emailed to multiple sites or posted to a listserv without the copyright
holder's express written permission. However, users may print, download, or email articles for
individual use.
�
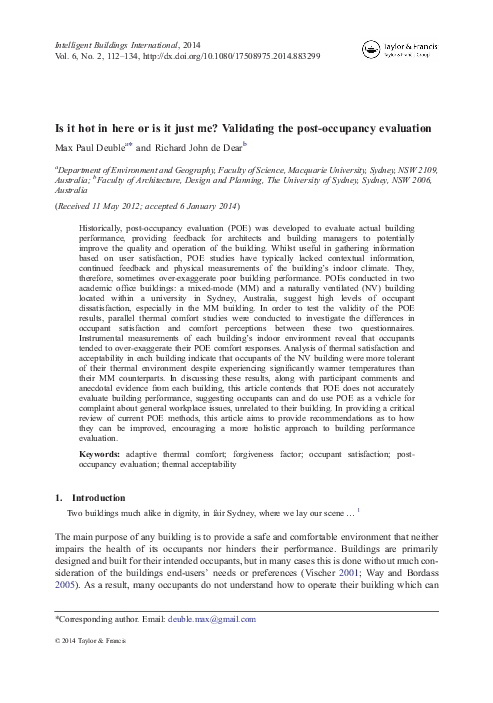
 Max Deuble
 Richard de Dear