Academia.edu no longer supports Internet Explorer.
To browse Academia.edu and the wider internet faster and more securely, please take a few seconds to upgrade your browser.
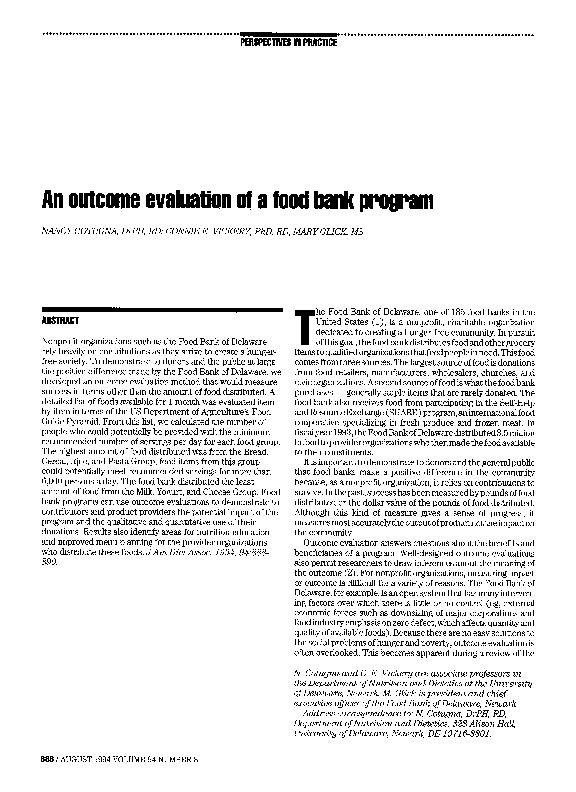
An outcome evaluation of a food bank program
An outcome evaluation of a food bank program
 Nancy Cotugna
1994, Journal of the American Dietetic Association
Related Papers
International Journal of Food Sciences & Nutrition
Impact of food pantry donations on diet of a low- income population2018 •
Objective: This cross-sectional study assessed the effect of food donations on total nutrient intake of clients of a food pantry in Central Texas. Methods: Nutrient intakes of total, base and food donation diets were estimated for 112 food pantry recipients using specific questionnaires; and then compared to the dietary reference intakes (DRI) and 2015–2020US Dietary Guidelines. Results: Food donations accounted for more than half of the client’s daily intake of energy, carbohydrates, vitamin B6, phosphorus, copper and selenium. Yet, daily total intake remained less than their DRIs for carbohydrates, poly-unsaturated fats, dietary fiber, fat soluble vitamins and vitamin C, and was even lower for calcium, magnesium and potassium. Total food intake of clients almost met the US Dietary Guidelines for refined grains, fruits, vegetables, and meat; however, the amount of whole grains and dairy was inadequate. Conclusions: Supplemental foods offered at food pantries are an important resource for improving nutrient intake of low-income populations.
2019 •
Objective: To increase the nutritional value of donations given by donor organizations to the Food Bank based on a Red-Yellow-Green (RYG) scale. Background: Food banks have been planted across the Southeastern Virginia region to help with the prevalent issue of food insecurity. The food bank receives various food donations. The goal, however, is to implement education to the donor organizations to improve the nutritional value of the donations based on the Red-Yellow-Green scale. Participants and Methods: A Quasi-Experimental Before-and-After design across multiple groups will be used. Consistent donor groups will be selected for the intervention and baseline donations will be monitored for a month based on health value. After the first month, the one-week education intervention will be implemented. Donations from the donor organizations will, then, be monitored for an additional month. Finally, the nutritional value of the donations will be assessed based on the RYG scale. Analysis...
Journal of Hunger & Environmental Nutrition
Food pantries as partners in population health: Assessing organizational and personnel readiness for delivering nutrition-focused charitable food assistance2018 •
Journal of Public Health
Pilot testing an intervention to educate and promote nutritious choices at food pantries2021 •
This study aimed to assess the impact of the Supporting Wellness at Pantries (SWAP) system on client food selections at a food pantry. In a pre–post comparison study design, a client-choice food pantry implemented SWAP by reorganizing its inventory to promote healthy options. Each product was ranked as “choose often” (green), “sometimes” (yellow), or “rarely” (red) based on saturated fat, sodium, and sugar. Signage was added to indicate each item’s SWAP rank and healthier foods were placed at eye level. Client food baskets were assessed at time 1 (n = 121) and time 2 (n = 101). The proportions of green and red foods selected were compared using regression analyses. The regression analyses showed that the proportion of green foods selected by clients increased by 11% (p < 0.001) and the proportion of red foods selected decreased by 7% (p < 0.001) after SWAP was implemented (n = 222). SWAP has the potential to positively shift client choices among the items available in a food p...
Preventive Medicine Reports
Meals for Good : An innovative community project to provide healthy meals to children in early care and education programs through food bank catering2017 •
Innovative approaches to childhood obesity prevention are warranted in early care and education (ECE) settings, since intervening early among youth is recommended to promote and maintain healthy behaviors. The objective of the Meals for Good pilot was to explore feasibility of implementing a food bank-based catering model to ECE programs to provide more nutritious meals, compared to meals brought from home (a parent-prepared model). In 2014–2015, a 12-month project was implemented by a food bank in central Florida in four privately-owned ECE programs. An explanatory sequential design of a mixed-methods evaluation approach was utilized, including a pre-post menu analysis comparing parent-prepared meals to the catered meals, and stakeholder interviews to determine benefits and barriers. The menu analysis of lunches showed daily reductions in calories, fat, and saturated fat, but an increase in sodium in catered meals when compared to parent-prepared meals. Interviews with ECE directors, teachers, parents, and food bank project staff, identified several benefits of the catered meals, including healthfulness of meals, convenience to parents, and the ECE program's ability to market this meal service. Barriers of the catered meals included the increased cost to parents, transportation and delivery logistics, and change from a 5 to a 2-week menu cycle during summer food service. This pilot demonstrated potential feasibility of a food bank-ECE program partnership, by capitalizing on the food bank's existing facilities and culinary programming, and interest in implementing strategies focused on younger children. The food bank has since leveraged lessons learned and expanded to additional ECE programs.
International Journal of Environmental Research and Public Health
Associations between Food Pantry Size and Distribution Method and Healthfulness of Foods Received by Clients in Baltimore City Food Pantries2021 •
This study aimed to evaluate the association of the overall nutritional quality and the weight share of specific types of foods received by food pantry clients with food pantry size and distribution method. Data on healthy food weights using the gross weight share (GWS) of select foods and the validated Food Assortment Score Tool (FAST) were collected from 75 food pantry clients in Baltimore, Maryland. The average FAST score across the study population was 63.0 (SD: 10.4). Overall, no statistically significant differences in average FAST scores by pantry size and distribution method were found. However, among client-choice pantries, clients of small pantries had higher scores (p < 0.05) while among medium pantries, clients of traditional pantries had higher scores (p < 0.01). Subgroup analysis of GWS was stratified by pantry size and distribution methods. Findings suggested multi-level, multi-component interventions combining environmental strategies are needed to enhance the ...
Public Health Nutrition
Food security of food recipients of a food pantry and soup kitchen2019 •
Objective: To discern the impact of food donations provided by a food pantry and soup kitchen on food security. Design: In this cross-sectional study, participants completed a demographic questionnaire, core food security module, FFQ and list of food donations. The FFQ was utilized to assess diet quality as estimated via the 2010 Healthy Eating Index. Setting: Clients were selected randomly from a food pantry and soup kitchen in Central Texas, USA. Participants: A total of 222 adults. Results: Approximately 73 % of participants lacked food security. Compared with the food secure, the food insecure consisted of 61 % men, 42 % Caucasians, 56 % single and 67 % homeless. Also, of the food insecure, 60 % were soup kitchen clients and 64 % had an annual income < $US 1000 (P < 0·01). The probability of food insecurity was reduced by ≥1·17-fold when the total dietary intake included the food donations, as these were rich in fruits, total vegetables and grains, dairy and protein foods (P < 0·05). Conclusions: Food insecurity was quite prevalent in this sample of individuals who visited food pantries and soup kitchens. The addition of food donations improved the quality of the participants' total diet and had a positive influence on food security. Thus, community organizations should financially support these food assistance agencies and strive to offer a variety of healthy and tasty foods in adequate quantities to provide optimum diet quality.
BMC Public Health
Voices for food: methodologies for implementing a multi-state community-based intervention in rural, high poverty communities2018 •
Journal of Hunger & Environmental Nutrition
Informing the design of a food security and public health nutrition pilot intervention for clients of a community-based organization contending with urban poverty2018 •
RELATED PAPERS
Journal of Theoretical and Philosophical Psychology
Autoepistemology When Disentangling "North and South Entanglements"2023 •
Postscriptum Polonistyczne
Cóż po poet(k)ach w czasach antropocenu? Zarys propozycji trójkąta antropocenicznego2023 •
Open Journal of Modern Hydrology
Application of MODIS-Based Monthly Evapotranspiration Rates in Runoff Modeling: A Case Study in Nebraska,USA2013 •
Open Journal of Geology
Technological Characterization and Industrial Application of Tunisian Clays from Makthar Area (Central Tunisia) in the Ceramic Industry2016 •
The journal of sexual medicine
Why Is Impaired Sexual Function Distressing to Women? The Primacy of Pleasure in Female Sexual Dysfunction2014 •
Digital Presentation and Preservation of Cultural and Scientific Heritage
Digitisation and Presentation of Historical Materials in a Virtual Exhibition ‘The Image of India in Bulgaria: from the late 19 th to the late 20 th Century’2013 •