Journal of Neuroscience Methods 97 (2000) 45 – 50
www.elsevier.com/locate/jneumeth
Chronaxie calculated from current– duration and voltage – duration
data
Jan Holsheimer a,*, Emiel A. Dijkstra a, Hilde Demeulemeester b, Bart Nuttin b
a
Department of Electrical Engineering, Institute for Biomedical Technology, Uni6ersity of Twente, PO Box 217,
NL-7500 AE Enschede, The Netherlands
b
Department of Neurological Surgery, Uni6ersity Hospital Gasthuisberg, 3000 Leu6en, Belgium
Received 5 July 1999; received in revised form 21 December 1999; accepted 27 December 1999
Abstract
To determine the rheobase and the chronaxie of excitable cells from strength– duration curves both constant-current pulses and
constant-voltage pulses are applied. Since the complex impedance of the electrode-tissue interface varies with both the pulsewidth
and the stimulation voltage, chronaxie values estimated from voltage– duration measurements will differ from the proper values
as determined from current – duration measurements. To allow a comparison of chronaxie values obtained by the two stimulation
methods, voltage– duration curves were measured in human subjects with a deep brain stimulation electrode implanted, while the
current and the load impedance of the stimulation circuit were determined in vitro as a function of both stimulation voltage and
pulsewidth. Chronaxie values calculated from voltage– duration data were shown to be 30 – 40% below those estimated from
current – duration data. It was also shown that in the normal range of stimulation amplitudes (up to 7 V) the load impedance
increases almost linearly with the pulsewidth. This result led us to present a simple method to convert voltage– duration data into
current – duration data, thereby reducing the error in the calculated chronaxie values to : 6%. For this purpose voltage– duration
data have to be measured for pulses up to 10 – 20 times the expected chronaxie. © 2000 Elsevier Science B.V. All rights reserved.
Keywords: Current – duration measurements; Voltage – duration measurements; Chronaxie; Rheobase; Deep brain stimulation
1. Introduction
Ith · PW= Irh · PW+ Irh · C
The strength– duration curve of an excitable cell represents the relation between the pulsewidth and the
threshold stimulus current (Ith), or voltage (Vth). The
curve is characterized by a reduction of the stimulus
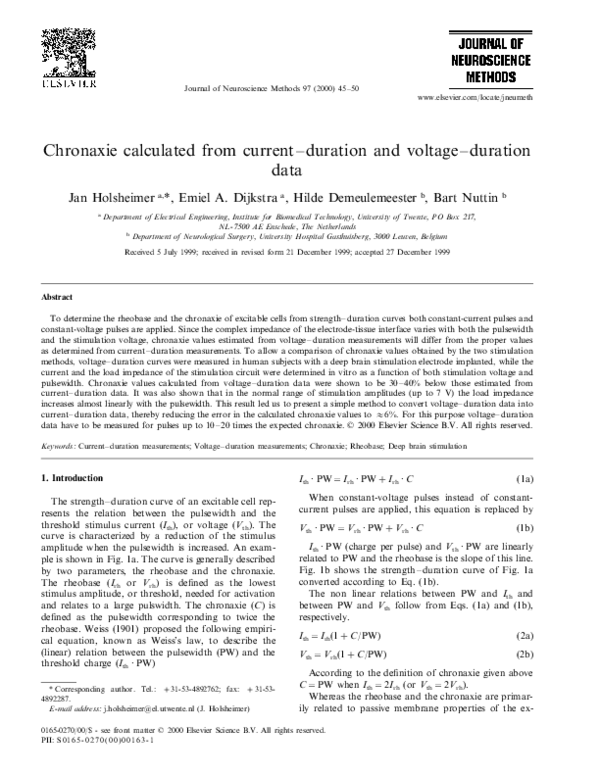
amplitude when the pulsewidth is increased. An example is shown in Fig. 1a. The curve is generally described
by two parameters, the rheobase and the chronaxie.
The rheobase (Irh or Vrh) is defined as the lowest
stimulus amplitude, or threshold, needed for activation
and relates to a large pulswidth. The chronaxie (C) is
defined as the pulsewidth corresponding to twice the
rheobase. Weiss (1901) proposed the following empirical equation, known as Weiss’s law, to describe the
(linear) relation between the pulsewidth (PW) and the
threshold charge (Ith · PW)
When constant-voltage pulses instead of constantcurrent pulses are applied, this equation is replaced by
* Corresponding author. Tel.: + 31-53-4892762; fax: + 31-534892287.
E-mail address: j.holsheimer@el.utwente.nl (J. Holsheimer)
Vth · PW= Vrh · PW +Vrh · C
(1a)
(1b)
Ith · PW (charge per pulse) and Vth · PW are linearly
related to PW and the rheobase is the slope of this line.
Fig. 1b shows the strength– duration curve of Fig. 1a
converted according to Eq. (1b).
The non linear relations between PW and Ith and
between PW and Vth follow from Eqs. (1a) and (1b),
respectively.
Ith = Irh(1+ C/PW)
(2a)
Vth =Vrh(1+C/PW)
(2b)
According to the definition of chronaxie given above
C =PW when Ith = 2Irh (or Vth =2Vrh).
Whereas the rheobase and the chronaxie are primarily related to passive membrane properties of the ex-
0165-0270/00/$ - see front matter © 2000 Elsevier Science B.V. All rights reserved.
PII: S 0 1 6 5 - 0 2 7 0 ( 0 0 ) 0 0 1 6 3 - 1
�46
J. Holsheimer et al. / Journal of Neuroscience Methods 97 (2000) 45–50
citable cells (the leakage conductivity and the membrane time constant, respectively), these parameters are
also affected by the voltage-dependent membrane conductance and by geometrical factors, such as the fiber
diameter and the distance between the target cells and
the stimulating electrode (Bostock, 1983; Bostock et al.,
1997; West et al., 1983; Mogyoros et al., 1999).
Both constant-current pulses and constant-voltage
pulses are used to determine strength– duration curves
and to calculate the rheobase and the chronaxie
(Ranck, 1975). However, the stimulus current and
voltage will generally not be proportional, because the
impedance of the electrode-tissue interface varies with
both the stimulation voltage and frequency (Bard et al.,
1980). When pulses are applied, their frequency content
varies with the pulsewidth. Therefore, one would expect
chronaxie values to be different when calculated from
either current – duration (I –t) or voltage– duration (V–
t) measurements. For a correct estimation of the
rheobase and the chronaxie constant-current pulses
should be applied, because voltage gradients in the
resistive tissue surrounding an excitable cell and the
resulting membrane currents are proportional to the
Fig. 1. (a) Experimental voltage– duration data, rheobase and
chronaxie; (b) same data multiplied with pulsewidth and corresponding linear curve fit and R 2 value.
injected current. Unfortunately, constant-current stimulators are not always available, particularly in stimulators for clinical use.
In this study we compared chronaxie values obtained
with constant-voltage and constant-current stimulation,
by measuring V – t curves from human subjects stimulated with a deep brain stimulation (DBS) electrode for
the elimination of tremor and determining the current
and the load impedance of the stimulation circuit invitro as a function of the stimulation voltage and the
pulsewidth. The current data were used to convert the
V – t data into charge – duration data and the chronaxie
values were calculated according to Eq. (1a). Based on
the results of this study, a simpler method to obtain a
reliable estimate of the chronaxie from V –t data is
proposed. The patient data included in this study are
part of a more extensive study on chronaxie to identify
the target neuronal elements in DBS (Holsheimer et al.,
submitted).
2. Methods
2.1. Voltage– duration measurements
V– t data were measured from seven patients suffering from Parkinson’s disease or essential tremor. These
patients had a quadrupolar DBS electrode (model 3387,
Medtronic, MN) placed stereotactically in the ventral
intermediate nucleus of the thalamus on one side or
bilaterally (Benabid et al., 1993). All four cylindrical
electrode contacts (90% Pt, 10% Ir), situated on the
surface of a polyurethane tube with a diameter of 1.27
mm, had a length of 1.5 mm and were separated by 1.5
mm. The electrode was connected via a subcutaneous
extension cable to a battery powered, constant voltage
pulse generator (Itrel2 or Itrel3, Medtronic), placed
subcutaneously in the chest or abdomen. Each electrode contact could selectably be connected as a
cathode or an anode, or could be disconnected. All
parameters, including pulse width, pulse rate, voltage
and electrode connections, were set by an external
programmer (model 7432, Medtronic).
At the time the V– t measurements were done, the
patients were on a stable dose of medication for at least
1 month. Pulses were applied bipolarly at a rate of 130
pps. During a test session, threshold voltages (Vth) for
the elimination of tremor were determined in a patient
at pulsewidths of 60, 90, 120, 150, 180, 210, 300 and
450 ms by increasing the stimulation voltage in steps of
0.1 V at 5 s intervals until the tremor vanished completely (which occurred within 2 – 3 s). The way the
presence of tremor was determined remained constant
throughout a test session for each patient. Among
patients, however, the testing procedure could differ
depending on the type of tremor (e.g. the patient held
�J. Holsheimer et al. / Journal of Neuroscience Methods 97 (2000) 45–50
47
voltages on both sides of Rseries (V1 and V2) were
measured.
A HP 33120A waveform generator was used as a
constant voltage source (50 V internal resistance),
providing rectangular 0.5 ms pulses with amplitude V1
(0.5 – 7.0 V, at 0.5 V intervals). Each monophasic pulse
was immediately followed by an identical pulse of
opposite polarity to quickly unload the electrode double layer capacitance (Cdl). The interval between the
pulse pairs was 70 ms. V1 and V2 were measured by a
digital oscilloscope (HP 54520A) at sample intervals
dt =4 ms and averaged over 256 pulses.
From the voltages V1 and V2 the following parameters were calculated:
the instantaneous current I passing the circuit
I(t) =(Vl(t) −V2(t))/Rseries
Fig. 2. Experimental setup to determine the electrode impedance Zel
for different pulsewidths and voltages; for details see text.
the instantaneous load impedance Zload
Zload(t)= V1(t)/I(t)
the arm stretched horizontally, or the arm was in a
relaxed position). When during a test session a change
in symptomatology was observed between stimulation
off periods, the V –t data of the corresponding patient
were excluded from this study.
From the V– t data Vth·PW was calculated and
graphs were made of Vth·PW as a function of PW (Fig.
1b). A linear regression line fitting the data points best
(minimum root mean square error) was calculated, as
well as the corresponding squared correlation coefficient (R 2). The rheobase and chronaxie were determined from the regression line according to Eq. (1b).
The stimulation system allowed the measurement of
the load impedance as well. This measurement was
calibrated for a pulse amplitude of 1.0 V and a
pulsewidth of 0.21 ms.
1 n
% Z
n i = 1 load,i
(5)
the instantaneous impedance of each electrode Zel
Zel(t)=(Zload(t)− (Rseries + 2Rcable + Rsaline))/2
(4)
the average load impedance Zload for pulsewidth PW
(0– 0.5 ms)
Z0 load(PW)=
(3)
(6)
the charge Q injected by a monophasic pulse with
duration PW (0– 0.5 ms)
Q(PW)=
PW n
% Ii
n i=1
(7)
2.2. In-6itro impedance measurements
The measurement arrangement is shown in Fig. 2. A
model 3387 DBS electrode was immersed in physiological saline (0.9% NaCl) and two contacts were connected
to a voltage source via a series resistance (Rseries) and
the electrode cable (Rcable). The contacts have an electrode-tissue impedance Zel and are connected by the
resistance of the saline (Rsaline). Zel consists of a double
layer capacitance (Cdl) in parallel to a voltage-dependent impedance which includes the Warburg impedance
(W) (see inset Fig. 2). When the voltage across Zel is
below the threshold of anodal/cathodal electrolysis all
current flows via Cdl. Rseries was chosen such that the
total load impedance (Zload) for a 1.0 V/0.21 ms pulse is
similar to the mean value as measured in the brain. In
this way a realistic voltage across the electrode-tissue
interface was obtained at any stimulation voltage. The
The voltages of the measured V– t data were substituted by the charge calculated for the corresponding
pulsewidths. These data were used to calculate the
chronaxie according to Eq. (1a) and to compare the
results with those obtained by using the original V– t
data and Eq. (1b).
3. Results
3.1. Voltage– duration measurements
V– t and load impedance measurements were performed at the neurosurgery department of the University hospital Gasthuisberg (Leuven, Belgium). Data on
seven subjects were included in this study. From each
subject the Vth data were converted into Vth · PW data
�J. Holsheimer et al. / Journal of Neuroscience Methods 97 (2000) 45–50
48
and the rheobase and chronaxie were determined from
the linear regression line, according to Eq. (1b). The
means, S.D.’s and minimum/maximum values are presented in Table 1.
3.2. In-6itro impedance measurements
To obtain a realistic Zload, similar to the mean measured value, the selected value of Rseries was 1000 V,
resulting in an average load impedance Zload of 1243 V
for a 1.0 V /0.21 ms pulse (see Fig. 3b).
Table 1
Means, S.D.’s, minima and maxima of electrical parameters obtained
from seven subjects and correlation of linear approximation
Load (V)
Mean
S.D.
Minimum
Maximum
1297
185
1068
1540
Rheobase (V)
Chronaxie (ms)
R2
1.34
0.68
0.75
2.55
66.1
15.4
47.7
93.8
0.97
0.02
0.94
0.99
Fig. 4. Charge per pulse as a function of amplitude calculated for
constant-voltage pulses of (from lower to upper curve) 60, 90, 120,
150, 180, 210, 300 and 450 ms pulsewidth.
In Fig. 3a, two values of the applied voltage V1 and
the corresponding currents (according to Eq. (3)) are
presented. It is shown that the current declined with
increasing pulsewidth. Since V1 was virtually constant,
Zload will increase with increasing pulsewidth. Because
the curves of Zload measured at 0.5– 7 V pulses as a
function of the pulsewidth (Eq. (5)), were almost identical, only the mean of all curves is presented in Fig. 3b.
As shown by the linear regression line in this figure,
Zload increased almost proportional to the pulsewidth
(R 2 =0.99) from :1164 V (PW :0 ms) to :1343 V
(PW =0.5 ms), being an increase of:15.4%.
When PW:0 ms, the impedance of the double layer
capacitance Cdl of the electrodes will be 0 and Zload will
include only the resistive components of the stimulation
circuit, i.e. Rseries (1000 V), 2Rlead (76 V) and Rsaline (Fig.
2). The latter was thus :88 V, whereas the instantaneous Zel increased from 0 to :179 V at PW = 0.5 ms.
The injected charge Q(PW) was calculated by integrating the current corresponding to each stimulation
pulse V1 (0.5 – 7 V) over time, according to Eq. (7). In
Fig. 4 the charge is presented as a function of V1 for
any pulsewidth used in the V – t measurements on patients (60– 450 ms). It is shown that the injected charge
increased linearly with increasing V1 for any
pulsewidth, although the gradients Q/V were not proportional to the pulsewidths, as shown in Table 2. E.g.
the ratio of the gradients for PW =450 and 90 ms was
4.37 instead of 5.0. This discrepancy results from the
increase of Zload with increasing pulsewidth.
3.3. Con6ersion of 6oltage – duration data into
charge-duration data
Fig. 3. (a) Voltage and current measured during biphasic constantvoltage pulses of 2 V (V1, I1) and 5 V (V2, I2); (b) solid line: average
load impedance as a function of pulsewidth, obtained from almost
identical curves at 1 – 7 V amplitude; dashed line: linear curve fit (with
equation and correlation coefficient).
The in vitro measurement data relating pulse charge
to pulse voltage and pulsewidth (Table 2) were used to
convert V –t measurement data into charge – duration
(Q– t) data which correspond to (fictive) I –t measure-
�J. Holsheimer et al. / Journal of Neuroscience Methods 97 (2000) 45–50
49
Table 2
Pulsewidths and corresponding gradients of the injected charge as a function of the stimulation voltage (Fig. 4)
PW (ms)
Q/V (mC/V)
60
0.051
90
0.075
120
0.096
150
0.120
ment data. In Table 3 the chronaxie values estimated
from both the V– t measurement data of three subjects
and the corresponding calculated Q– t data are presented. The three selected data sets corresponded with
the highest, the lowest and an intermediate chronaxie
value and the linear approximations had an R 2 value of
at least 0.97. The data show that the chronaxie estimated from V– t measurements is : 30– 40% less than
the value estimated from I –t measurements.
Another method to estimate the chronaxie from V –t
measurements takes advantage of the result of the in
vitro measurements that the load impedance increases
almost linearly with the pulsewidth (Fig. 3b). This
method is illustrated by the curves shown in Fig. 5.
Curve A represents an I– t curve, calculated according
to Eq. (2a) with arbitrary values of the rheobase (1 mA)
and the chronaxie (0.1 ms). The V –t curve (B) is
calculated from curve A, using an arbitrary load
impedance (1000 V) at the smallest pulsewidth and an
arbitrary linear increase of 40% for each ms increase.
Curve B is now considered as the set of V –t measurement data. If curve A would have reached the (constant) rheobase level at e.g. 1 ms pulsewidth, the slope
of curve B beyond 1 ms would have been identical to
the slope of the load impedance and the I–t curve
could be determined exactly by subtracting values from
the V –t curve (B) corresponding to its slope beyond 1
ms. However, since curve A is still slightly descending
beyond 1 ms (5% from 1 to 2 ms), the corresponding
part of curve B does not represent the slope of the load
impedance accurately. Since curve A approximates a
constant amplitude most at the largest pulsewidths
available, the slope of the load impedance will fit the
slope of curve B best at these large pulsewidths. Accordingly, the slope of curve B between 1.5 and 2 ms
was taken as the slope of the load impedance for the
whole range of pulsewidths, as shown by curve C. (This
slope was 8% less than the value initially applied to
curve A to obtain curve B.) Now the I –t curve (with
arbitrary current values) can simply be constructed by
subtracting the values of curve C from the corresponding ones of curve B. These I– t data are indicated in
Fig. 5 by triangles. It is shown that for pulsewidths
exceeding 0.4 ms these datapoints differ slightly from
the initial I– t curve A. Therefore, only datapoints up to
0.4 ms pulsewidth were used to estimate the chronaxie.
Its value was 0.094 ms, being 6% below the correct
value (0.1 ms). When all I− t datapoints up to 2 ms
pulsewidth were used, the corresponding chronaxie was
21% too low (0.079 ms). Calculation from datapoints
180
0.140
210
0.163
300
0.225
450
0.328
up to 0.4 ms pulsewidth from the V – t curve (B) resulted in a chronaxie 30% too low. The correlation
coefficient of the data and the linear regression line
exceeded 0.99 in all cases.
4. Discussion
It has been shown that the chronaxie calculated from
strength– duration measurements using constantvoltage stimuli is 30– 40% below the value estimated in
a correct way, i.e. from constant-current measurements.
This discrepancy is due to the non linear relation
between stimulation voltage and current, caused by the
complex electrode impedance (Zel) which varies with
both pulsewidth and voltage across Zel. Under the
conditions of clinical DBS, as investigated in this study,
the current flows via the double layer capacitance (:
1.5 mF) and results in an almost linear increase of Zel
with increasing pulsewidth. (A capacitor has a similar,
Table 3
Chronaxie values based on V–t data and data corrected for variable
electrode impedance
Subject
Chronaxie (ms)
V–t data
1
2
3
94
48
74
I–t data
132
76
109
Fig. 5. Curve A: modeled I– t curve, 1 V rheobase, 0.1 ms chronaxie;
curve B: V– t curve calculated from A using 1000 V impedance at 50
ms pulsewidth and 40% increase/ms; curve C: slope of curve B
between 1.5 and 2.0 ms; �: I –t data calculated by subtraction of
curve C from curve B.
�50
J. Holsheimer et al. / Journal of Neuroscience Methods 97 (2000) 45–50
slight reduction of the slope of its average load
impedance as the curve shown in Fig. 3b.) Because the
other components of the stimulation circuit, including
the tissue in-between the electrode contacts are resistive,
the total load impedance increases almost linearly with
the pulsewidth as well. An additional current via the
Warburg impedance and thus a reduction of Zel would
only occur at stimulation amplitudes resulting in a
voltage across Zel exceeding the threshold for anodal/
cathodal electrolysis (Bard et al., 1980). Due to the shape
of the strength– duration curve, however, this effect is
highly unlikely. At the smallest pulsewidth applied (0.06
ms) the maximum value of each Zel was only 1.55% of
the load impedance. Since at this pulsewidth the applied
voltage did never exceed 7.0 V, the voltage across Zel was
0.1 V at most. Similarly, the maximum voltage across Zel
did not exceed 0.4 V at the end of the widest pulse (0.45
ms, maximum stimulus 3 V, 13.5% of the load impedance
across Zel)
Due to the increase of the load impedance with
increasing pulsewidth the V– t curve gets proportionally
higher than the corresponding I –t curve. Beyond some
pulsewidth the negative voltage gradient changes into a
positive one, whereas the corresponding currents are still
diminishing, as illustrated in Fig. 5 by curves B and A,
respectively. Accordingly, the minimum amplitude
(‘rheobase’) in V– t measurements is attained at a smaller
pulsewidth than in I– t measurements. Because the
chronaxie is defined as the pulsewidth related to twice the
minimum amplitude, the chronaxie estimated from V– t
measurements will be less than from I–t measurements.
We calculated that the chronaxie estimated from V– t
measurements with a DBS electrode is 30– 40% too low.
In this study the stimulator has been considered to be
either a perfect constant-current or constant-voltage
pulse generator. Stimulators are, however, not always so
perfect. Stimuli applied by the DBS pulse generators used
in this study are generated by a capacitor. During its
discharge, a reduction of the stimulation voltage, inversely related to the load impedance, will occur. For a
load of 1300 V the Itrel2 gave a linear reduction of the
output voltage of 3.6% during a 0.2 ms pulse. Accordingly, the mean voltage of the widest pulse applied (0.45
ms) is 4% less than indicated, which corresponds to an
average reduction of 0.05 V of the related near-rheobase
amplitudes (1.390.7 V). This reduction is, however,
within the uncertainty range of the threshold voltages as
introduced by the discrete 0.1 V steps by which the
stimulator output is set.
When the stimulation electrode is implanted in the
brain, the electrical circuit of Fig. 2 should be extended
with the resistance of an extension cable (model 7495,
Medtronic), being : 30 – 40 V, whereas Kseries is included
in the tissue resistance between the electrode contacts,
replacing Rsaline of the in vitro experiment. Accordingly,
the resistance of this tissue, including an encapsulation
sheath and surrounding nervous tissue, will equal the
sum of Rsaline ( :88 V) and Rseries (1000 V) from the in
vitro experiment minus the resistance of the extension
cable, thus having a mean value of :1050 V. This value
is high as compared to the average Zel (: 90 V for each
electrode contact at a 0.5 ms pulsewidth). The variation
of the load impedance among subjects is rather high
(Table 1) and is most likely due to differences in the
morphology of the tissue adjacent to the electrode
contacts, i.e. the thickness and density of the encapsulation layer. According to Grill et al. (1994) a tight layer
of fibroblasts and collagen has a resistivity of 6279108
V·cm, whereas loose encapsulation tissue has a resistivity
of 1959 88 V·cm.
A new method has been introduced to estimate the
chronaxie from V –t measurements in a fairly reliable
way, thus reducing the error substantially. In this method
pulses up to 10– 20 times the expected chronaxie have to
be applied. The only assumption to be made is that the
load impedance increases linearly with the pulsewidth.
We have shown this linear relation experimentally for
DBS electrodes (Fig. 3b). The new method includes the
estimation of the slope of the measured V– t curve at the
largest pulsewidths and the subtraction of a line with this
slope from the V– t curve to obtain the corresponding I– t
curve (with arbitrary current values). Because some error
will still be present in the estimated slope of the V– t
curve, only calculated ‘I– t’ datapoints corresponding to
smaller pulsewidths (having smaller errors) should be
used to estimate the chronaxie. By modeling I– t and V– t
curves we have shown that by this method the error in
the chronaxie estimated from V –t curves is reduced from
30 to 40% to : 6%.
References
Benabid AL, Pollak P, Seigneuret E, et al. Chronic VIM thalamic
stimulation in Parkinsons’s disease, essential tremor and extrapyramidal dyskinesias. Acta Neurochir Suppl 1993;58:39 – 44.
Bard AJ, Faulkner LR. Electrochemical methods, fundamentals and
applications. New York: Wiley, 1980.
Bostock H. The strength– duration relationship for excitation of
myelinated nerve: computed dependence on membrane parameters. J Physiol 1983;341:59 – 74.
Bostock H, Rothwell JC. Latent addition in motor and sensory fibres
of human peripheral nerve. J Physiol 1997;498:277 – 94.
Grill WA, Mortimer JT. Electrical properties of implant encapsulation tissue. Annals Biomed Eng 1994;22:23 – 33.
Mogyoros I, Lin C, Dowla S, Grosskreutz J, Burke D. Strength – duration properties and their voltage-dependence at different sites
along the median nerve. Clin Neurophysiol 1999;110:1618– 24.
Ranck JB. Which elements are excited in electrical stimulation of the
mammalian central nervous system: a review. Brain Res
1975;98:417 – 40.
Weiss G. Sur la possibilité de rendre comparables entre eux les
appareils servant à l’excitation électrique. Arch Ital Biol
1901;35:413 – 46.
West DC, Wolstencroft JH. Strength – duration characteristics of
myelinated and non myelinated bulbospinal axons in the cat
spinal cord. J Physiol 1983;337:37 – 50.
�
 Bart Nuttin