NebGuide
������������������������������������������������������������������������������������������
G1335
Determining Crop Available Nutrients
from Manure
Rick Koelsch, Livestock Environmental Engineer
Charles Shapiro, Soil Scientist, Crop Nutrition
This NebGuide discusses the availability and use
of manure nutrients for field crop production.
When managed correctly, nutrients in livestock manure
can be a valuable resource. When managed improperly,
however, these same nutrients represent a potential environmental pollutant. Accurate crediting of manure nutrients
within a total crop nutrient program is fundamental to utilizing manure as a resource. This NebGuide illustrates how to
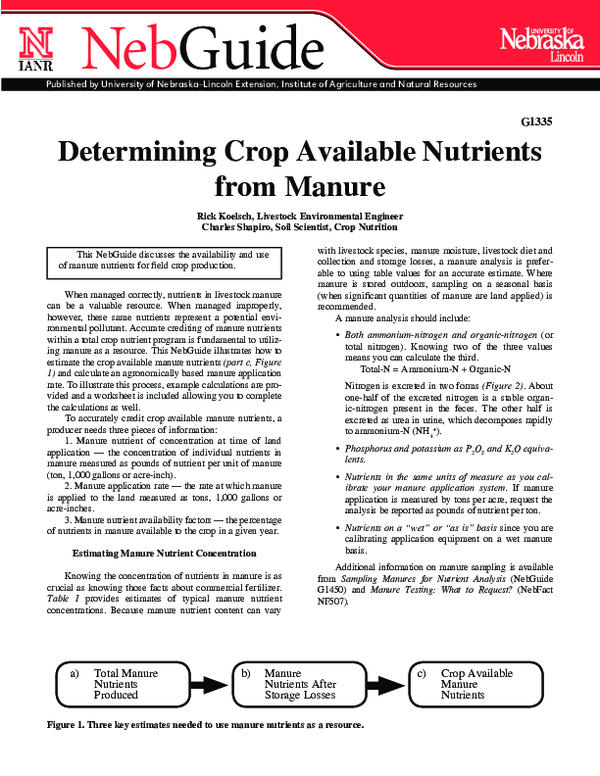
estimate the crop available manure nutrients (part c, Figure
1) and calculate an agronomically based manure application
rate. To illustrate this process, example calculations are provided and a worksheet is included allowing you to complete
the calculations as well.
To accurately credit crop available manure nutrients, a
producer needs three pieces of information:
1. Manure nutrient of concentration at time of land
application — the concentration of individual nutrients in
manure measured as pounds of nutrient per unit of manure
(ton, 1,000 gallons or acre-inch).
2. Manure application rate — the rate at which manure
is applied to the land measured as tons, 1,000 gallons or
acre-inches.
3. Manure nutrient availability factors — the percentage
of nutrients in manure available to the crop in a given year.
with livestock species, manure moisture, livestock diet and
collection and storage losses, a manure analysis is preferable to using table values for an accurate estimate. Where
manure is stored outdoors, sampling on a seasonal basis
(when significant quantities of manure are land applied) is
recommended.
A manure analysis should include:
• Both ammonium-nitrogen and organic-nitrogen (or
total nitrogen). Knowing two of the three values
means you can calculate the third.
Total-N = Ammonium-N + Organic-N
Nitrogen is excreted in two forms (Figure 2). About
one-half of the excreted nitrogen is a stable organic-nitrogen present in the feces. The other half is
excreted as urea in urine, which decomposes rapidly
to ammonium-N (NH4+).
• Phosphorus and potassium as P2O5 and K2O equivalents.
• Nutrients in the same units of measure as you calibrate your manure application system. If manure
application is measured by tons per acre, request the
analysis be reported as pounds of nutrient per ton.
• Nutrients on a “wet” or “as is” basis since you are
calibrating application equipment on a wet manure
basis.
Estimating Manure Nutrient Concentration
Knowing the concentration of nutrients in manure is as
crucial as knowing those facts about commercial fertilizer.
Table I provides estimates of typical manure nutrient
concentrations. Because manure nutrient content can vary
a)
Total Manure
Nutrients
Produced
b)
Additional information on manure sampling is available
from Sampling Manures for Nutrient Analysis (NebGuide
G1450) and Manure Testing: What to Request? (NebFact
NF507).
Manure
Nutrients After
Storage Losses
Figure 1. Three key estimates needed to use manure nutrients as a resource.
c)
Crop Available
Manure
Nutrients
�Table I.
Typical nutrient content of manure. Because of variability between farms, individual manure analysis is preferable to the estimates below.
% Dry
Matter
Ammonium-N
Nitrogen
Organic-N
P2O5
K2O
Slurry Manure
Dairy
Beef
Swine (finisher, wet-dry feeder)
Swine (slurry storage, dry feeder)
Swine (flish building)
Layer
Dairy (lagoon sludge)*
Swine (lagoon sludge)
8
29
9
6
2
11
10
10
———————— (lbs. of nutrient per 1,000 gallons of manure) ————————
12
13
25
40
5
9
9
13
42
17
40
24
28
11
34
24
12
5
13
17
37
20
51
33
4
17
20
16
6
16
48
7
Solid Manure
Beef (dirt lot)
Beef (paved lot)*
Swine (hoop barns)
Dairy (scraped earthen lots)
Broiler (litter from house)
Layer
Turkey (grower house litter)
67
29
57
46
70
40
70
—————————— (lbs. of nutrient per ton of manure)
2
22
23
5
9
9
4
13
20
3
14
11
15
60
27
18
19
55
15
Liquid Effluent from lagoon or holding pond
Beef (runoff holding pond)
Swine (lagoon)
Dairy (lagoon)
0.25
0.40
2
—————————
30
13
16
33
31
30
——————————— (lbs. of nutrient per acre-inch) ———————————
71
8
47
92
91
45
104
189
317
362
674
1082
Value based upon ASAE, 2005, D384.2; Manure Production and Characteristics with exception of those "*".
Estimating Manure Application Rate
If manure nutrients are to be managed as a nutrient
resource, the application equipment must be managed as
a fertilizer applicator. Knowledge of manure application
rate, like knowledge of fertilizer application rate, is key to
managing nutrients applied to crops. Manure application rate
can be estimated by one of the following:
1.
2.
Using one of the calibration methods detailed in
Nebraska CNMP Application Workbook (EC720), pp. 8788, available online at http://cnmp.unl.edu/landapplication
workbook.html.
Maintaining a record of total manure applied to a field
(i.e. total number of loads × average capacity ÷ the
field’s area).
Estimating Crop Available Nutrients
Manure application rate and a manure analysis provides the information needed to estimate total manure
nutrients applied. The “total manure nutrients,” however,
is less important than “crop available nutrients.” The process for estimating crop available nutrients is illustrated in
Figure 2. A worksheet for completing the calculations
(Table II) will assist in making this estimate.
Some manure nutrients become available slowly through
mineralization in the soil. Mineralization is a process by which
soil microorganisms decompose organic nutrients into a mineral inorganic, or plant available form. An estimate of crop
available phosphorus and potassium is reasonably simple.
Seventy percent of the phosphorus and 70 to 90 percent of
the potassium is available to the crop during the year it is
applied.
Determining nitrogen availability, however, is more
complex. The availability of ammonium and organic-nitrogen
for specific livestock species, application methods and other
factors can be found in Figure 2. Ammonium and organicnitrogen originate from the urine and feces respectively.
The ammonium fraction’s availability to the crop (left-hand
box, Figure 2) depends upon both the time between manure
application and incorporation into the soil and the environmental conditions. If manure is surface applied, ammonium
(NH4+) is converted over several days to ammonia (NH3-) and
lost by volatilization. Warmer temperatures accelerate this
loss. If manure is mixed into the soil, the ammonium either
is directly available to the plants or converts to another plant
available form, nitrate-nitrogen (NO3-).
Organic-nitrogen is mineralized to ammonium over
several years at a rate affected by soil temperature, soil
moisture, the characteristics of the manure and other factors.
During the cropping season following application, between
25 and 50 percent of the organic-nitrogen is available (middle
box, Figure 2). Over the next several years, additional
organic-nitrogen is mineralized to crop-available forms in
decreasing amounts (right hand box, Figure 2). For example,
mineralization of stored swine manure will be approximately 35 percent, 15 percent, 7 percent and 4 percent of
the organic-nitrogen during the year manure is applied, one year
later, two years later and three years later, respectively.
Calculating Crop Available Nutrients
At this point, information should have been collected for
1) nutrient concentration of the manure, 2) manure application rate for the current year and the past three years, and
3) availability of organic-nitrogen, ammonium-nitrogen, phosphorus, and potassium. Table II can now be used to complete
a calculation for crop available nutrients. For determining crop
available nitrogen in Table II, follow these steps:
1. Select the units used to measure manure application
rate. Replace all “?” within the calculations with either tons,
1,000 gallons or acre-inches of manure or effluent.
�Incorporation can be accomplished by tillage or by a 0.50 inch or greater rainfall.
Organic-N availability assumes spring seeded crops such as corn and soybeans. For winter or spring manure application prior to planting small
grains, multiply organic-N availability factor by 0.7.
1
2
Figure 2. Availability factors for manure nitrogen.
2. Enter the manure application rate and nutrient concentration
and calculate total nitrogen application.
3. Enter the total nitrogen application and manure nutrient fraction available, and calculate the available nitrogen for ammonium, organic-N and organic-N from past
applications separately.
4. Sum the estimated available nitrogen from ammonium,
organic-N, and organic-N from past applications.
An example is presented in Table II for cattle feedlot
manure applied at a rate of 28 t/ac this year and two years ago.
Manure is disked into the soil within 24 hours. The producer’s
manure analysis indicates nutrient concentrations of 5 lb.
of NH4+/ton, 13 lb. of organic-N/ton, 12 lb. of P2O5/ton and
21 lb. of K2O/ton.
A much simpler estimate of crop available phosphorus
and potassium can also be completed in Step 5. The results
of these calculations can be summarized in Step 6.
Soil Testing and Crop Monitoring
The previous procedures have provided a “calculated”
estimate of nutrient availability from manure. Soil testing
provides a “field measurement” of residual nutrients. For a
producer who regularly soil tests, is this calculated estimate
necessary?
A deep soil test measures soil nitrate-N at the time of
sampling. The above calculations estimate organic and ammonium nitrogen accessible to the crop through the growing
season. Although most manure nitrogen will eventually be
converted to nitrate nitrogen, this has not happened at the time
soil samples are typically taken (fall, winter, or early spring).
A soil test for nitrate nitrogen will not account for the future
nitrogen available from manure. Thus, the “field measured”
and “calculated” values are independent sources of nitrogen
and should be added together.
The amount of manure nitrogen credit is an estimate
based on average conditions. An alternative strategy is the
presidedress nitrate test (PSNT) which may be a more accu-
rate predictor of when manure release is sufficient to produce
maximum yields in corn. The PSNT test is a one-foot soil
sample taken in early June or at the 6 to 8 leaf stage. The soil
is analyzed for nitrates. By this time of the growing season,
manure nitrogen is mineralizing to nitrate. In Iowa and other
states a soil nitrate level of over 25 ppm is usually sufficient
for maximum corn production.
Corn can be monitored to determine if a nitrogen deficiency
is developing by use of a chlorophyll meter. Under irrigated
conditions additional nitrogen can be applied when needed
with the irrigation system. In the near future remote sensing
may allow monitoring of nitrogen status without the need to
sample individual plants.
Phosphorus and potassium application needs can be determined by soil testing. Regular soil testing of fields receiving
manure will document phosphorus and potassium status.
Using any one of these techniques or a combination
will allow more accurate crediting of manure nutrients with
confidence. The “calculated” estimate of manure nitrogen
will remain an important pre-growing season planning tool
for manure nutrient sources.
Once the available nutrients are determined, the next
step is to fit this information into a nutrient management plan.
NebGuide G174, Fertilizer Suggestions for Corn, details how
to determine the total nutrients needs based on soil tests and
yield expectation. The Nebraska CNMP Application Workbook
(EC720) provides reference tables for nutrient recommendations for many common crops.
Additional Resources
All University of Nebraska–Lincoln resources for
nutrient management planning can be found online at
http://cnmp.unl.edu. The Web site contains software tools,
sample records, regulatory information, and other tools
associated with nutrient management planning. Of particular
value are two software tools, UNL’s Manure Use Planner
and Purdue’s Manure Management Plan. These tools can be
downloaded at no cost from the CNMP Web site.
�NOTE: Use your Adobe Reader® to fill in the blanks in the following form and print out the results. Use the Tab key on the computer keyboard to
move
through
the form.ofThe
form will automatically
calculateG1335
equation
solutions. The
file cannot
be saved
to yourfrom
computer,
but can
be 4.
From
University
Nebraska–Lincoln
Extension,
Determining
Crop
Available
Nutrients
Manure,
page
completed and printed to create a record.
Table II. Planner for estimating crop available nutrients. An example is presented for cattle feedlot manure. Enter your own numbers in the boxes provided.
✔ ton (solid or semi solid manure)?
_____
_____ 1,000 gallons (slurry or liquid)?
_____ acre-in (lagoon or holding pond effluent)?
(Replace “?” with appropriate unit of measure.)
Step 1.
Is manure measured in:
Step 2.
Calculate total manure nitrogen applied.
Total Ammonium-N
NH4 From
X
Analysis =
(lb./?)
Manure
Rate
(?/acre)
(lb/acre)
28 t/ac
________
X
5 lb/t =
_________
Total
(lb/acre)
140
_________
Check one.
Total Organic-N from Present Application
Manure
Organic-N
Rate
X From Analysis =
Total
(?/acre)
(lb./?)
(lb/acre)
28 t/ac
_________
X
13 lb/t
_________
364
= _________
0
From Manure Analysis: 5 lb. NH4
ton
Step 3.
Total Organic-N from Past Applications
Manure
Organic-N
Rate
X From Analysis
= Total
(?/acre)
(lb./?)
0
1 year ago: ______
0
______ = ______
X
0
0
From Manure Analysis:
13 lb. organic N/ton (this year)
11 lb. organic N/ton (2 years ago)
t/ac X
2 years ago: 28
______
11
lb/t
______
308
= ______
0
3 years ago: ______
0
______ = ______
0
X
0
Calculate crop available nitrogen applied.
Part 2. Crop Available
Ammonium-N
Total
(lb/acre)
140
________
X
X
Fraction
Availablea
0.5
________
=
=
Part 2. Crop Available Organic-N
From Past Applications
Part 2. Crop Available Organic-N
From Present Application
Available
(lb/acre)
70
________
0
0
Total
(lb/acre)
X
Fraction
Availableb
=
Available
(lb/acre)
364
________
X
0.25
________
=
91
________
b
0
1 year ago: _______
X
308
2 years ago: _______
Middle box of Figure 2
X
0
0
0.07
22
_______
=
0
0
= _______
0.04
0
Beef feedlot manure
0.15
0.07
0
3 years ago: _______
X
Incorporated within 24 hours
of application
0
= _______
0.15
0
0
0
Left box of Figure 2
a
Total X Fraction = Available
(lb/acre)
Availablec
(lb/acre)
0.04
0
Right box of Figure 2
c
Step 4.
Sum crop available nitrogen applied
Crop Available Manure Nitrogen Applied
Part 3.
Ammonium
+
Organic-N
+
Residual Organic-N
=
Crop Available Nitrogen
________
70
+
________
91
+
________
22
=
________
183 lbs. N/acre
Step 5.
0
0
0
0
Calculate available phosphate and potash at known manure application rate.
P2O5 concentration in manure: __________
12 lb/t
lb P2O5/?
X
?/acre
________
X
________
12
lb/t
28
t/ac
K20 concentration in manure: __________
21 lb/t
% available
=
0.7
=
lb/?
X
X
lb/?
lb P2O5/acre
________
235
0
0.7
lb K20/?
X
X
________
21
lb/t
Step 6.
lbs. N/acre
?/acre
________
28
t/ac
X
X
% available
0.8
0.8
Summarize crop available manure nutrients for selected application rate: __________
28 t/ac
Available Manure Nitrogen
Available Manure P2O5
________
183 lb/acre
0
lb/acre
________
235 lb/acre
0
lb/acre
Extension is a Division of the Institute of Agriculture and Natural Resources at the University
of Nebraska–Lincoln cooperating with the Counties and the United States Department of Agriculture.
University of Nebraska–Lincoln Extension educational programs abide with the nondiscrimination
policies of the University of Nebraska–Lincoln and the United States Department of Agriculture.
© 1997-2006, The Board of Regents of the University of Nebraska on behalf of the University of Nebraska–Lincoln
Extension. All rights reserved.
=
=
lb K20/acre
________
470
0
?/ac.
Available Manure K20
________
470 lb/acre
0
lb/acre
Index: Waste Management
Livestock Waste Systems
Revised March 2006
�
 Charles Shapiro