Journal of Global Information Management
Volume 29 • Issue 6 • November-December 2021
Service Quality Measurement
in Information Systems:
An Expectation and Desire
Disconfirmation Approach
Ankit Kesharwani, Indian Institute of Foreign Trade, New Delhi, India
https://orcid.org/0000-0001-6884-6828
Venkatesh Mani, Montpellier Business School, University of Montpellier, Montpellier Research in Management, France
https://orcid.org/0000-0001-5291-6115
Jighyasu Gaur, T A Pai Management Institute, Manipal, India
Samuel Fosso Wamba, TBS Business School, Toulouse, France
https://orcid.org/0000-0002-1073-058X
Sachin S. Kamble, EDHEC Business School, Roubaix, France
https://orcid.org/0000-0003-4922-8172
ABSTRACT
Traditionally, measurements of service quality have followed the expectation-disconfirmation
approach. Further, previous studies have shown that negative disconfirmation is more influential than
positive disconfirmation. This research hypothesized information systems (IS) service quality scales
based on the dimensionality of the expectation-disconfirmation (ED) and desire-disconfirmation
(DD) approach. Using the SERVQUAL+ instrument and data collected from 321 IS users, the
authors developed ED and DD-based IS service quality scales using contemporary methods, such
as LISREL-based CFA. This paper proposed and empirically validated the following two new IS
service quality constructs: service adequacy (difference of expected service and perceived service) and
service superiority (difference of desired service and perceived service). The results indicate that both
measures have shown better predictive power than earlier scales like SERVQUAL+ and the IS ZOT
scales. The authors have outlined several implications of ED and DD scales to practice and research.
KEywoRDS
Desire-Disconfirmation, Expectation-Disconfirmation, Information Systems, Service Quality, SERVQUAL+,
Zone of Tolerance
1. INTRoDUCTIoN
The timely assessment of information system (IS) service quality can help the firms meet end-user
requirements and instill satisfaction. Therefore, all IS firms have adopted the approaches to measure
DOI: 10.4018/JGIM.20211101.oa30
This article published as an Open Access article distributed under the terms of the Creative Commons Attribution License
(http://creativecommons.org/licenses/by/4.0/) which permits unrestricted use, distribution, and production in any medium,
provided the author of the original work and original publication source are properly credited.
1
Journal of Global Information Management
Volume 29 • Issue 6 • November-December 2021
the IS users’ perception of service quality dimensions as an integral part of their IS success evaluation.
Many researchers have opined on the use of expectation disconfirmation theory (EDT) as an effective
way to gauge users’ satisfaction with IS usage (Hossain, 2019). The EDT theory holds that consumer
satisfaction is related to the magnitude and direction (positive or negative) of the discrepancies (or
disconfirmation) between prior expectations and perceived performance (Churchill and Surprenant,
1982; Gorla and Somers, 2014). Three forms of disconfirmation may occur: a) expectations are
confirmed when perceived performance meets expectation, b) expectations are negatively disconfirmed
when perceived performance falls short of expectations, and c) expectations are positively disconfirmed
when perceived performance is better than expected performance (Rouf et al., 2019; Zamani and
Pouloudi, 2020).
Studies have highlighted that expectations-based disconfirmation alone may not provide a
complete picture as desires-based disconfirmation can also impact consumers’ satisfaction (Gorla
and Somers, 2014; Hossain, 2019). As pointed out in previous studies, the gap measures of service
quality possess superior diagnostic capabilities as they are grounded in EDT, linked to user satisfaction
(Hogreve et al., 2017). For example, considering the perceived services of individual users, tangibles
could have the lowest performance ratings. If the perception-minus-expectation measures are
considered, reliability could have the largest negative disconfirmation across individual users (Chen
et al., 2018). Using perception-only scores, the company may pay more attention to tangibles than
reliability with the largest shortfalls of service, thereby incorrectly diagnosing service deficiencies
(Parasuraman et al. 1994). Thus, instruments that capture disconfirmation of expectations need to be
different from those designed based on perception-only measures (Kettinger and Lee, 2005).
Therefore, there are several advantages of disconfirmation-based measures over alone perceptionbased measures: First, the use of performance-only based scales results in misguided diagnostics of
service deficiencies, leading to wrong resource allocation decisions by managers. Second, the dual
expectation measures of service are more realistic than single expectation measures and are being
used in industry because of their importance in satisfaction research. Previous instruments in IS
service quality did not capture individual users’ service disconfirmations concerning expectations
and desires (Chen et al., 2018). Third, previous research in IS service quality paid little attention to
the unidimensionality property, which is the critical and basic assumption in measurement theory
(Kettinger and Lee, 2005). Our study aims to address the above research gaps in IS service quality by
developing IS service quality scales based on expectation-disconfirmation and desire-disconfirmation
approaches.
The instruments developed using direct measures (for example, perceived service as used in
Kettinger and Lee, 2005) do not reflect individual stakeholders’ service gaps. Service expectations
may vary among employees, across service providers, within the same employee across a period
(Parasuraman et al., 1985). Each dimension depends upon the context and circumstances (Zeithaml et
al., 1993). The rationales of these differences can be grounded on the varied level of service expectation
and service desire levels they hold for respective service quality dimensions. Hence, the service
quality dimensions’ significant loadings in such instruments reflect relevance for perceived service
rather than their relevance for service discrepancies. Results would be different if both components
of difference score are collected and used when compared to using only one of the difference score
components (Negash et al., 2003; Klein et al., 2009); thus, these two methods represent different
theories. Therefore, the scales derived based on perceived service, expected service, or the desired
service will differ from those based on service expectation-disconfirmation (ED) and service desiredisconfirmation (DD) measures. Service quality instruments developed based on these individual
service deficiencies represent the critical service dimensions and items of importance from the
IS manager’s perspective compared to instruments based on the three service levels’ direct and
independent measurements. The greater importance and utility of difference scores is evidenced by
their recent application in various industries, including railways, airlines, health, banking, hotels, and
mobile service (Silvestro, 2005; Arasli et al., 2005; Cavana et al., 2007; Pakdil and Aydin, 2007;
2
Journal of Global Information Management
Volume 29 • Issue 6 • November-December 2021
Lemy et al., 2018; Rouf et al., 2019) and. However, there were limited studies in the literature that
apply expectations and desires-based disconfirmations in IS service quality.
Based on the above discussion, we seek answers to the following research questions:
1.
2.
Is there a difference exist between expectations and desires-based disconfirmations in IS service
quality?
If yes, which dimension(s) are critical for ED and DD, respectively?
We study two key research objectives to address the above concerns of expectation (vs.
desire) based disconfirmation approach. 1)To extend the previous researchers’ line of investigation
by developing scales for IS service quality based on expectation-disconfirmation and desiredisconfirmation theories, and; 2)To validate the proposed scale and compare it with the service
quality scales developed in previous research.
Our contributions are two folds: First, our research offers new theoretical insights to ongoing
theory-building efforts on information system’s service quality domain. Second, these scales will
enable the IS managers to assess critical service deficiencies with respect to expectations and desires,
thereby resulting in useful IS service management.
The remainder of the paper is organized as follows: In section 2, a literature review is presented.
Next, in section 3, the research design is explained. Results of the study are presented in section 4.
In section 5, a discussion on the results is provided. Theoretical and managerial implications are
discussed in section 6. Finally, the conclusion and future research opportunities are discussed in
section 7 and 8 respectively.
2. LITERATURE REVIEw
2.1 Service Quality Measurement: An overview
Service quality was originally conceptualized as the extent to which perceived service meets or exceeds
customer expectations. A customer’s evaluation of services is a function of the distance between
perceived performance and expectation (Parasuraman et al. 1985). Several studies have found the
following discrepancies in the SERVQUAL instrument: (1) The original difference-based SERVQUAL
measure was found to have a lower predictive validity than the perception-only measure (Cronin and
Taylor, 1992; Babakus and Boller, 1992; Boulding et al. 1993). However, its superiority with respect
to the predictive power of performance-only measure was agreed upon by several researchers (for
example, Cronin and Taylor, 1992; Boulding et al. 1993; Van Dyke et al. 1999); and (2) Another
problem with the SERVQUAL instrument is the ambiguity of the expectations construct since the
expectations have been defined in various ways (such as wants, desires, normative expectations, and
ideal standards).
Because of the single expectation measure’s ambiguity, Zeithaml et al. (1993) have divided the
single expectation into two levels of expectations: the desired service level and an adequate service
level. The desired service level corresponds to a higher level of service, i.e., the service level a
customer wants to receive. The adequate service level corresponds to the minimum level of service
that meets the customer’s basic needs. Adequate service is like minimum tolerable expectation or to
the bottom level of performance acceptable to a consumer. The dual expectations model has been
applied in several non-IS contexts, including financial services (Durvasula et al. 2006), university
libraries (Cook et al. 2003), the hotel industry (Nadiri and Hussain, 2005), educational institutions
(Joseph et al. 2005), rail services (Cavana et al., 2007), and online opinions (Qazi et al. 2017).
However, its application to the IS context is somewhat limited (Kettinger and Lee, 2005; Tsai and
Lu, 2006; Gorla and Somers, 2014).
3
Journal of Global Information Management
Volume 29 • Issue 6 • November-December 2021
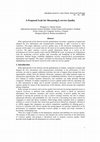
Figure 1. The dual expectation of service quality (adapted from Parasuraman et al., 1994)
A zone of tolerance is the range between the desired service level and the adequate service level
within which a company’s services will meet customer demands (Parasuraman et al., 2005; Hogreve
et al., 2017). Conceptualizing the dual expectation concept of Zeithaml et al. (1993), SERVQUAL+
instrument with twenty-one items in five constructs was developed (Parasuraman et al. 1994). Besides,
two different measures were defined: a measure of service superiority (the discrepancy between
perceived service and desired service) and a measure of service adequacy (the discrepancy between
perceived service and adequate service). Both measures can be positive (implying that performance
exceeds expectations) or negative (implying that performance is lower than expected). These difference
scores are diagrammatically represented in Figure 1.
2.2. Service Quality Measurement: An Expectation
and Desire Disconfirmation Approach
As guided by EDT, service disconfirmation is a crucial variable in IS satisfaction research. It is the
magnitude and direction of disconfirmation that results in satisfaction and dissatisfaction. Positive
disconfirmation results in satisfaction, while negative disconfirmation results in dissatisfaction
(Venkatesh and Goel, 2010; Chen et al., 2018; Zamani and Pouloudi, 2020). The relationship
between disconfirmation and satisfaction is non-symmetric. That is, negative disconfirmation on
dissatisfaction is higher than positive disconfirmation on satisfaction (Venkatesh and Goel, 2010;
Gorla and Somers, 2014; Nishant et al., 2019). However, disconfirmation explained more variance of
satisfaction compared to perceived service (Parasuraman et al. 1994; Premkumar and Bhattacherjee
2008; Hossain, 2019).
Under the desires-disconfirmation theory (DDT), like EDT, the desired discrepancy between
performance and desired service can be positive or negative. A positive (negative) disconfirmation
arises when service performance meets/exceeds (lower than) desired service, which leads to satisfaction
(dissatisfaction). By not considering desires-based disconfirmations, one may arrive at illogical
conclusions, such as a consumer with lower-level expectations is satisfied with low-performance
levels. A consumer will be dissatisfied because of negative disconfirmation when the perceived service
level is lower than the desired (wanted) service level, even though there is positive disconfirmation
for the expected service level (Schaffer and Fang, 2020). Thus, expectations and desires are two
separate concepts and have different effects on satisfaction (Chin and Lee 2000). While expectations
may be formed by users’ experience and understanding of the actual situation (or feasibility), desires
are based on inner emotional needs or want (Khalifa and Liu 2003, Weitzl and Hutzinger, 2019).
4
Journal of Global Information Management
Volume 29 • Issue 6 • November-December 2021
Desires can be at a higher or lower level than expectations. There has been empirical evidence for the
validity of desires-based disconfirmation models for their influence on satisfaction in both marketing
(Parasuraman et al. 1994; Spreng et al. 1996; Schaffer and Fang, 2020) and IT (Suh et al. 1994; Chin
and Lee, 2000; Khalifa and Liu, 2003, Weitzl and Hutzinger, 2019). Spreng et al. (1996) have shown
that desires and expectations are empirically distinct attributes and that expectations can cause both
negative and positive disconfirmations, whereas desires can only negatively affect satisfaction. There
is a more significant downside risk to under-delivering on expectations than the upside reward for
over-delivering (Nevo and Wade 2007). Hence, the positive and negative disconfirmations should
be individually captured for building difference-based scales. In an empirical study of customers
who purchased a life insurance policy from an insurance company, Durvasula et al. (2006) found
that different service dimensions of service adequacy and service superiority had high correlations
with satisfaction. These studies show that different dimensions of service quality could be important
for ED and DD. Therefore, different scales would be needed for ED and DD based measures. From
the discussions above, desires and expectations are different empirically as they are influenced in
different ways because of different determinants (Spreng et al. 1996). Therefore, the scales based
on expectation-disconfirmation (service adequacy) and desire-disconfirmation (service superiority)
will differ.
2.3. Service Quality Measurement: Dimensions of ED and DD Scales
Different scales are needed to measure ED and DD because expectations and desires are different
concepts and have different determinants. Customer expectations or desires are formed based on
customers’ experience with other companies at the time of service delivery (Zeithaml et al. 1993),
and advertisements and salesperson communication (Spreng et al. 1996). It should be noted that the
desired service is relatively stable compared to adequate service or expectation. Service promises
made through advertising will result in enhanced reliability expectation, as IS users expect the IT
service provider to keep their promises by providing services at the promised time. In user departments
where timely services are critical, such as in Payroll or Accounting, there will be elevated service
needs (desired service and adequate service), especially in the dimension of reliability. It is because
the IS users in such departments will be pressured to report payroll and accounting information in
a timely fashion because of the strict deadlines. Thus, reliability is an essential dimension of both
adequate service and desired service.
A customer’s desired service levels - the underlying construct for DD - are influenced by
high expectations of their supervisors, customers in the service industry, and their personal needs
(Parasuraman et al. 2005). IS users in the service industries (i.e., consulting business, hotel industry,
IT services) will have higher desired service expectations from the IS service providers because such
IS users are in the service business. In an empirical study involving customers of a life insurance
industry, Durvasula et al. (2006) found that the assurance dimension is the most critical item in the
service superiority scale.
The adequate service levels (an underlying construct for ED) are influenced by customers’
emergencies, availability of service alternatives, and level of customer interactions (Zeithaml et al.
1993). Responsiveness will be a vital service dimension for the IS users who are faced with emergency
technical system problems, such as hardware and software failures, especially in the timebound IS
applications. In such emergencies, IS users expect a minimum level of responsiveness from the
service providers.
Customer involvement is an important dimension of adequate service expectation (Bowen, 1989).
User participation in system development is regarded as an essential factor for developing a successful
information system. User involvement during system development raises the user expectations of the
services to be delivered by the provider, as the users believe that they are doing their part in the service
delivery by participation. The user and service provider coordination during system development
is enhanced by the provider’s understanding of the users’ needs, giving high importance to users’
5
Journal of Global Information Management
Volume 29 • Issue 6 • November-December 2021
information requirements and individual attention. Thus, empathy is an important dimension to
shape IS users’ adequate service or expectation during system development. The above argument is
supported by an empirical study of the life insurance industry in which empathy was determined to
be the most important service dimension in service adequacy measurement (Durvasula et al. 2006).
Situational factors, such as malware attacks on vendor systems and high vendor IT staff turnover,
can result in unreliable services as the provider cannot deliver previously promised services. As the
IS users understand the emergency and consider that it is not the IT service provider’s fault, they
lower their adequate service expectations, especially in terms of reliability service dimension, which
is an essential dimension of service adequacy. In the case of alternate delivery sources of IS services
(for example, multiple outsourcing vendors or a strong internal IT department), the adequate service
expectations will be high. This is because the users will estimate the minimum service level possible
in terms of reliability and responsiveness. Therefore, the adequate service level will be higher because
of the high expectations of reliability and responsiveness (Nishant et al., 2019). In the IS functions,
such as IT helpdesk or IS operations, where multiple service providers exist, high reliable service
expectations with high responsiveness will prevail (Hossain, 2019).
2.4. Evolution of Service Quality Measurement Scales and Research Gap
The original scale to measure perception-based evaluation of service quality dimensions was given
by Parasuraman et al. (1985) through the SERVQUAL scale. To overcome the discrepancies and
measurement validity issues of the SERVQUAL scales (refer to Section 2.1 above), Kettinger and
Lee (1997) have proposed an alternative IS-Adapted SERVQUAL scales. Compared to the original
SERVQUAL, the authors of the IS-Adapted SERVQUAL found support for four dimensions of
service qualities, namely reliability, responsiveness, assurance, and empathy. Based on EDT theory,
Kettinger and Lee (2005) were the first to develop scales for IS service quality by adapting the
zone of tolerance concept from marketing into IS research. The authors demonstrate the validity of
perceived service and dual service expectations individually in the IS context. Service quality scales,
proposed by Kettinger and Lee (2005), are useful for understanding the dynamics of perceptions
and expectations and tracking the average service levels or expectation levels of a department over
a period (Hossain, 2019).
Since our study aims to propose a measure based on the desire-disconfirmation approach, we
follow a different approach from Kettinger and Lee (2005) ‘s service items of significance. We started
from the original SERVQUAL instrument (Parasuraman et al. 1994), which is theoretically driven
and tested in several contexts. In doing so, we follow Kettinger and Lee (1997, 2005) that “wellestablished, managerially useful measures should not be discarded until their underlying theory and
practicality have been conceptually and empirically discredited” (p 898). Based on SERVQUAL+,
we developed the disconfirmation measures of service adequacy, service superiority, and refined
scales relevant to IS context using various statistical analyses.
Table 1 highlights the progression towards service quality measurement – starting from perceptionbased measurement (SERVQUAL) to the proposed desire-based disconfirmation scale.
3. RESEARCH DESIGN
3.1. Instrument Development
Following the methodologies for instrument development and validation (Segars and Grover, 1993;
Segars, 1997; Gefen, 2003), a four-step approach was used to derive and validate IS service quality
scales for IS service adequacy and IS service superiority. First, confirmatory factor analysis (CFA)
was employed to refine the enhanced SERVQUAL+ instrument for achieving unidimensionality of
these scales. Next, the model fitness was estimated, and unidimensionality was assessed using the
holdout sample after the scales’ refinement. Then, various reliability and validity assessments were
6
Journal of Global Information Management
Volume 29 • Issue 6 • November-December 2021
Table 1. Evolution of Service Quality Measurement Scales in IS Context and (Contribution of our study)
Scale (Study)
Major Findings
SERVQUAL
(Parasuraman et al.
1985)
Pioneered the perception-based measurement of key service quality dimensions, namely
tangibility, reliability, responsiveness, assurance, and empathy.
IS-Adapted
SERVQUAL
(Kettinger and Lee
1997)
Identified four dimensions of service qualities specific to the IS domain – reliability,
responsiveness, assurance, and empathy
SERVQUAL+
(Kettinger and Lee
2005)
Based on EDT theory, a disconfirmation-based scale was developed to measure IS service
quality by adapting the zone of tolerance concept from marketing into IS research
Service Superiority
or DesireDisconfirmation Scale
(Present study)
Extend the SERVEQUAL+ scale by proposing two constructs:
Service Adequacy (difference of expected service and perceived service), and Service
Superiority (difference of desired service and perceived service).
performed on these instruments (Segars, 1997). After that, scales’ psychometric properties were
compared with those of SERVQUAL+ (Parasumraman et al. 1994) and IS ZOT (Kettinger and
Lee, 2005). Additionally, following Carr’s (2002) recommendations, the psychometric properties of
component scores of the gap scales were examined for acceptable measures.
The enhanced SERVQUAL+ instrument (Parasuraman et al., 1994), with dual service
expectations and a 3-column format, was adapted and modified by slightly changing the wording to
suit the IS context. The instrument was pre-tested with a group of academics, industry professionals,
and IS department personnel, and accordingly, modifications were made. The data used in this study
were collected via a nationwide mail survey drawn from the Directory of Top Computer Executives.
A total of 1500 questionnaires were distributed to various organizations and various departments
through their CIOs. The respondents represent different industries and functional areas in the USA.
Previous studies used similar data collected from multiple organizations for analyzing IS service
quality instruments (Jiang et al., 2000). Respondents were asked to assess the service quality of their
function or department. Overall, 337 filled responses were received, representing a 22.5% response
rate. The sample data were tested for non-response bias, using the total number of employees within
the organization. The chi-square test comparing the two groups did not show any significant bias,
implying no concern for non-responsive bias. The weighted average of the number of employees
in the company was 500 to 1000, and the respondents’ departments typically contained 10 to 25
employees (mode). Out of the 337 respondents, incomplete observations (i.e., those where none of
the service quality items were completed) were deleted, resulting in a net of 321 usable observations.
As presented in Table 2, the respondents were from middle and upper management positions. They
are knowledgeable to answer the survey, thereby confirming that there was no key informant issue.
For data analysis, the sample was divided into two parts: first, 160 observations were drawn
randomly to form the first sample. Second, the remaining 161 observations were reserved as a
holdout sample for retesting and or refinement. We performed CFA to assess the unidimensionality
of the scales. While unidimensionality is assumed in traditional approaches, CFA provides a more
accurate assessment of unidimensionality by explicitly examining different variances (Segars, 1997).
If an unaccounted amount of shared variance between two measurement items is significant, there
is a threat to unidimensionality (Gefen, 2003). In order to verify unidimensionality, shared residual
variances are examined. The aggregate measures of threats to unidimensionality are reflected in
higher values of standardized RMR and Chi-square. A significant Chi-square test statistic (p-value
< 0.001) may signify a threat to unidimensionality. The above specification search should be cross7
Journal of Global Information Management
Volume 29 • Issue 6 • November-December 2021
Table 2. Brief Profile of the Respondents
Frequency
Percent
The department the respondent works in
Manufacturing
85
26.5%
Marketing
30
9.3%
Finance
62
19.3%
Human Resource
36
11.2%
Headquarters
38
11.8%
Accounting
48
15.0%
Others
22
6.9%
Total
321
100.0%
The number of employees in the department
Less than 10
60
18.7%
10 – 25
89
27.7%
25 – 50
85
26.5%
50 – 100
55
17.1%
More than 100
32
10.0%
Total
321
100.0%
1 – 2 years
64
19.9%
3 – 5 years
85
26.5%
6 – 10 years
74
23.1%
11 – 15 years
48
15.0%
More than 15 years
50
15.6%
Total
321
100.0%
Below 20 years
7
2.2%
20 – 25 years
34
10.6%
26 – 35 years
110
34.3%
36 – 45 years
134
41.7%
Above 45 years
36
11.2%
Total
321
100.0%
Years with the Organization
Age of the respondent
validated through a holdout sample to validate the measuring instrument (Segars and Grover, 1993).
To obtain the unidimensionality of scales, the items in the construct were deleted one at a time (Segars
and Grover, 1993) until at least two of the three conditions, 1) modification indices < 5, 2) standard
residuals < 3.5, and 3) non-significant chi-squared values, were met (Segars, 1997). This was done
as a trade-off since satisfying all three conditions resulted in a significant reduction of items, which
would have led to a threat of low content validity (Carr, 2002). This is also consistent with Gefen’s
(2003) suggestion that, while dropping the measurement items, care should be taken to over-fit the
model. Once the conditions for unidimensionality and goodness of fit indices were satisfied, the
8
Journal of Global Information Management
Volume 29 • Issue 6 • November-December 2021
Table 3. Model Fit Indices of Measurement Models
Measurement Model
IS Service Adequacy
Multi-factor
Single Factor
IS Service Superiority
Multi-factor
Single Factor
Chi-square (χ2)
74.414
279.124
101.932
351.823
Degree of Freedom (df)
38
44
29
35
χ2 / df
1.958
6.344
3.515
10.052
Δχ2
---
204.710
---
249.891
Δdf
---
6
---
6
Δχ2 / Δdf
---
34.118
---
41.649
instrument was retested and refined with the holdout sample. Refinement was necessary for the service
adequacy scale only, wherein the item “fulfillment of promises by IS units” had to be discarded. The
refined instruments are shown in Table 4.
3.2. Common Method Bias and Non-Responsive Bias
Before we subject all datasets to analysis, it is always recommended to assess common method
bias (CMB). CMB’s potential cause is measuring instruments using the same method/type of scale
used (Podsakoff et al., 2012). To assess this bias, the study followed Harman’s single factor, latent
variable, and marker variable approach (Craighead et al., 2011). These were the most widely used
test to deal with CMB. Under this test, all variables are subject to exploratory factor analysis (EFA).
CMB is assumed to exist if one factor accounts for the most variance in the variables or if one factor
surfaces from unrotated factor solutions. For each information system service level (i.e., adequacy
and superiority), all measures were subjected to an exploratory principal component factor analysis
(EFA) with oblique rotation. This yielded a four-factor solution based on Eigenvalues and scree plot
test criteria, collectively accounting for 67.5 percent of the variance. For adequacy scales, the first
factor explained just 29.6 percent of the variance, considerably less than the 50 percent benchmark
used in Harman’s single-factor test. Similarly, for superiority scales, the variance accounted for by
the first factor was 32.2 percent. Thus, in both cases, the variance explained by the single-factor was
less than the 50 percent cut-off criterion suggested by Herman (1976). Recently researchers have
started executing Harman’s single factor test with CFA and finding it more robust than earlier tests
(Craighead et al. 2011). The CFA application is more robust as CFA provides model fit statistics for
both models. However, the discrepancy between the one-factor model and the multi-factor model is
assessed through a chi-square difference test. If the model-fit statistics of the two models; and their
differences show that the multi-factor model is better than the single-factor model across all waves,
we can assume the absence of CMB in the datasets being used. Thus, a four-factor measurement
model was tested (χ2 = 74.414, df = 38, χ2 / df = 1.958), followed by a single factor measurement
model (χ2 = 279.124, df = 44, χ2 / df = 6.344). Results of the χ2 difference test between these two
models (Δχ2 = 204.930, Δdf = 6 i.e., Δχ2 / Δdf = 34.155) indicate that common method bias may
not be a serious problem in our dataset (Please refer Table 3).
4. RESULTS
As can be seen from Table 4 below, the instrument for IS service adequacy (ED) has eleven question
items representing the four constructs: tangibles, reliability, responsiveness, and empathy. The IS
service superiority (DD) has ten-question items in four constructs: tangibles, reliability, assurance, and
9
Journal of Global Information Management
Volume 29 • Issue 6 • November-December 2021
Table 4. IS Service Quality Scales
SERVQUAL+ Items
IS Service
Adequacy
(ED Scale)
IS Service
Superiority
(DD Scale)
Tangibles
1. Up-to-date hardware and software (TAN1)
----
----
2. Appeal of physical facilities (TAN2)
0.816
0.816
3. Neat appearance of IS employees (TAN3)
0.724
----
4. Physical facilities should be provided (TAN4)
0.868
0.905
5. Operating hours convenient to others (TAN5)
----
----
6. Fulfillment of promise by IS unit (REL1)
----
----
7. Interest shown by IS unit to solve user problems (REL2)
0.853
0.886
8. Dependability of IS unit (REL3)
0.891
0.886
9. Providing services at promised time (REL4)
0.837
0.849
10. Service delivery time commitment (REL5)
----
----
11. providing prompt service to users (RESP1)
0.911
----
12. Willingness to help users (RESP2)
0.864
----
13. Availability of IS staff to respond to user requests (RESP3)
----
----
14. IS staff install confidence is users (ASS1)
----
----
15. Users’ feeling safe in transactions with IS units (ASS2)
----
0.789
16. Courteous interactions with IS users (ASS3)
----
0.853
17. Knowledgeable IS employees (ASS4)
----
0.862
18. Paying individual attention to users (EMP1)
0.904
----
19. Give personal attention to users (EMP2)
0.925
0.760
20. IS units have users’ best interest (EMP3)
0.792
----
21. IS staff understand users’ needs (EMP4)
----
0.902
Reliability
Responsiveness
Assurance
Empathy
empathy. Table 4 also shows the factor loading of service quality items on the respective constructs
of the service adequacy and service superiority scales.
The instruments for IS service adequacy and IS service superiority meet all the goodness of
fit criteria on both the first sample and holdout sample (Tables 5 and 6). The unidimensionality
assessment shows that the ED scale exhibits the unidimensionality properties by meeting at least
two of the three criteria outlined above. The scale for DD moderately satisfies unidimensionality
conditions (the largest modification index of 9.22 exceeds the cut-off of 5).
The original constructs of the SERVQUAL+ instrument do not meet any of the criteria for the
unidimensionality of constructs (for example, see Table 5). The chi-square value is significant at
p<0.000 level, the standardized residual of 7.1 far exceeds the maximum, and the largest modification
index of 76.0 far exceeds the cut-off. The IS-ZOT also does not meet the unidimensionality of
10
Journal of Global Information Management
Volume 29 • Issue 6 • November-December 2021
Table 5. Unidimensionality and Goodness of Fitness for IS Service Adequacy (ED scale)
Unidimensionality
Cut-off
Chi-square (df)
1st sample
Holdout*
#SERVQUAL+
#IS ZOT
98.5 (48)
41.4 (38)
561 (179)
363 (129)
p-value of Chi-Sq
Non-Sig.
0.000
0.323
0.000
0.000
Largest Std. Residual
< 3.5
3.11
3.53
7.1
7.0
Largest Mod. Index
< 5.0
4.66
6.31
76.0
80.0
Fit Index
Chi-square /df
<5.0
2.05
1.09
3.14
2.82
GFI
>0.90
0.906
0.955
0.749
0.798
AGFI
>0.80
0.848
0.922
0.677
0.733
CFI
>0.90
0.986
0.998
0.967
0.968
NFI
>0.90
0.973
0.995
0.952
0.951
Standardized RMR
<0.05
0.032
0.027
0.088
0.073
*After further refinement; #with Holdout sample
Table 6. Unidimensionality and Goodness of Fitness for IS Service Superiority (DD scale)
Unidimensionality
Cut-off
Chi-square (df)
1st sample
Holdout*
#SERVQUAL+
#IS ZOT
53.5 (29)
41.3 (29)
758 (179)
713 (129)
p-value of Chi-Sq
Non-Sig
0.004
0.064
0.000
0.000
Largest Std. Residual
< 3.5
2.34
3.36
8.7
8.2
Largest Mod. Index
< 5.0
5.72
9.22
101.8
87.3
Chi-square /df
<5.0
1.82
1.42
4.24
5.52
GFI
>0.90
0.937
0.951
0.689
0.669
AGFI
>0.80
0.880
0.907
0.599
0.561
CFI
>0.90
0.998
0.993
0.939
0.920
NFI
>0.90
0.969
0.979
0.923
0.902
Standardized RMR
<0.05
0.047
0.036
0.132
0.123
Fit Index
*After further refinement; #with Holdout sample
constructs criteria (chi-squared value is significant at p<.000, the standardized residual is 7.0, and
the largest modification index is 80.0).
Having satisfied the conditions of unidimensionality and goodness of fit indices, the composite
reliabilities and AVEs are computed based on the holdout sample (Tables 7 and 8). For the service
adequacy instrument (Table 7), the composite reliabilities (the lowest is 0.8459) of all the constructs
far exceed the cut-off of value of 0.80. The AVEs of the constructs (the lowest is 0.6478) is well
above the suggested cut-off of 0.50, indicating that the variance accounted for by each construct’s
items is higher than that accounted for by the errors. Furthermore, the standardized factor loadings
range from 0.724 to 0.925 (see Table 4 for the factor loadings on the holdout sample), and all are
11
Journal of Global Information Management
Volume 29 • Issue 6 • November-December 2021
Table 7. Scale Properties for IS Service Adequacy (ED scale)
Construct
CR
AVE
SQRTAVE
Correlations of Constructs
Tangibility
Reliability
Responsiveness
Tangibility
0.846
0.648
0.805
1
Reliability
0.895
0.741
0.861
0.774
1
Responsiveness
0.882
0.788
0.888
0.676
0.779
1
Empathy
0.908
0.767
0.876
0.631
0.648
0.756
Empathy
1
significant, meeting the minimum cut-off of 0.70. These results demonstrate the convergent validity
of the constructs of the service adequacy instrument. The instrument also satisfies discriminant
validity since the correlation coefficient between any two constructs is lower than the square-roots
of the AVEs of those constructs.
The composite reliabilities of the service superiority instrument (Table 8) range from 0.819 to
0.906; the AVEs of the constructs range from 0.696 to 0.764, and the standardized indicator loadings
range from 0.760 to 0.905 (Table 7). Thus, the service superiority instrument meets the minimum
cut-offs for convergent validity. Except for the correlation coefficient between assurance and empathy,
all the other correlation coefficients are lower than the square-root of the AVEs of the corresponding
constructs. All of this demonstrates adequate support for discriminant validity.
4.1. Comparison with Kettinger and Lee (2005) Study
Kettinger and Lee’s (2005) scales can be used for measuring Expectation-Disconfirmation and
Desire-Disconfirmation. We applied the dimensions of Kettinger and Lee (2005) scales and examined
their psychometric properties. The resulting scales did not demonstrate acceptable psychometric
properties in terms of unidimensionality and goodness of fit indices (see Tables 5 and 6). Kettinger
and Lee’s (2005) IS-ZOT scale for service adequacy (or expectation-disconfirmation) has GFI 0.80,
AGFI 0.73, standardized RMR 0.073, and modification index 80. Similarly, Kettinger and Lee’s
(2005) instrument exhibited low psychometric properties concerning service superiority (or desiredisconfirmation) – GFI 0.67, AGFI 0.56, standardized RMR 0.123, and modification index of 87. Thus,
the dimensions of Kettinger and Lee (2005) scales are not suitable to measure ED or DD and should
not be used for service discrepancy measures. It was noticed that the constructs of the SERVQUAL+
instrument do not satisfy either the goodness-of-fit measurement or the unidimensionality criteria.
The SERVQUAL+ unidimensionality and fitness indices for service adequacy include GFI 0.749,
AGFI 0.677, a standardized RMR of 0.088, modification indices 76, and a standardized residual of
7.1. Thus, neither the SERVQUAL+ instrument nor the IS ZOT scales are found to be suitable for
adequate service or desired service-based discrepancy measures of IS service quality. Hence, we have
Table 8. Scale Properties for IS Service Superiority (DD scale)
CR
AVE
SQRTAVE
Correlations of Constructs
Construct
Tangibility
0.852
0.742
0.862
1
Reliability
0.906
0.764
0.874
0.775
1
Assurance
0.848
0.735
0.858
0.451
0.531
1
Empathy
0.819
0.696
0.834
0.564
0.766
0.705
12
Tangibility
Reliability
Assurance
Empathy
1
Journal of Global Information Management
Volume 29 • Issue 6 • November-December 2021
successfully shown that a different set of instruments is appropriate for assessing service discrepancies
(i.e., ED and DD) of IS service quality.
The dimensional structures of our ED and DD based scales are very different from the perceived
service-based factor structure of Kettinger and Lee (2005) scale in several ways. Assurance is eliminated
in the service adequacy (ED) scale, and responsiveness is eliminated in the service superiority (DD)
scale in the present research. However, the assurance construct is retained and combined with empathy
to form the ‘rapport’ construct in Kettinger and Lee (2005) scale that was derived using exploratory
factor analysis. Apart from this, there are other differences, as well. While all the four question items of
empathy are included in the Kettinger and Lee (2005) scale, three-question empathy items are loaded
in the IS service adequacy scale. Two question items are included in the IS superiority scale in the
present study. Out of empathy items, our ED scale includes item #18 (“Paying individual attention
to users”), and the DD scale includes item #21 (“IS staff understand users’ needs”). Intuitively, item
#18 reflects the basic needs and minimum expectations of IS users. Item #21 is beyond the minimum
requirement, i.e., expecting the service provider to understand the users’ work environment and IS
users’ information needs; this belongs to the DD scale. The high factor loadings of items #18 and
#21 into their respective scales reflect these items’ natural alignment separately.
5. DISCUSSIoN
The research objectives were to (i) hypothesize and develop scales for IS service quality based on
expectation-disconfirmation and desire-disconfirmation theories, and ii) to compare our scales
with the service quality scales developed in previous research. The present research has derived
two constructs measuring the IS service quality: IS service adequacy (ED scale) and IS service
superiority (DD scale) to meet the above objectives. The results suggested that the ED-based scale
has a different dimensional structure compared to DD based scale. Both ED and DD based scales
demonstrate unidimensionality and superior psychometric properties providing support for the validity
of disconfirmation-based scales.
Our results highlight that the ED scale has the dimensional structure of reliability, responsiveness,
and empathy. At the same time, our results show the ED scale to have a dimensional structure of
tangibles, reliability, responsiveness, and empathy. The DD scale has the dimensional structure of
reliability and assurance. At the same time, our results show the ED scale to have a dimensional
structure of tangibles, reliability, assurance, and empathy.
Carr (2002) stipulates that gap measures can only be used if the component scores demonstrate
reasonable psychometric properties. Accordingly, psychometric analysis of the components scores
for each service adequacy and service superiority scale was performed using the holdout sample, all
of which satisfied the required criteria. The adequate service exhibits acceptable goodness of fit (GFI
0.94, AGFI 0.88, and standardized RMR 0.023), convergent validity (factor loadings: 0.79 - 0.96;
composite reliabilities > 0.87; AVEs > 0.68), and discriminant validity. The perceived service also
met the criteria (GFI 0.90; AGFI 0.825; standardized RMR 0.03; factor loadings range from 0.82
to 0.96; composite reliabilities > 0.89; AVEs > 0.73; and discriminant validity). Similarly, desired
service exhibited good psychometric properties (GFI 0.94; AGFI 0.88; standardized RMR 0.02; factor
loadings 0.84 - 0.98; composite reliabilities > 0.86; AVEs > 0.75).
The study results show that assurance is not a significant construct in the IS service adequacy
(ED) scale. Simultaneously, it is a significant factor of the IS service superiority (DD) scale. A
possible explanation could be that assurance deals with “courteous interactions with users” and
“provision of a safe user environment.” When users are concerned about minimum service levels,
these interactions may not be that important since users will be more interested in basic requirements,
such as responsiveness and empathy (for example, “providing prompt service to end-users” or “give
personal attention to users”). The question items of assurance (“courteous interactions” and “provision
of a safe user environment”) could be more critical for those who usually receive service at a level
13
Journal of Global Information Management
Volume 29 • Issue 6 • November-December 2021
much beyond minimum service levels. Such items may influence the desired service level expectations.
Our results are in agreement with the observations of Parasuraman et al. (1985, 1994): customers
expect basic services (not fancy services) and performance (not empty promises). The assurance
appears to be a significant factor in the service superiority (DD) scale, while responsiveness is not a
significant factor. The services related to responsiveness (for example, “providing prompt services to
end-users”) are necessary to meet the minimum service levels and hence do not factor in the desired
service-based discrepancy measure (i.e., IS service superiority). Thus, assurance is not a significant
dimension in the service adequacy scale, while responsiveness is not a significant dimension in the
service superiority scale.
6. THEoRETICAL AND MANAGERIAL IMPLICATIoNS
6.1. Theoretical Implications
This research’s primary contribution is to conceptualize and provide empirical support for IS
evaluation’s desire-disconfirmation scale. The service superiority (DD) scale has been found to have
outperformed the existing measures of scales such as service adequacy (ED) scale, SERVQUAL+,
and IS ZOT scales. Besides, we explore the reason for the difference in structures of service adequacy,
service superiority, and IS ZOT scales. As the item correlations concerning perceived service-only
measure are different from the item correlations for, say, adequate service – perceived service gap.
The instrument structures derived based on these criteria will be different. The service superiority
scale has followed a more rigorous and robust methodological approach, including CFA and CMB
assessment compared to earlier IS service quality measurement.
For customers or IS users to be satisfied, both the service adequacy and the service superiority
need to be considered (Spreng et al. 1996). Further, negative disconfirmations have more influence
than positive disconfirmations (Nevo and Wade, 2007; James, 2007). Hence, negative disconfirmations
for each stakeholder’s desires and expectations should be computed and summed for each of the
service adequacy and service superiority scales’ dimensions. The scale with the largest negative
disconfirmation should be used and the dimensions of that scale can be considered for diagnostic
purposes and corrective action.
6.2. Managerial Implications
Service superiority scale should be used when the user does not have any prior expectations about
an IS or IT application’s performance. Churchill and Surprenant (1982) indicate a non-significant
influence of service adequacy in new product innovations. However, when a consumer has used a
product several times as the product meets his/her desires, expectations increase, and service adequacy
may be more important (Spreng et al. 1996). Thus, for IS stakeholders who had prior experience with
an IS or IT applications, service adequacy becomes more important and should be used.
Next, the experienced IS users may develop some desires (exceeding expectations) after using
an application for some time. For example, after experiencing graphical user interfaces in the IT
applications, IS users may desire even more user-friendly interfaces in future IS designs. Depending on
the extent of negative disconfirmations for the dimensions of service adequacy and service superiority
scales, the IS manager can allocate resources to the appropriate service dimensions, thereby allowing
corrective actions. These corrective actions result in increased user satisfaction.
7. CoNCLUSIoN
While assessing an IS service quality’s performance, though the desire is closer to satisfaction measure
than expectation, most existing measurements are benchmarked against expectation alone. We have
proposed and empirically validated the following two new IS service quality constructs to bridge
14
Journal of Global Information Management
Volume 29 • Issue 6 • November-December 2021
this measurement gap: Service Adequacy (difference of expected service and perceived service) and
Service Superiority (difference of desired service and perceived service). Our results show that while
ED (or IS service adequacy) scale contained four dimensions (tangibles, reliability, responsiveness,
and empathy), DD (or IS service superiority) scale has dimensions of tangibles, reliability, assurance,
and empathy. Both the ED and DD scales have exhibited superior psychometric properties compared to
previous IS service quality scales like SERVQUAL+ and the IS ZOT scales. Psychometric properties
include unidimensionality, the goodness of fit, convergent validity, and discriminant validity.
8. LIMITATIoNS AND SCoPE FoR FUTURE woRK
The current research can be extended in the following directions. First, the success of the IS is often
measured by the IS user satisfaction (DeLone and McLean, 2003). Present research can be extended
to examine user satisfaction with IS service adequacy and IS user satisfaction separately. Such
research could add insights to user satisfaction patterns, like the studies of behavioral patterns found
in marketing (Parasuraman et al., 2005). Second, the service adequacy and service superiority scales
derived in this research that correspond to IS service adequacy and IS service superiority have about
50% of the items in the SERVQUAL+ instrument. This could pose a threat to content validity since
complete service quality items are not represented. Though it is not uncommon to have two-item
constructs, future research may be devoted to refining these scales to represent at least three items
for each construct (Etezadi-Amoll and Farhoomand, 1991).
Next, because of globalization, there is an accelerated phenomenon of IS outsourcing or
offshoring. Future studies can extend our work by developing scales for IS service adequacy and
IS service superiority for IS insourcing and IS outsourcing separately. Next, future studies can also
examine interdependencies between the dimensions of each IS service adequacy (ED) and IS service
superiority (DD) scales. Finally, Jia et al. (2008) propose IT service climate variables that include
service leadership, service vision, customer feedback, and customer communication. Future studies
can empirically examine the impact of these four IT service climate variables on the dimensions of
service adequacy and service superiority scales derived in this study. The results may lead to higher
service quality and satisfaction.
15
Journal of Global Information Management
Volume 29 • Issue 6 • November-December 2021
REFERENCES
Arasli, H., Katircioglu, S. T., & Mehtap-Smadi, S. (2005). A comparison of service quality in the banking industry:
Some evidence. International Journal of Bank Marketing, 23(7), 508–526. doi:10.1108/02652320510629881
Babakus, E., & Boller, G. W. (1992). An empirical assessment of the SERVQUAL scale. Journal of Business
Research, 24(3), 253–268. doi:10.1016/0148-2963(92)90022-4
Boulding, W., Kalra, A., Staelin, R., & Zeithaml, V. A. (1993). A dynamic process model of service
quality: From expectations to behavioral intentions. JMR, Journal of Marketing Research, 30(1), 7–27.
doi:10.1177/002224379303000102
Bowen, D. (1989). Leadership aspects and reward systems of customer satisfaction. Speech given at CTM
Customer Satisfaction Conference, Los Angeles, CA.
Carr, L. C. (2002). A psychometric evaluation of the expectations, perceptions, and difference-scores generated
by the IS-adapted SERVQUAL instrument. Decision Sciences, 33(2), 281–296. doi:10.1111/j.1540-5915.2002.
tb01645.x
Cavana, R. Y., Lawrence, M. C., & Lo, Y. L. (2007). Developing zones of tolerance for managing
passenger rail service quality. International Journal of Quality & Reliability Management, 24(1), 7–31.
doi:10.1108/02656710710720303
Chen, T., Ma, K., Bian, X., Zheng, C., & Devlin, J. (2018). Is high recovery more effective than expected
recovery in addressing service failure?—A moral judgment perspective. Journal of Business Research, 82, 1–9.
doi:10.1016/j.jbusres.2017.08.025
Chin, W. W., & Lee, M. K. O. (2000). A proposed model and measurement instrument for the formation of IS
satisfaction: the case of end-user computing satisfaction. Proceedings of the twenty first international conference
on Information systems, 553-563.
Churchill, G. A. Jr, & Surprenant, C. (1982). An investigation into the determinants of customer satisfaction.
JMR, Journal of Marketing Research, 19(4), 491–504. doi:10.1177/002224378201900410
Cook, C., Heath, F., & Thompson, B. (2003). Zones of tolerance in the perceptions of library service quality: A
“LibQUAL+” study. Portal (Baltimore, Md.), 3(1), 113–123. doi:10.1353/pla.2003.0003
Craighead, C. W., Ketchen, D. J., Dunn, K. S., & Hult, G. T. M. (2011). Addressing common method variance:
Guidelines for survey research on information technology, operations, and supply chain management. IEEE
Transactions on Engineering Management, 58(3), 578–588. doi:10.1109/TEM.2011.2136437
Cronin, J. J. Jr, & Taylor, S. A. (1992). Measuring service quality: A re-examination and extension. Journal of
Marketing, 56(3), 55–68. doi:10.1177/002224299205600304
DeLone, W. H., & McLean, E. R. (2003). The DeLone and McLean model of information system success. Journal
of Management Information Systems, 19(4), 9–30. doi:10.1080/07421222.2003.11045748
Durvasula, S., Lobo, A. C., Lysonski, S., & Mehta, S. C. (2006). Finding the sweet spot: A two industry study
using the zone of tolerance to identify determinant service quality attributes. Journal of Financial Services
Marketing, 10(3), 244–259. doi:10.1057/palgrave.fsm.4770190
Etezadi-Amoll, J., & Farhoomand, A. F. (1999). On end-user computing satisfaction. Management Information
Systems Quarterly, 1–4.
Gefen, D. (2003). Assessing unidimensionality through LISREL. Communications of the Association for
Information Systems, 2, 23–47.
Gorla, N., & Somers, T. M. (2014). The impact of IT outsourcing on information systems success. Information
& Management, 51(3), 320–335. doi:10.1016/j.im.2013.12.002
Hogreve, J., Bilstein, N., & Mandl, L. (2017). Unveiling the recovery time zone of tolerance: When time matters in
service recovery. Journal of the Academy of Marketing Science, 45(6), 866–883. doi:10.1007/s11747-017-0544-7
16
Journal of Global Information Management
Volume 29 • Issue 6 • November-December 2021
Hossain, M. J. (2019). Redefining Expectancy Disconfirmation Theory using LIS SERVQUAL+: An Integrated
Framework for evaluating Library Service Quality and User Satisfaction. The International Information &
Library Review, 51(3), 203–216. doi:10.1080/10572317.2018.1496316
James, O. (2007). Evaluating the expectations disconfirmation and expectations anchoring approaches to citizen
satisfaction with local public services. Journal of Public Administration: Research and Theory, 19(1), 107–123.
doi:10.1093/jopart/mum034
Jia, R., Reich, B. H., & Pearson, J. M. (2008). IT service climate: An extension to it service quality research.
Journal of the Association for Information Systems, 9(5), 294–320. doi:10.17705/1jais.00159
Jiang, J. J., Klein, G., & Crampton, S. (2000). A note on SERVQUAL reliability and validity in information
system service quality measurement. Decision Sciences, 31(3), 725–745. doi:10.1111/j.1540-5915.2000.tb00940.x
Joseph, M., Yakhou, M., & Stone, G. (2005). An educational institution’s quest for service quality: Customers’
perspective. Quality Assurance in Education, 13(1), 66–82. doi:10.1108/09684880510578669
Kettinger, W. J., & Lee, C. C. (1997). Pragmatic perspectives on the measurement of information systems service
quality. Management Information Systems Quarterly, 21(2), 223–240. doi:10.2307/249421
Kettinger, W. J., & Lee, C. C. (2005). Zones of tolerance: Alternative scales for measuring information systems
service quality. Management Information Systems Quarterly, 29(4), 607–623. doi:10.2307/25148702
Khalifa, M., & Liu, V. (2002). Satisfaction with internet-based services: The role of expectations and desires.
International Journal of Electronic Commerce, 7(2), 31–49. doi:10.1080/10864415.2002.11044267
Klein, G., Jiang, J. J., & Cheney, P. (2009). Resolving difference score issues in information systems research.
Management Information Systems Quarterly, 33(4), 811–826. doi:10.2307/20650328
Lemy, D., Goh, E., & Ferry, J. (2019). Moving out of the silo: How service quality innovations can develop customer
loyalty in Indonesia’s hotels. Journal of Vacation Marketing, 25(4), 462–479. doi:10.1177/1356766718819658
Nadiri, H., & Hussain, K. (2005). Diagnosing the zone of tolerance for hotel services. Managing Service Quality,
15(3), 259–277. doi:10.1108/09604520510597818
Negash, S., Ryan, T., & Igbaria, M. (2003). Quality and effectiveness in web-based customer support systems.
Information & Management, 40(8), 757–768. doi:10.1016/S0378-7206(02)00101-5
Nevo, D., & Wade, M. R. (2007). How to avoid disappointment by design. Communications of the ACM, 50(4),
43–48. doi:10.1145/1232743.1232746
Nishant, R., Srivastava, S. C., & Teo, T. S. (2019). Using Polynomial Modeling to Understand Service Quality
in E-Government Websites. Management Information Systems Quarterly, 43(3), 807–826. doi:10.25300/
MISQ/2019/12349
Pakdil, F., & Aydin, O. (2007). Expectations and perceptions in airline services: An analysis using weighted
SERVQUAL scores. Journal of Air Transport Management, 13(4), 229–237. doi:10.1016/j.jairtraman.2007.04.001
Parasuraman, A., Zeithaml, V. A., & Berry, L. L. (1985). A conceptual model of service quality and its implications
for future research. Journal of Marketing, 49(3), 41–50. doi:10.1177/002224298504900403
Parasuraman, A., Zeithaml, V. A., & Berry, L. L. (1994). Reassessment of expectations as a comparison
standard in measuring service quality: Implications for further research. Journal of Marketing, 58(1), 111–124.
doi:10.1177/002224299405800109
Parasuraman, A., Zeithaml, V. A., & Malhotra, A. (2005). ES-QUAL: A multiple-item scale for assessing
electronic service quality. Journal of Service Research, 7(3), 213–233. doi:10.1177/1094670504271156
Podsakoff, P. M., MacKenzie, S. B., & Podsakoff, N. P. (2012). Sources of method bias in social science research
and recommendations on how to control it. Annual Review of Psychology, 63(1), 539–569. doi:10.1146/annurevpsych-120710-100452 PMID:21838546
Premkumar, G., & Bhattacherjee, A. (2008). Explaining information technology usage: A test of competing
models. Omega, 36(1), 64–75. doi:10.1016/j.omega.2005.12.002
17
Journal of Global Information Management
Volume 29 • Issue 6 • November-December 2021
Qazi, A., Tamjidyamcholo, A., Raj, R. G., Hardaker, G., & Standing, C. (2017). Assessing consumers’ satisfaction
and expectations through online opinions: Expectation and disconfirmation approach. Computers in Human
Behavior, 75, 450–460. doi:10.1016/j.chb.2017.05.025
Rouf, M. A., Babu, M. A., Khatun, M. A., Rasel, M., & Kumar, A. (2019). Measuring Customer’s Satisfaction
Level and Service Gap Between bKash and Rocket in Bangladesh. American Journal of Marketing Research,
5(2), 29–35.
Schaffer, O., & Fang, X. (2020). The Impact of Fulfilling a Desire for Idealism on Task Engagement and
Enjoyment in Digital Games. In International Conference on Human-Computer Interaction (pp. 162-178).
Springer. doi:10.1007/978-3-030-50164-8_11
Segars, A. H. (1997). Assessing unidimensionality of measurement: A paradigm and illustration within the
context of information systems. Omega, 25(1), 107–121. doi:10.1016/S0305-0483(96)00051-5
Segars, A. H., & Grover, V. (1993). Re-examining perceived ease of use and usefulness: A confirmatory factor
analysis. Management Information Systems Quarterly, 17(4), 517–525. doi:10.2307/249590
Silvestro, R. (2005). Applying gap analysis in the health service to inform the service improvement agenda.
International Journal of Quality & Reliability Management, 22(3), 215–233. doi:10.1108/02656710510582462
Spreng, R. A., MacKenzie, S. B., & Olshavsky, R. W. (1996). A re-examination of the determinants of consumer
satisfaction. Journal of Marketing, 60(3), 15–32. doi:10.1177/002224299606000302
Suh, K., Kim, S., & Lee, J. (1994). End user’s disconfirmed expectations and the success of information systems.
Information Resources Management, 7(4), 30–39. doi:10.4018/irmj.1994100103
Tsai, H. H., & Lu, I. Y. (2006). The evaluation of service quality using generalized Choquet integral. Information
Sciences, 176(6), 640–663. doi:10.1016/j.ins.2005.01.015
Van Dyke, T. P., Kappelman, L. A., & Prybutok, V. R. (1999). Cautions on the use of SERVQUAL measure to assess
the quality of information systems services. Decision Sciences, 30(3), 877–891. doi:10.1111/j.1540-5915.1999.
tb00911.x
Weitzl, W. J., & Hutzinger, C. (2019). Rise and fall of complainants’ desires: The role of pre-failure brand
commitment and online service recovery satisfaction. Computers in Human Behavior, 97, 116–129. doi:10.1016/j.
chb.2019.02.029
Zamani, E. D., & Pouloudi, N. (2020). Generative mechanisms of workarounds, discontinuance and reframing:
a study of negative disconfirmation with consumerised IT. Information Systems Journal.
Zeithaml, V. A., Berry, L. L., & Parasuraman, A. (1993). The nature of determinants of customer expectations
of service quality. Journal of the Academy of Marketing Science, 21(1), 1–12. doi:10.1177/0092070393211001
18
Journal of Global Information Management
Volume 29 • Issue 6 • November-December 2021
Ankit Kesharwani (PhD) is an assistant professor at the Indian Institute of Foreign Trade (IIFT), India. He was a
visiting scholar at Fogelman College of Business and Economics, University of Memphis, the USA in 2011 -2012. He
has specialization in Digital Marketing, Web and social media analytics, Marketing research, and marketing analytics.
He has taken training sessions for employees of various government and corporate organizations, including DGR,
Tata Metaliks, Electronics Corporation of India Limited, Punjab National Bank, National Cooperative Dairy Federation
of India Ltd, Engineers India Ltd, and Indian Energy Exchange Limited. He has also published several research
papers in premier international journals including Information & Management, Journal of Strategic Marketing,
Behavior & Information technology, International Journal of Bank Marketing, Journal of Internet Commerce, etc.
Mani Venkatesh (PhD) Associate Professor, in the Department of Strategy and Entrepreneurship, Montpellier
Business School (MBS), France. He earned his PhD from Indian Institute of Technology (IIT), Roorkee and later he
was awarded one of the prestigious Erasmus (European Union) fellowship to pursue his Post-doctoral research, in
Faculty of Economics (FEP), University of Porto, Portugal. He possesses over 21 years of academic and industrial
experience, of which over a decade he served in fortune 500 companies in various senior management roles. His
research revolves around the most pressing strategic issues including supply chain social sustainability, circular
economy, interplay between industry 4.0 and sustainability, and digital transformation in the global supply chains
from the perspective of emerging economies. He has contributed many research articles in referred journals:
International Journal of Production Economics, Transportation Research Part A, Supply Chain Management: An
International Journal, Technological Forecasting and Social Change, Production Planning and Control, Business
Strategy and the Environment, International Journal of Information Management, and Journal of Cleaner Production.
His book titled ‘supply chain social sustainability for manufacturing: measurement and performance outcomes
from India’ published by Springer Nature is among the top used publications that concern one or more of the
United Nations Sustainable Development Goals(SDGs). He also serves as editorial advisory board member of
Management Decision (Emerald publications).
Jighyasu Gaur holds a Ph.D. in Management and Associate professor in the department of Operations and
Decision Science at T A Pai Management Institute, India. He has received the Emerging Economies Doctoral
Student Award (EEDSA) 2012 from the Production and Operations Management Society (POMS), USA. He has
published research papers and management cases in journals of international repute and has presented papers
at international conferences.
Samuel Fosso Wamba (PhD) is a Professor at Toulouse Business School, France, and Visiting Professor of
Artificial Intelligence in Business at The University of Bradford, UK. He earned his Ph.D. in industrial engineering
at the Polytechnic School of Montreal, Canada. His current research focuses on business on the business value
of I.T., inter-organizational systems adoption, use and impacts, supply chain management, electronic commerce,
blockchain, artificial intelligence for business, social media, business analytics, big data, and open data. His work has
been published in several international conferences and journals, including the following: Academy of Management
Journal, European Journal of Information Systems, International Journal of Production Economics, International
Journal of Operations & Production Management, International Journal of Production Research, Journal of Business
Research, Electronic Markets, Technology Forecasting and Social Change, Information Systems Frontiers, and
Production Planning & Control. In 2017, he won the Best Paper Award by The Academy of Management Journal and
by The Electronic Markets: The International Journal on Networked Business. He has been serving as a member
on the editorial board of five international journals. Moreover, He is a CompTIA RFID+ Certified Professional, and
the Academic Co-Founder of RFID Academia. Apart from teaching and conducting research, He leads the newly
created Artificial Intelligence & Business Analytics Cluster. In one of his areas of research, he has been recently
recognized as the most influential scholar in big data analytics and enterprises based on the number of published
articles and the number of citations, and among the 2% of the most influential scholars in the world based on the
Mendeley database that includes 100,000 top-scientists. He ranks in ClarivateTMs 1% most cited scholars in the
world for 2020, from the “Highly Cited ResearchersTM” list that identifies global research scientists who show
exceptional influence-reflected in the publication of multiple papers frequently cited by their peers. Furthermore,
his current Google Scholar h-index is 46, with 9,009 citations by November 29.
Sachin Kamble is Professor of Strategy (Operations and Supply Chain Management) at EDHEC Business School,
France. He has over 20 years of academic experience and is associated with leading manufacturing organizations
in India, as a consultant and trainer. His-research interest is inclined towards understanding the impact of emerging
technologies such as Blockchain, Industry 4.0 and Big Data Analytics on sustainable supply chain performance.
His work has been published in high impact journals such as International Journal of Production Economics,
International Journal of Production Research, Technological Forecasting and Social Change, Computers in Industry,
and Production Planning and Control.
19
Service Quality Measurement in Information Systems
Journal of Global Information Management
Traditionally measurements of service quality have followed the expectation-disconfirmation approach. Further, previous studies have shown that negative disconfirmation is more influential than positive disconfirmation. In this research, we hypothesized information systems(IS) service quality scales based on the dimensionality of the expectation-disconfirmation (ED) and desire-disconfirmation (DD) approach. Using the SERVQUAL+ instrument and data collected from 321 IS users, we developed ED and DD based IS service quality scales using contemporary methods, such as LISREL-based CFA. We have proposed and empirically validated the following two new IS service quality constructs: Service Adequacy (difference of expected service and perceived service) and Service Superiority (difference of desired service and perceived service). Our results indicate that both measures have shown better predictive power than earlier scales like SERVQUAL+ and the IS ZOT scales. We have outlined several imp......Read more