ApJ accepted: March 18, 2008
Preprint typeset using LATEX style emulateapj v. 03/07/07
RESOLVING THE CHEMISTRY IN THE DISK OF TW HYDRAE
I. DEUTERATED SPECIES
Chunhua Qi1 , David J. Wilner1 , Yuri Aikawa2 , Geoffrey A. Blake3 , Michiel R. Hogerheijde4
arXiv:0803.2753v1 [astro-ph] 19 Mar 2008
ApJ accepted: March 18, 2008
ABSTRACT
We present Submillimeter Array (SMA) observations of several deuterated species in the disk around
the classical T Tauri star TW Hydrae at arcsecond scales, including detections of the DCN J=3–2
and DCO+ J=3–2 lines, and upper limits to the HDO 31,2 –22,1 , ortho-H2 D+ 11,0 –11,1 and para-D2 H+
11,0 –10,1 transitions. We also present observations of the HCN J=3–2, HCO+ J=3–2 and H13 CO+
J=4–3 lines for comparison with their deuterated isotopologues. We constrain the radial and vertical
distributions of various species in the disk by fitting the data using a model where the molecular
emission from an irradiated accretion disk is sampled with a 2D Monte Carlo radiative transfer code.
We find that the distribution of DCO+ differs markedly from that of HCO+ . The D/H ratios inferred
change by at least one order of magnitude (0.01 to 0.1) for radii <30 AU to ≥70 AU and there is a
rapid falloff of the abundance of DCO+ at radii larger than 90 AU. Using a simple analytical chemical
model, we constrain the degree of ionization, x(e-)=n(e-)/n(H2 ), to be ∼ 10−7 in the disk layer(s)
where these molecules are present. Provided the distribution of DCN follows that of HCN, the ratio of
DCN to HCN is determined to be 1.7±0.5 × 10⁻² ; however, this ratio is very sensitive to the poorly
constrained vertical distribution of HCN. The resolved radial distribution of DCO+ indicates that in
situ deuterium fractionation remains active within the TW Hydrae disk and must be considered in
the molecular evolution of circumstellar accretion disks.
Subject headings: circumstellar matter —comets: general —ISM: molecules —planetary systems: protoplanetary disks —stars: individual (TW Hydrae) —stars: pre-main-sequence
1. INTRODUCTION
Millimeter-wave interferometers have imaged the gas
and dust surrounding over a dozen T Tauri and Herbig
Ae stars (see Dutrey et al. 2007 for a review). These
studies demonstrate the potential to dramatically improve our understanding of disk physical and chemical
structure, providing insights that will ultimately enable
a more comprehensive understanding of star and planet
formation. As analogs to the Solar Nebula, these circumstellar disks offer a unique opportunity to study the conditions during the planet formation process, especially
the complex chemical evolution that must occur. In the
outer parts of the disk directly accessible to millimeterwave interferometry, observations of deuterated species
are particularly important because they can constrain
the origin of primitive solar system bodies such as comets
and other icy planetesimals.
Deuterated molecule chemistry is sensitive to the temperature history of interstellar and circumstellar gas, as
well as to density-sensitive processes such as molecular
depletion in the cold (< 20 K) and dense (> 106 cm−3 )
disk midplane. The similarity of molecular D/H ratios
between comets and high mass hot cores has been used
to argue for an “interstellar” origin of cometary matter, but ambiguity remains and this argument is not se1 Harvard–Smithsonian Center for Astrophysics, 60 Garden
Street, MS 42, Cambridge, MA 02138, USA; cqi@cfa.harvard.edu,
dwilner@cfa.harvard.edu.
2 Department of Earth and Planetary Sciences, Kobe University,
Kobe 657-8501, Japan; aikawa@kobe-u.ac.jp.
3 Divisions of Geological & Planetary Sciences and Chemistry
& Chemical Engineering, California Institute of Technology, MS
150–21, Pasadena, CA 91125, USA; gab@gps.caltech.edu.
4 Leiden Observatory, Leiden University, PO Box 9513, 2300 RA,
Leiden, The Netherlands; michiel@strw.leidenuniv.nl.
cure (Bergin et al. 2007). Aikawa & Herbst (1999) investigate the chemistry of deuterium-bearing molecules
in outer regions of protoplanetary disks and find that
molecules formed in the disk have similar D/H ratios
as those in comets. To date, the determination of D/H
ratios in disks has been limited to the measurements of
DCO+ /HCO+ in two classical T Tauri Stars (cTTs) with
single dish telescopes (TW Hydrae, van Dishoeck et al.
2003; DM Tauri, Guilloteau et al. 2006), but DCO+ has
not been observed in comets. Although H2 D+ and HDO
lines have been detected in disks (Ceccarelli et al. 2004,
2005), there are no corresponding H+
3 and H2 O observations that allow derivations of the D/H ratio. Therefore, direct measurements in disks of species observed in
comets, such as DCN and HCN, will be important to help
relate deuterium fractionation in disks to that in comets.
Deuterated molecules in cold pre-stellar and protostellar cores are found to be enhanced by orders of magnitude
over the elemental D/H abundance ratio of 1.5×10⁻⁵
through fractionation in the gas phase at low temperatures, an effect driven primarily by deuterated H+
3 , which
is formed by exchange reaction between H+
3 and HD,
then transfers its deuteron to neutral species. Theoretical models of disks (Aikawa et al. 2002; Willacy 2007)
with realistic temperature and density structure show
that the DCO+ /HCO+ ratio increases with radius due
to the decreasing temperature moving out from the star.
Spatially resolved data of deuterated molecules will help
test disk physical models through these chemical consequences.
The current capabilities of millimeter-wave observatories are limited both by sensitivity and by the small angular size of circumstellar disks, which makes spatially
resolving the deuterium fractionation difficult. In this
�2
work we take advantage of the proximity of the most
nearby classical T Tauri star, TW Hydrae, which is surrounded by a disk of radius 3.′′ 5, or 200 AU at a distance
of 56 pc (Qi et al. 2004), and a possible orbiting planet
of mass (9.8±3.3) MJupiter at 0.04 AU (Setiawan et al.
2008), to study the physical and chemical structure of a
protoplanetary environment at high spatial and spectral
resolution using interferometry. The TW Hydrae disk is
viewed nearly face-on, and so is well posed to investigate
the radial distribution of molecular emission. Although
the current angular resolution of ∼1–2′′ places only a
few independent beams ( or ‘pixels’) across the disk, effectively improved resolution of the disk chemistry can
be achieved thanks to the fact that the gas kinematics are essentially Keplerian. Beckwith & Sargent (1993)
show that molecular line emission from Keplerian disks
displays a “dipole” pattern near the systematic velocity due to the shear created by the orbital motion. The
emission near the systemic velocity is dominated by the
outer disk regions, and the separation of the emission
peaks depends sensitively on the abundance gradient of
the emitting species with radius. This important feature,
commonly seen in velocity channel maps of disks with a
range of inclination angles (even as small as 6–7 degrees
in the case of TW Hydrae, Qi et al. 2004), may be used
to study the radial distribution of molecular emission far
more precisely than is afforded by the limited number of
“pixels” provided by the available resolution.
Here we report on Submillimeter Array (SMA)5 (Ho
et al. 2004) observations of deuterated species in the disk
around TW Hydrae, including the first detection and images of DCN and DCO+ . In §2 we describe the observations, while in §3 we introduce the analysis method used
and the molecular distribution parameters derived. We
describe the model fitting results and discuss the implications in §4, and we present a summary and conclusions
in §5.
2. OBSERVATIONS
All of the observations of TW Hydrae (R.A.:
11h 01m 51.s 875; Dec: -34◦ 42′ 17.′′ 155; J2000.0) were
made between 2005 February and 2006 December using
the SMA 8 antenna interferometer located atop Mauna
Kea, Hawaii. Table 1 and Table 2 summarize the observational parameters for the detected and undetected
species, respectively. The SMA receivers operate in a
double-sideband (DSB) mode with an intermediate frequency band of 4–6 GHz which is sent over fiber optic transmission lines to 24 “overlapping” digital correlator “chunks” covering a 2 GHz spectral window. Two
settings were used for observing the HCN/DCN and
HCO+ /DCO+ lines: at 265.7–267.7 GHz (lower sideband) the tuning was centered on the HCN J=3–2 line at
265.8862 GHz in chunk S22 while the HCO+ J=3–2 line
at 267.5576 GHz was simultaneously observed in chunk
S02; at 215.4–217.4 GHz (lower sideband) the tuning was
centered on the DCO+ J=3–2 line at 216.1126 GHz in
chunk S16 while the DCN J=3–2 line at 217.2386 GHz
was simultaneously observed in chunk S02 (the HDO
31,2 –22,1 line at 225.90 GHz was also covered in the USB
5 The Submillimeter Array is a joint project between the Smithsonian Astrophysical Observatory and the Academia Sinica Institute of Astronomy and Astrophysics, and is funded by the Smithsonian Institution and the Academia Sinica.
in chunk S06). Combinations of two array configurations
(compact and extended) were used to obtain projected
baselines ranging from 6 to 180 meters. Cryogenic SIS
receivers on each antenna produced system temperatures
(DSB) of 200-1400 K at 260 GHz and 100–200 K at 210
GHz. Observations of ortho-H2 D+ and H13 CO+ were
simultaneously carried out (in the dual receiver observational mode) on 28 December 2006 using only the compact array configuration. Three out of eight antennas
were equipped with 400 GHz receivers (DSB system temperature between 400 and 800 K) and were available for
observations of the 372.4213 GHz ortho-H2 D+ 11,0 –11,1
line, and all eight antennas were operating with 345 GHz
receivers (DSB system temperature between 150 and 300
K) for observations of the 346.9985 GHz H13 CO+ J=4–3
and 345.796 GHz CO J=3–2 lines. The correlator was
configured with a narrow band of 512 channels over the
104 MHz chunk, which provided 0.2 MHz frequency resolution, or 0.28 km s−1 at 217 GHz, 0.23 km s−1 at 267
GHz and 0.16 km s−1 at 372 GHz. Observations of the
691.6604 GHz para-D2 H+ 11,0 –10,1 line were shared with
observations of the CO J=6–5 line made on 17 February
2005 (details provided in Qi et al. 2006). Calibrations
of the visibility phases and amplitudes were achieved
with interleaved observations of the quasars J1037-295
and J1147-382, typically at intervals of 20-30 minutes.
Observations of Callisto provided the absolute scale for
the calibration of flux densities. The uncertainties in the
flux scale are estimated to be 15%. All of the calibrations were done using the MIR software package 6 , while
continuum and spectral line images were generated and
CLEANed using MIRIAD.
3. SPECTRAL LINE MODELING
Several model approaches have been developed to interpret interferometric molecular line and continuum observations from disks (Dutrey et al. 2007). In brief, the
approach of Qi et al. (2004, 2006) works as follows: the
kinetic temperature and density structure of the disk is
determined by modeling the spectral energy distribution
(SED) assuming well mixed gas and dust, with the results confirmed by the resolved (sub)mm continuum images. Then, a grid of models with a range of disk parameters including the outer radius Rout , the disk inclination i, position angle P.A. and the turbulent line width
vturb are produced and a 2D accelerated Monte Carlo
model (Hogerheijde & van der Tak 2000) is used to calculate the radiative transfer and molecular excitation.
The collisional rates are taken from the Leiden Atomic
and Molecular Database 7 (Schoier et al. 2005) for nonLTE line radiative transfer calculations. Specifically in
the models used in this paper, the rate coefficients for
HCO+ and DCO+ in collisions with H2 have been calculated by Flower (1999); the rate coefficients for HCN
and DCN in collisions with H2 have been scaled from the
rate of HCN-He calculated by Green & Thaddeus (1974).
The model parameters are fitted using a χ2 analysis in
the (u, v) plane.
In the studies by Qi et al. (2004, 2006), the distribution
of CO molecules was assumed to follow the H nuclei as
derived from the dust density structure and a gas of solar
6
7
http://www.cfa.harvard.edu/∼cqi/mircook.html
http://www.strw.leidenuniv.nl/∼moldata
�3
TABLE 1
Observational Parameters for SMA TW Hydrae (detected species)
Rest Frequency (GHz):
Observations
Antennas used
Synthesized beam:
Channel spacing (km s−1 ):
R.M.S.a (Jy beam−1 ):
Peak intensityb (Jy)
a
b
c
HCN 3–2
265.886
2005 Mar 04
2005 Apr 21
2005 April 26
7
1.′′ 6 × 1.′′ 1 PA -0.5◦
0.23
0.35
4.7
HCO+ 3–2
267.558
2005 Mar 04
2005 Apr 21
2005 Apr 26
7
1.′′ 6 × 1.′′ 1 PA -6.3◦
0.23 km
0.29
2.0
H13 CO+ 4- -3
346.999
2006 Dec 28
DCN 3–2c
217.239
2006 Apr 28
DCO+ 3–2
216.113
2006 Apr 28
2006 Feb 03
8
4.′′ 1 × 1.′′ 8 PA 3.3◦
0.70
0.16
0.70
8
5.′′ 9 × 3.′′ 2 PA -1.5◦
0.56
0.10
0.31
8
2.′′ 6 × 1.′′ 6 PA 2.8◦
0.28
0.10
0.56
SNR limited by the dynamic range.
Intensity averaged over the corresponding beam.
Only compact configuration data used for DCN observation.
TABLE 2
Observational Parameters for SMA TW Hydrae (undetected species)
HDO 31,2 –22,1
225.897
2006 April 28
8
5.′′ 7 × 3.′′ 1 PA -0.6◦
0.54
0.11
<2.0 × 10¹⁴
composition. However, molecules in disks do not necessarily share the same distribution as molecular hydrogen.
Theoretical models (e.g. Aikawa et al. 1996; Aikawa &
Nomura 2006) predict so-called three-layered structure;
most molecules are photo-dissociated in the surface layer
of the disk and frozen out in the mid-plane where most
of hydrogen resides, with an abundance that peaks in the
warm molecular layer at intermediate scale heights. To
approximate this more complex behavior, we introduce
new molecular distribution parameters for use in spectral
line modeling.
For first-order analysis in the radial molecular distributions, the column densities are assumed to vary as a
power law as a function of radius:
r
)pi
Σi (r) = Σi (10AU)(
10AU
Here Σi and pi describe column density distribution of
a specific species (i) rather than disk (hydrogen) column
density. In most disk models to date, a single radial
power-law is adopted for fitting the hydrogen or dust surface density. By assuming CO follows the distribution of
hydrogen column density, Qi et al. (2004, 2006) also find
satisfactory power-law fits for multiple CO transtions.
When a single power law is insufficient for fitting the
radial distribution, then a broken power law with two
different indices will be used.
To calculate the surface density at different radii, the
vertical molecular distribution is needed, but this distribution may well vary with distance from the star.
However, theoretical models (Aikawa & Nomura 2006)
indicate that the vertical distribution of molecules at
different radii is similar as a function of the hydrogen
column density measured from the disk surface, Σ21 ≡
ΣH /(1.59 × 1021 cm−2 ), where the denominator is the
conversion factor of the hydrogen column density to Av
for the case of interstellar dust. As indicated by Figure
o-H2 D+ 11,0 –11,1
372.421
2006 Dec 28
3
4.′′ 7 × 3.′′ 8 PA 14.5◦
0.65
1.17
<1.7 × 10¹²
p-D2 H+ 11,0 –10,1
346.999
2005 Feb 17
4
3.′′ 3 × 1.′′ 3 PA 7.5◦
0.35
7.39
<9.0 × 10¹⁴
102
Normalized Fraction
Rest Frequency (GHz):
Observations:
Antenna used:
Synthesized beam:
Channel spacing (km s−1 ):
R.M.S. (Jy beam−1 ):
Nmolecule (1 σ) (cm−2 ):
100
10-2
10-4
10-6
10-8
0.001
σs
0.010
0.100
Σ21
σm
1.000
10.000 100.000
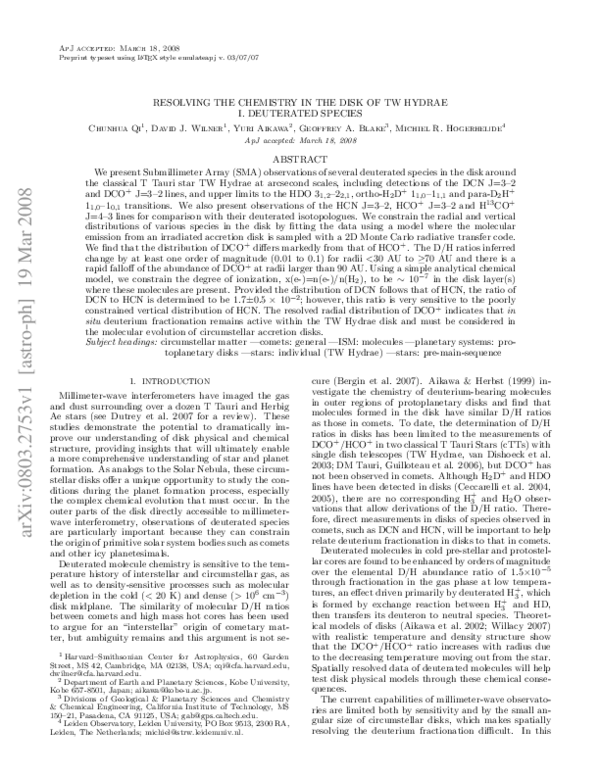
Fig. 1.— This schematic diagram shows an arbitrary molecular
vertical distribution as a function of Σ21 measured from the disk
surface at a certain radius. σm and σs are the midplane and surface
boundary parameters for model fitting (see §3 of the text).
5 of Aikawa & Nomura (2006), the vertical distribution
of molecular abundances shows a good correlation with
Σ21 . Figure 1 shows a schematic diagram of an arbitrary distribution of a molecule in disk where the x-axis
shows Σ21 and the y-axis shows the normalized molecular fraction. Smaller Σ21 values (to the left of the plot)
approach the surface of the disk, while larger Σ21 values
(to the right) approach the midplane of the disk. For
modeling, we make the further simplifying assumption
that gaseous molecules exist with a constant abundance
in layers between σs and σm , the surface and midplane
boundaries of Σ21 , respectively, as indicated in Figure 1
by the shaded area. While the vertical distribution of
molecules in disks may have a more complex distribution than assumed here, the adopted parameters provide
a gross approximation to the vertical location where the
species is most abundant. This is adequate for a first
description, given the quality of the data available. For
�4
4
0.6
HCO+ 3-2
DCO+ 3-2
0.4
Flux (Jy)
Flux (Jy)
3
2
1
0.2
0.0
0
-0.2
-2
0
2
4
Velocity (km/s)
6
6
-2
8
HCN 3-2
2
4
Velocity (km/s)
6
8
DCN 3-2
0.3
4
0.2
Flux (Jy)
Flux (Jy)
0
2
0.1
0.0
0
-0.1
-2
-2
0
2
4
Velocity (km/s)
6
8
-2
0
2
4
Velocity (km/s)
6
8
Fig. 2.— Top: The HCO+ , DCO+ , HCN and DCN J=3–2 spectra at the peak continuum (stellar) position. The fluxes of HCO+ and
DCO+ are averaged over the beam of DCO+ J=3–2 (2.′′ 6 × 1.′′ 6 PA 2.8◦ ). The fluxes of HCN and DCN are averaged over the beam of
DCN J=3–2 (5.′′ 9 × 3.′′ 2 PA -1.5◦ ). The vertical dotted lines indicate the positions of the fitted VLSR for each molecular transition except
for DCN 3-2 where we adopt the VLSR from that of HCN J=3–2. Bottom: Velocity channel maps of the HCO+ , DCO+ , HCN and DCN
J=3–2 emissions toward TW Hydrae. The angular resolutions are 1.′′ 6 × 1.′′ 1 at PA -6.3◦ for HCO+ J=3–2 and 1.′′ 6 × 1.′′ 1 at PA -0.5◦ for
HCN J=3–2. The cross indicates the continuum (stellar) position. The axes are offsets from the pointing center in arcseconds. The 1σ
contour steps are 0.4, 0.12, 0.35 and 0.09 Jy beam−1 for HCO+ , DCO+ , HCN and DCN J=3–2 respectively and the contours start at 2σ.
example, the model of Aikawa & Nomura (2006) shows
two vertical peaks of HCO+ , but the secondary peak is
an order of magnitude smaller, and provides effectively
negligible emission. Also, at least for the nearly face-on
disk of TW Hydrae, the uncertainties in vertical distributions do not affect the derived radial distribution.
This simple model captures the basic characteristics of
three-layered structure predicted by theoretical models.
Using the new distribution parameters: Σi (10AU) and
pi (radial), σs and σm (vertical), the radial and vertical
distributions of the molecules in disks can be constrained
by observation. The best fit model is obtained by mini-
mizing the χ2 , the weighted difference between the real
and imaginary part of the complex visibility measured at
the selected points of the (u, v) plane. The χ2 values are
computed by the simultaneous fitting of channels covering LSR velocities from 1 to 4 km s−1 . Rout and pi are
calculated on grids in steps of 5 (AU) and 0.2, respectively. log (σs ) and log (σm ) are calculated on grids in
steps of 0.2 within the range from −2 to 2. Σi (10AU) and
i are found with each pair of radial and vertical distribution parameters by minimizing χ2 . The systemic velocity
VLSR is fit separately since it is not correlated with those
distribution parameters. For each fit parameter, the 1σ
�5
√
uncertainties are estimated as χ21σ = χ2m + 2n, where
n is the number of degrees of freedom and χ2m is the χ2
value of best-fit model, as in Isella et al. (2007). We
tested values for the turbulent velocity in the range from
0.0 to 0.15 km s−1 and found that exact value does not
have a significant impact, in part because of the coarse
spectral resolution of the data. Therefore, we fixed the
turbulent velocity at an intermediate value, 0.08 km s−1 .
4. RESULTS AND DISCUSSION
40
140
120
30
80
6
10
60
7
0
10 3
40
8
10
20
20
10
109
6
0
20
40
50
Z(AU)
100
7
10 10
8
0
4190
10
30
50
100
150
R(AU)
200
Fig. 3.— The solid and dotted contours show the temperature
and density profiles from the TW Hya model of Calvet et al. (2002).
The blue and red lines confine the locations of HCO+ and HCN in
the model (see text).
Figure 2 shows the spectra of HCO+ , DCO+ , HCN
and DCN at the stellar (peak continuum) position and
their velocity channel maps. Table 3 summarizes the
power-law fitting results on HCO+ , DCO+ and HCN.
The DCN and H13 CO+ lines are too weak for a χ2 analysis of their distribution parameters, and so only the
ratios of DCN/HCN and HCO+ /H13 CO+ are fit. Figure 3 shows the density and temperature contours of the
disk model (adopted from Calvet et al. 2002) and the
locations of HCO+ and HCN derived from the model fitting procedure. Figure 4 shows the radial distribution of
the molecular column densities of the best fit models for
HCO+ , DCO+ and HCN. Not surprisingly, we found that
the radial distributions are better constrained than the
vertical ones: the local minimum of χ2 for different grids
of vertical parameters are within the noise limit, i.e. the
vertical parameters are the least well determined, due in
part to the face-on nature of the TW Hydrae disk. We
therefore treat the best-fit vertical results as fixed, and
investigate the uncertainty of other parameters.
4.1. HCO+ and DCO+
The first detection of DCO+ in the disk around
TW Hydrae was obtained by van Dishoeck et al. (2003)
with the James Clerk Maxwell Telescope (JCMT), who
reported a beam-averaged DCO+ /HCO+ abundance ratio of 0.035. Our spatially resolved observations of the
DCO+ and HCO+ J=3–2 emission from the disk suggest
a more complex chemical situation.
Figure 5 shows the channel maps of HCO+ J=3–2, together with the best-fit model and the data-model residuals. Table 3 lists the best-fit model parameters. The χ2
surface for the radial power index pHCO+ and the outer
radius Rout is shown in the top panel of Figure 6. The
1σ contour confines Rout to 200±10 AU and pHCO+ to
−2.9±0.3. The H13 CO+ J=4–3 line was also detected,
but the emission is not strong enough to constrain its distribution. Assuming that H13 CO+ has the same distribution as HCO+ , then fitting the ratio of HCO+ /H13 CO+
to match the intensity of the H13 CO+ emission indicates
an HCO+ /H13 CO+ ratio of 100±25. This value is consistent with the nominal solar system value of 89. Figure 7
presents the best-fit model spectra of H13 CO+ J=4–3
overlayed on the SMA data.
The vertical distribution of DCO+ is even less well constrained than that of HCO+ , and we choose to adopt the
same values of σs and σm for both HCO+ and DCO+
(as indicated in Table 3). Because of the nearly face-on
viewing geometry for the disk, the fitting of radial distribution power-law index pi is not affected significantly by
the uncertainties in vertical structure, but only the value
of Σi (10AU) needs to be adjusted.
Examination of the channel maps shows upon inspection that the radial distributions of DCO+ and HCO+
are different. To demonstrate how differences in the radial distribution affect the resulting images, Figure 8
presents three models of DCO+ radial distribution and
Figure 9 shows the corresponding simulated channel
maps of the DCO+ J=3–2 line.
Model 1 assumes that the DCO+ distribution follows the best-fit model of HCO+ .
The minimum
χ2 is determined to be 575396 and the corresponding
DCO+ /HCO+ is found to be 4.7 × 10⁻² . Comparing the
simulated maps from Model 1 with the data in Figure 9
shows a distinct difference in that the double peaked nature of the central channel in the data is more obvious
than in this model. The contrast of the contour levels between the central channel and the adjacent channels are
also smaller in the data than in this model. Because the
emission of the central channel mostly originates at large
disk radii, these differences suggest that the DCO+ emission arising from the outer regions of the disk is stronger
than predicted by this model. The slope of radial DCO+
distribution does not decrease as steeply as does HCO+ .
In other words, the D/H ratio must increase with increasing radius.
Model 2 shows the best-fit result for the radial distribution of DCO+ assuming a single power index. As
shown in Figure 4, the radial distribution of DCO+ is
strikingly different from that of HCO+ , with a positive
power index of 2.4 and a smaller but better constrained
Rout 90±5 AU. The contours of the iso-χ2 surface for
DCO+ in the middle panel of Figure 6 indicate that the
uncertainty of the radial power index is very large but
that the index is still larger than 1.6 within the 1σ error, much larger than −2.9 found for HCO+ . The simulated DCO+ channel maps for Model 2 shown in Figure 9
are an improvement over Model 1 in matching the data.
However in this model, Rout (∼ 90 AU) is much smaller
than the disk radius observed with HCO+ and CO (∼
200 AU) and DCO+ increases with radius but then disappears sharply at Rout ∼90 AU, as a step function, which
is hard to understand. Comparison with the data shows
that there are fewer complete contours around the double peaks in the central channel, which suggests that the
DCO+ emission is maximum at an intermediate radius
�6
1014
1.000
DCN/HCN=1.7±0.5×10-2
[DCO+]/[HCO+]
Column Density [cm-2]
HCO+/H13CO+=100±25
1013
0.100
[HCO+]
[HCN]/10
1012
0.010
[DCO+]
[DCO+]/[HCO+]
1011
10
0.001
100
R [AU]
Fig. 4.— Radial distribution of molecular column densities and DCO+ /HCO+ ratio for the best-fit models for TW Hydrae. Solid lines
depict single power-law fits, while the dashed lines are for DCO+ Model 3 where two power-law indices are used.
TABLE 3
Fitting results
Parameters
Stellar Mass: M∗ (M⊙ )
Inclination: i(deg)
Systemic velocity: VLSR (km s−1 )
Position angle: P.A.(deg)
Turbulent line width: vturb (km s−1 )
Outer radius: Rout (AU)
Column Density at 10AU: Σ(10AU) (cm−2 )
Radial power index: p
Vertical Parameters: σs ,σm
Minimum χ2 :
Reduced χ2 : χ2r
a DCO+ Model 2.
b DCO+ Model 3, no error estimation.
c DCO+ turning point at radius 70 AU.
HCO+
0.6
6.8±0.3
2.88±0.05
-27.4
0.08
200 ± 10
3.8 ±0.5 × 10¹⁵
-2.9 ± 0.3
0.1, 10
329588
1.21
rather than at the edge.
For Model 3, instead of using a single power index (p)
to fit for the radial distribution of DCO+ column density
N(DCO+ ), the fit uses two power indices (p1 and p2) and
a turning point (Rt ) where the power law index changes
from p1 to p2, i.e. the location of the peak of N(DCO+ ).
The parameters p1, p2 and Rt are searched within limited grids to minimize χ2 . In this model, N(DCO+ ) is
found to increase with radius out to ∼ 70 AU, and then
to decrease. Table 3 presents the best-fit parameters;
no error estimation is provided due to the computation
difficulties. Figure 9 shows the best-fit model images.
Comparison of Model 3 with the data shows a visual improvement over Model 2 in the central channel, although
the χ2 value of the two models are not distinguishable.
We thus cannot clearly discriminate with the χ2 statistic
if there is indeed a peak with radius for N(DCO+ ) as
DCO+a
0.6
7.4±0.6
2.94±0.06
-27.4
0.08
90 ± 5
1.9±0.2 × 10¹⁰
2.4 ± 0.8
0.1, 10
575347
1.95
DCO+b
0.6
7.4
2.9 4
-27.4
0.08
160
4.8 × 10⁶
7,-6 c
0.1,10
575347
1.95
HCN
0.6
6.6±0.8
2.73±0.06
-27.4
0.08
100 ± 10
2.4±0.4 × 10¹⁴
-1.0 ± 1.2
0.3, 30
297198
1.35
in Model 3, or if DCO+ increases with radius and disappears suddenly around 90 AU as in Model 2. Even
with this ambiguity, however, both models imply that
the D/H ratios change by at least an order of magnitude (0.01 to 0.1) from radii <30 AU to >70 AU and
that there is a rapid falloff of N(DCO+ ) at radii larger
than 90 AU. Because the emission in the central channel
comes from the outer part of the disk (Keplerian rotation) projected along the line-of-sight with a very small
inclination of around 7 degrees for TW Hydrae, the central velocity channel is most important for constraining
the radial distribution. Based on the difference in the
central velocity channel map between the models, we believe Model 3 is the more plausible description of the
radial distribution of DCO+ . Figure 10 shows the channel maps of the DCO+ J=3–2 emission, together with
those of Model 3 and the data-model residuals.
�7
Fig. 5.— Top: Velocity channel maps of the HCO+ J=3–2 emission toward TW Hydrae. The angular resolution is 1.′′ 6 × 1.′′ 1 at PA
-6.3◦ . The cross indicates the continuum (stellar) position. The axes are offsets from the pointing center in arcseconds. The 1σ contour
step is 0.4 Jy beam−1 and the contours start at 2σ. Middle: channel map of the best-fit model with the same contour levels. Bottom:
difference between the best-fit model and data on the same contour scale.
Observations of deuterated molecular ions and the level
of deuterium fractionation have been used to estimate the
ionization degree in molecular clouds, and a similar analysis can be applied to circumstellar disks. If we consider
only the ionization balance determined by HCO+ , H+
3,
DCO+ and electrons in steady state as shown in Equation 14 of Caselli (2002), the electron fractional abundance can be derived to be around 10−7 . Of course,
this value is only valid in the intermediate layer where
HCO+ is abundant and multiply deuterated H+
3 is less
abundant than HCO+ . Several important complications
are also neglected in this analysis, including the presence
of other atomic and molecular ions, neutral species besides CO which destroy H2 D+ , and negatively charged
dust grains and refractory metals. Still, accurate measurements of DCO+ and HCO+ are the first steps toward
an understanding of the ionization fraction in the disk.
The increase of D/H ratios from inner to outer disk is
generally consistent with the current theoretical models
of the gas-deuterium fractionation processes that consider the effect of cold temperature. But the quick disappearance of DCO+ at radii beyond 90 AU (comparing
with Rout around 200 AU for CO and HCO+ ) is puzzling,
since DCO+ is expected to be abundant and observable
in the cold outer region of the disk where HCO+ is still
available. More theoretical work is needed to explain the
disappearance of DCO+ in the outer part of the disk.
4.2. HCN and DCN
Figure 11 shows the HCN J=3–2 channel maps, together with the best fit model and residuals. Table 3
lists the best-fit model parameters, and Figure 4 shows
the radial distribution of column density derived. The
χ2 surface shown in the bottom panel of Figure 6 indicates Rout 100±10 AU and pHCN −1.0±1.2. The radial
power index is poorly constrained probably due to more
complex distributions for HCN. A detailed comparison
of the molecular distributions of HCN and CN will be
presented elsewhere.
Although the best fit vertical parameters seem to indicate that HCN (σm,HCN = 30) is found much deeper
toward the midplane than is HCO+ (σm,HCO+ = 10), we
emphasize that we are not able to accurately constrain
the vertical distributions from the present data. This ambiguity strongly affects the column density of HCN (i.e.
ΣHCN (10AU)) needed to fit the data (not the power index pHCN of radial distribution). A worse fit to the data
(χ2 larger by 3σ over the best-fit model) can be obtained
by assuming that the vertical distributions of HCN and
HCO+ are the same, but the HCN column density is 1.5
times larger than that needed for the best fit model due
to higher density near the midplane.
The DCN J=3–2 transition is detected at a signal-tonoise ratio of 3 near the fitted HCN VLSR of 2.73 km s−1
(Figure 2). While this signal-to-noise ratio is not high,
the significance of the detection is further supported by
the channel maps (Figure 12 upper panel) where the velocity gradient along the disk position angle of ∼ −30◦
is consistent with that seen in CO J=2–1 and J=3–2 (Qi
et al. 2004) and the other molecular lines presented in
this paper. Since the DCN 3–2 emission is weak, we
are not able to fit for the molecular distribution and so
make the simplifying assumption that the distribution of
DCN follows that of HCN. As with H13 CO+ , we fit the
DCN/HCN ratio over the whole disk and determine the
DCN/HCN ratio to be 1.7±0.5 × 10⁻² . To again empha-
�8
-2.0
H13CO+ 4-3
0.6
HCO
-2.5
0.4
Flux (Jy)
Radial Power Index
+
-3.0
-3.5
0.0
-4.0
-0.2
150
200
250
Outer Radius (AU)
300
-5
DCO+
2
5
Velocity (km/s)
10
1013
1
0
-1
70
80
90
100
110
Outer Radius (AU)
120
Model 2
1012
1011
Model 1
Model 3
1010
109
2
HCN
1
100
R [AU]
Fig. 8.— Models of DCO+ with different distributions of radial
column densities.
0
-1
-2
-3
70
Column Density [cm-2]
Radial Power Index
0
Fig. 7.— The beam-averaged H13 CO+ J=4–3 spectra at the
continuum (ste llar) position. The SMA data are presented by the
solid histogram, and the simulated model by the dashed histogram.
The vertical dotted line indicates the position of the fitted VLSR
for HCO+ J=3–2.
3
Radial Power Index
0.2
80
90 100 110 120 130 140
Outer Radius (AU)
Fig. 6.— Iso-χ2 surfaces of (Rout ,pi ) for HCO+ , DCO+ (as in
Model 2) and HCN. Contours correspond to the 1 to 6 σ errors. For
DCO+ , the index values larger than 3 at around 90 AU indicate
the ratios of DCO+ /HCO+ larger than 1, so the χ2 surface is not
calculated beyond that.
size the impact of the assumed vertical distribution on
the derived column densities, the DCN/HCN ratio could
be as high as 5 × 10⁻² if HCN and DCN are distributed
vertically over the same region as is HCO+ .
Highly fractionated DCN/HCN ratios have been measured in comets. In the coma of comet Hale-Bopp, for example, Meier et al. (1998) reported the ratio to be around
2.3 × 10⁻³ , but higher DCN/HCN ratios – (D/H)HCN,jet
≈0.025 are detected from the pristine material sublimed
from icy grains ejected in jets from the nucleus which
may present a more representative sampling of cometary
ices that have not experienced significant thermal processing (Blake et al. 1999). Such ratios are consistent
with those found here in the TW Hydrae disk, indicating that high D/H ratios in comets could originate from
material in the outer regions of disks where in situ deuterium fractionation is ongoing, rather than requiring an
inheritance from interstellar material.
4.3. Upper limits for H2 D+ , D2 H+ and HDO
In the disk midplane, H2 is expected to be gaseous
and the molecular ion formed by the cosmic ray ionization of H2 , H+
3 , is expected to be the most abundant
ion. Unfortunately, H+
3 is only detectable in cold gas
via infrared absorption. In its deuterated forms, however, H2 D+ and even D2 H+ are expected to be abundant in the cold, dense gas (Ceccarelli & Dominik 2005).
The ground-state transition of ortho-H2 D+ was first detected in a young stellar object (NGC 1333 IRAS 4A)
�9
Fig. 9.— DCO+ J=3–2 channel maps toward TW Hydrae and the simulated model distributions depicted in Figure 8.
by Stark et al. (1999) and in a prestellar core (L1544)
by Caselli et al. (2003). Both H2 D+ and D2 H+ have
been detected toward another pre-stellar core 16293E via
their ground-state submm rotational lines (Vastel et al.
2004). The inclusion of multiply deuterated H+
3 in chemical models leads to predictions of higher values of the
D/H ratio in cold, high-density regions of the interstellar
medium. Similarly, in the dense, cold disk midplane, CO
is depleted, and high abundances of H2 D+ and D2 H+
are expected. For this reason, Ceccarelli et al. (2004)
searched for the ground-state transition of ortho-H2 D+
with the Caltech Submillimeter Observatory (CSO), and
reported 3.2σ and 4.7σ detections toward TW Hydrae
and DM Tauri, respectively. With the 400 GHz and 690
GHz receiver-equipped SMA antennas, we searched for
the 372 GHz ortho-H2 D+ 11,1 –11,0 and 690 GHz paraD2 H+ 110 –101 lines toward TW Hydrae. No significant
emission signals were detected. Here we discuss the upper limits and their implications.
Our 3-antenna SMA observations give a 1σ upper
limit for the ortho-H2 D+ 11,1 –11,0 line emission of 1.2
Jy beam−1 km s−1 with a 4.′′ 7 × 3.′′ 8 synthesized beam.
To compare the result with single dish data, the extent
of the source emission must be known. Since H2 D+ was
observed along with the H13 CO+ 4–3 line in a dualreceiver observation on 28 December 2006 and H13 CO+
4–3 has been clearly detected at JCMT (van Dishoeck
et al. 2003), we can compare the intensities of these two
lines between the SMA data and the single dish observations to constrain the emitting areas. The H13 CO+ 4–3
line was detected at JCMT with an integrated intensity
of 0.07 K km s−1 in a 13′′ beam (van Dishoeck et al.
2003); while for the SMA the integrated intensity of this
line is determined to be 0.61 Jy beam−1 km s−1 with
a beam of 4.′′ 1 × 1.′′ 8. If the extent of the emission of
H13 CO+ is similar to that of H2 D+ , our interferometric
upper limit of Jy beam−1 km s−1 for H2 D+ (considering the small change of the beam sizes) becomes 0.09
K km s−1 (1σ) or 0.27 K km s−1 (3 σ) upper limits,
which is consistent with 2σ upper limits of about 0.2
K km s−1 by the JCMT (Thi et al. 2004) but slightly
lower than the 3.2σ detection of 0.39 K km s−1 by Ceccarelli et al. (2004). We estimate the 1σ upper limit of
the ortho-H2 D+ column density to be 1.7 × 1012 cm−2
according to the Equation 4 of Vastel et al. (2004), which
is slightly less than the 2σ upper limit estimate of 4.4 ×
1012 cm−2 by Thi et al. (2004) since the SMA data had
a smaller noise level. Of course this analysis assumes the
extent of H2 D+ is similar to that of H13 CO+ . With the
deployment of more 400 GHz receivers on the SMA and
further H2 D+ observations, it should be possible to provide rather better constraints on the H2 D+ abundance
�10
Fig. 10.— Top: Velocity channel map of the DCO+ J=3–2 toward TW Hydrae. The angular resolution is 2.′′ 6 × 1.′′ 6 at PA 2.8◦ . The
cross indicates the continuum (stellar) position. The axes are offsets from the pointing center in arcseconds. The 1σ contour step is 0.12 Jy
beam−1 and the contours start at 2σ. Middle: channel map of Model 3 with the same contour levels. Bottom: difference between Model
3 and data on the same contour scale.
Fig. 11.— Top: Velocity channel map of the HCN J=3–2 toward TW Hydrae. The angular resolution is 1.′′ 6 × 1.′′ 1 at PA -0.5◦ . The
cross indicates the continuum (stellar) position. The axes are offsets from the pointing center in arcseconds. The 1σ contour step is 0.35
Jy beam−1 and the contours start at 2σ. Middle: channel map of the best-fit model with the same contour levels. Bottom: difference
between the best-fit model and data on the same contour scale.
�11
0.3
DCN 3-2
Flux (Jy)
0.2
0.1
0.0
-0.1
-0.2
-5
0
5
Velocity (km/s)
10
Fig. 12.— Top left: DCN J=3–2 velocity channel maps (red: 2.84 km s−1 , blue: 2.28 km s−1 ) from TW Hydrae, overlaid on the 217
GHz dust continuum map (gray scale). The cross indicates the position of the continuum peak. Top right: the simulated model for DCN
J=3–2. The 1σ contour step is 0.09 Jy beam−1 and the contours start with 2σ. Bottom: the beam-averaged DCN 3–2 spectra at the
continuum (stellar) position. The SMA data are presented by the solid histogram, and the simulated model by the dashed histogram. The
vertical dotted line indicates the position of the fitted VLSR for HCN J=3–2.
�12
in the disk.
We estimate the 1σ upper limit for para-D2 H+ 110 –101
to be 5.35 Jy beam−1 km s−1 with a beam of 3.′′ 3 × 1.′′ 3.
The 1σ upper limit to the para-D2 H+ column density is
estimated to be 9.0 × 1014 cm−2 . This is less constrained
than H2 D+ due to the relatively poor system sensitivity
at 690 GHz.
For HDO 31,2 –22,1 , the 1σ upper limit is 0.10
Jy beam−1 km s−1 . Assuming an excitation temperature
of 30 K, the upper limit for the HDO column density is
2.0 × 1014 cm−2 . Since the lower state energy level of
this line is nearly 160 K, it must originate from warm
regions of the disk which are quite distinct from the cold
layers where HDO ground state transition absorption, as
found in DM Tauri (Ceccarelli et al. 2005), must arise –
although we note that the detection of the HDO absorption line in DM Tauri has been disputed by Guilloteau
et al. (2006).
5. SUMMARY AND CONCLUSIONS
Observations of deuterated species in circumstellar
disks are important to understand the origin of primitive
solar system bodies in that they can directly constrain
the deuterium fractionation in the outer regions where
cometary ices are likely formed. Spatially resolved observations of the D/H ratios in disks enable the comparison
of the fractionation measured in comets such as HaleBopp (Blake et al. 1999) with the specific conditions at
each disk radius. We have presented the first images
of DCO+ and DCN emission from the disk around a
classical T Tauri star, TW Hydrae, along with images
of the HCN and HCO+ J=3–2 lines. The observations
of deuterium fractionation serve as a clear measure of
the importance of low-temperature gas-phase deuterium
fractionation processes. These observations strongly support the proposed link among high gas densities, cold
temperature and enhanced deuterium fractionation. De-
tailed chemical models are still needed to explain how
DCO+ disappears from the outer part of the disk.
The similarity of the D/H ratios in cold clouds, disks
and pristine cometary material has been used to argue
that the gas spends most of its lifetime at low temperatures and is incorporated into the disks before the envelope is heated, i.e. before the Class I stage. By combining
self-consistent physical models and 2D radiative transfer
codes to interpret high spatial resolution millimeter-wave
molecular images, we are only now beginning to investigate the radial and vertical distributions of molecules in
disks. The radial distribution of DCO+ in the disk of
TW Hydrae indicates that in situ deuterium fractionation is ongoing. The molecular evolution within disks
must therefore be considered in the investigation of the
origin of primitive solar system bodies.
We have obtained less stringent constraints on the vertical distributions of molecules in the disk of TW Hydrae.
To address the ambiguity present in the analysis of single
objects, data from a robust sample of disks is needed, in
particular one that covers a range of disk inclinations.
More sensitive observations are also needed for the rare
isotopologues H13 CN, H13 CO+ and, of course, DCN, to
understand the radial and vertical gradient of deuterated
species in these disks. In the future, observations of DCN
and other species with the Atacama Large Millimeter Array will provide further insight into the chemical state of
protoplanetary disks.
Partial support for this work comes from NASA Origins of Solar Systems Grant NNG05GI81G. M.R.H is
supported by a VIDI grant from the Netherlands Organization for Scientific Research. C.Q. acknowledges Paola
Caselli for her help and useful suggestions. We thank the
referee for very useful comments.
REFERENCES
Aikawa, Y. & Herbst, E. 1999, ApJ, 526, 314
Aikawa, Y., Miyama, S. M., Nakano, T., & Umebayashi, T. 1996,
ApJ, 467, 684
Aikawa, Y. & Nomura, H. 2006, ApJ, 642, 1152
Aikawa, Y., van Zadelhoff, G. J., van Dishoeck, E. F., & Herbst,
E. 2002, A&A, 386, 622
Beckwith, S. V. W. & Sargent, A. I. 1993, ApJ, 402, 280
Bergin, E. A., Aikawa, Y., Blake, G. A., & van Dishoeck, E. F.
2007, in Protostars and Planets V, ed. B. Reipurth, D. Jewitt,
& K. Keil, 751–766
Blake, G. A., Qi, C., Hogerheijde, M. R., Gurwell, M. A., &
Muhleman, D. O. 1999, Nature, 398, 213
Calvet, N., D’Alessio, P., Hartmann, L., Wilner, D., Walsh, A., &
Sitko, M. 2002, ApJ, 568, 1008
Caselli, P. 2002, Planet. Space Sci., 50, 1133
Caselli, P., van der Tak, F. F. S., Ceccarelli, C., & Bacmann, A.
2003, A&A, 403, L37
Ceccarelli, C. & Dominik, C. 2005, A&A, 440, 583
Ceccarelli, C., Dominik, C., Caux, E., Lefloch, B., & Caselli, P.
2005, ApJ, 631, L81
Ceccarelli, C., Dominik, C., Lefloch, B., Caselli, P., & Caux, E.
2004, ApJ, 607, L51
Dutrey, A., Guilloteau, S., & Ho, P. 2007, in Protostars and Planets
V, ed. B. Reipurth, D. Jewitt, & K. Keil, 495–506
Flower, D. R. 1999, MNRAS, 305, 651
Green, S., & Thaddeus, P. 1974, ApJ, 191, 653
Guilloteau, S., Piétu, V., Dutrey, A., & Guélin, M. 2006, A&A,
448, L5
Ho, P. T. P., Moran, J. M., & Lo, K. Y. 2004, ApJ, 616, L1
Hogerheijde, M. R. & van der Tak, F. F. S. 2000, A&A, 362, 697
Isella, A., Testi, L., Natta, A., Neri, R., Wilner, D., & Qi, C. 2007,
A&A, 469, 213
Meier, R., Owen, T. C., Jewitt, D. C., Matthews, H. E., Senay,
M., Biver, N., Bockelee-Morvan, D., Crovisier, J., & Gautier, D.
1998, Science, 279, 1707
Qi, C., Ho, P. T. P., Wilner, D. J., Takakuwa, S., Hirano, N.,
Ohashi, N., Bourke, T. L., Zhang, Q., Blake, G. A., Hogerheijde,
M., Saito, M., Choi, M., & Yang, J. 2004, ApJ, 616, L11
Qi, C., Wilner, D. J., Calvet, N., Bourke, T. L., Blake, G. A.,
Hogerheijde, M. R., Ho, P. T. P., & Bergin, E. 2006, ApJ, 636,
L157
Schöier, F. L., van der Tak, F. F. S., van Dishoeck, E. F., & Black,
J. H. 2005, A&A, 432, 369
Setiawan, J., Henning, T., Launhardt, R., Müller, A., Weise, P., &
M., K. 2008, Nature, 451, 38
Stark, R., van der Tak, F. F. S., & van Dishoeck, E. F. 1999, ApJ,
521, L67
Thi, W.-F., van Zadelhoff, G.-J., & van Dishoeck, E. F. 2004, A&A,
425, 955
van Dishoeck, E. F., Thi, W.-F., & van Zadelhoff, G.-J. 2003, A&A,
400, L1
Vastel, C., Phillips, T. G., & Yoshida, H. 2004, ApJ, 606, L127
Willacy, K. 2007, ApJ, 660, 441
�
 Geoffrey Blake