Mayr et al. BMC Pediatrics
(2020) 20:174
https://doi.org/10.1186/s12887-020-02069-x
RESEARCH ARTICLE
Open Access
Multidisciplinary lifestyle intervention in
children and adolescents - results of the
project GRIT (Growth, Resilience, Insights,
Thrive) pilot study
Hannah L. Mayr1,2,3*, Felicity Cohen2, Elizabeth Isenring1, Stijn Soenen4,5, Project GRIT Team2,6 and Skye Marshall1,7
Abstract
Background: During childhood and adolescence leading behavioural risk factors for the development of
cardiometabolic diseases include poor diet quality and sedentary lifestyle. The aim of this study was to determine
the feasibility and effect of a real-world group-based multidisciplinary intervention on cardiorespiratory fitness, diet
quality and self-concept in sedentary children and adolescents aged 9 to 15 years.
Methods: Project GRIT (Growth, Resilience, Insights, Thrive) was a pilot single-arm intervention study. The 12-week
intervention involved up to three outdoor High Intensity Interval Training (HIIT) running sessions per week, five
healthy eating education or cooking demonstration sessions, and one mindful eating and Emotional Freedom
Technique psychology session. Outcome measures at baseline and 12-week follow-up included maximal graded
cardiorespiratory testing, the Australian Child and Adolescent Eating Survey, and Piers-Harris 2 children’s selfconcept scale. Paired samples t-test or Wilcoxon signed-rank test were used to compare baseline and follow-up
outcome measures in study completers only.
Results: Of the 38 recruited participants (median age 11.4 years, 53% male), 24 (63%) completed the 12-week
intervention. Dropouts had significantly higher diet quality at baseline than completers. Completers attended a median
58 (IQR 55–75) % of the 33 exercise sessions, 60 (IQR 40–95) % of the dietary sessions, and 42% attended the
psychology session. No serious adverse events were reported. Absolute VO2peak at 12 weeks changed by 96.2 ± 239.4
mL/min (p = 0.06). As a percentage contribution to energy intake, participants increased their intake of healthy core
foods by 6.0 ± 11.1% (p = 0.02) and reduced median intake of confectionary (− 2.0 [IQR 0.0–3.0] %, p = 0.003) and baked
products (− 1.0 [IQR 0.0–5.0] %, p = 0.02). Participants significantly improved self-concept with an increase in average TScore for the total scale by 2.8 ± 5.3 (p = 0.02) and the ‘physical appearance and attributes’ domain scale by median 4.0
[IQR 0.5–4.0] (p = 0.02).
(Continued on next page)
* Correspondence: hmayr@bond.edu.au
1
Bond University Nutrition and Dietetics Research Group, Faculty of Health
Sciences and Medicine, Bond University, Gold Coast, Queensland, Australia
2
Weight Loss Solutions Australia, Gold Coast, Queensland, Australia
Full list of author information is available at the end of the article
© The Author(s). 2020 Open Access This article is licensed under a Creative Commons Attribution 4.0 International License,
which permits use, sharing, adaptation, distribution and reproduction in any medium or format, as long as you give
appropriate credit to the original author(s) and the source, provide a link to the Creative Commons licence, and indicate if
changes were made. The images or other third party material in this article are included in the article's Creative Commons
licence, unless indicated otherwise in a credit line to the material. If material is not included in the article's Creative Commons
licence and your intended use is not permitted by statutory regulation or exceeds the permitted use, you will need to obtain
permission directly from the copyright holder. To view a copy of this licence, visit http://creativecommons.org/licenses/by/4.0/.
The Creative Commons Public Domain Dedication waiver (http://creativecommons.org/publicdomain/zero/1.0/) applies to the
data made available in this article, unless otherwise stated in a credit line to the data.
Mayr et al. BMC Pediatrics
Page 2 of 16
(2020) 20:174
(Continued from previous page)
Conclusions: The 12-week group-based multidisciplinary lifestyle intervention for children and adolescents improved
diet quality and self-concept in study completers. Future practice and research should focus on providing sustainable
multidisciplinary lifestyle interventions for children and adolescents aiming to improve long-term health and wellbeing.
Trial registration: ANZCTR, ACTRN12618001249246. Registered 24 July 2019 - Retrospectively registered
Keywords: Exercise, Physical activity, Diet quality, Self-concept, Children, Adolescents, Lifestyle intervention,
Multidisciplinary
Background
The increasing prevalence of cardiometabolic risk factors, such as obesity, dyslipidaemia, elevated blood pressure, hyperglycaemia and poor cardiorespiratory fitness
during childhood and adolescence adversely affects development, growth, maturation, mental health and quality of life [1–4]. Furthermore, the development of risk
factors in childhood significantly increases the likelihood
of developing cardiometabolic disease in adulthood and
has adverse consequences on premature mortality and
physical morbidity [5–7]. The prevention of developing
cardiometabolic disease risk factors in childhood is a
recognised global priority [4, 8].
During childhood and adolescence, leading behavioural risk factors for the development of cardiometabolic disease include poor diet quality and sedentary
lifestyles [9–11]. Recent national survey data in Australian children and adolescents (aged 2 to 18 years) found
that intake of discretionary foods contributed to 40% of
overall dietary energy intake; where close to threequarters of the sample exceeded recommend intakes for
free sugars and less than 1% met recommended intakes
of vegetables [12]. In addition, national recommendations for engagement in physical activity were met by
only 30% of these children and adolescents [13].
Lifestyle interventions appropriate for children and adolescents are an important mechanism for improving dietary
and/or physical activity habits. Studies of multi-disciplinary
interventions in children and adolescents involving both
dietary education and physical activity sessions have demonstrated improvements in cardiometabolic outcomes
(low-density lipoprotein, triglycerides, fasting insulin, and
blood pressure) [14]. Evidence suggests that combined diet
and exercise interventions in children and adolescents have
greater effects on measures of metabolic health and obesity
prevention than single interventions [15, 16].
Previous trials of lifestyle interventions have largely focused on weight management for overweight or obese children and adolescents or prevention of weight gain [17, 18].
However, recent evidence argues the importance of improving cardiovascular health rather than weight in children and adolescents and focussing on promoting a
healthy body rather than a slim body [18]. The psychosocial impacts of interventions are also important to
consider as self-esteem in childhood may remain stable
into adulthood [19]. A recent review of interventions which
measured self-esteem changes in children following participation in weight management programs recommended
limiting emphasis on weight status change, including parental involvement, and conducting the intervention in a
group setting to provide a positive social experience [20].
Self-esteem in children and adolescents may be measured
by self-concept scales, which incorporate multiple constructs (e.g. academic, physical, social and behavioural) and
are a useful method for elucidating the effect of lifestyle interventions on both global self-esteem as well as its unique
dimensions [20].
Healthy eating interventions in schools have demonstrated that experiential learning approaches, such as
community gardens, cooking demonstrations, or food
preparation activities, were associated with the largest
impact on improved diet quality and nutritional knowledge [21]. In addition, a recent review determined that
evaluation of lifestyle programs for children and adolescents in non-institutional (e.g. outside of hospital or
schools) settings are needed [14, 17].
To meet these needs, Project GRIT (Growth, Resilience, Insights, Thrive), a multidisciplinary lifestyle intervention for sedentary children and adolescents, was
developed. Project GRIT involved group exercise training, dietary education, and a psychology session in a
non-institutional setting on the Gold Coast, Australia.
The aim of this study was to determine the feasibility
and effect of Project GRIT on cardiorespiratory fitness,
nutrient intake, diet quality and self-concept in sedentary children and adolescents aged 9 to 15 years.
Methods
Study design
Project GRIT (Growth, Resilience, Insights, Thrive) was a
pilot single-arm intervention study (Australia and New
Zealand Clinical Trials Registry: ACTRN12618001249246)
reported according to the template for intervention description and replication (TIDieR) checklist [22]. Project
GRIT was a 12-week multidisciplinary intervention which
aimed “to build skills, knowledge and behaviour to help
kids lead healthy and happy lives”, with no cost associated
with participation. The intervention involved weekly
Mayr et al. BMC Pediatrics
Page 3 of 16
(2020) 20:174
group-based High Intensity Interval Training (HIIT) sessions, five healthy eating or cooking demonstration education sessions, and one mindfulness and Emotional
Freedom Technique (EFT) psychology session. The study
site was a private medical centre in the metropolitan location of Gold Coast, Queensland, Australia; where the
intervention was delivered both onsite (diet and psychology sessions) and offsite (exercise sessions and one
cooking demonstration) at a publicly accessible outdoor
recreational park and commercial kitchen, respectively.
The study was conducted in accordance with the Declaration of Helsinki [23]. All procedures involving participants were approved by the Human Research Ethics
Committee of Bond University (SM02967), with written
informed consent obtained from all enrolled participants,
a parent/guardian, and the participant’s usual General
Practitioner prior to participation. If the participant reported a medical illness during the study which could impact their appropriateness for continued involvement in
the exercise training, the participant was required to reconsult their General Practitioner for re-consent regarding
exercise participation. If re-consent by the General Practitioner was not obtained, participants could continue in
the non-exercise related activities only.
Participants
Participants for this study were recruited by the Project
GRIT coordinator between May and July 2018. The eligibility criteria are listed in Table 1. As this study represented a preliminary analysis in a pilot cohort, a sample
size calculation was not performed [24]. Instead, the target sample size was 50 children, which was chosen to reflect resources of the study site and recruitment
feasibility. Recruitment methods included: online and social media advertising, newspaper advertising, newsletters distributed to site stakeholders, communication
with approximately 70 local General Practitioner medical
centres, and broadcasting through a local television news
program. The recruitment advertising targeted both children and parents/guardians living across the city of Gold
Coast council area. All advertising directed potential
participants to the Project GRIT website which asked for
their contact details to register their interest, which was
followed up by the Project GRIT coordinator to discuss
the program and conduct initial eligibility screening.
Age, sex and sibling involvement of potential participants were collected from the parent/guardian at screening. The next phase of recruitment of potentially eligible
participants was to attend a group information session
at the study site, where informed consent was obtained
in addition to agreement to a Project GRIT Code of Behaviour and Conduct, and an indemnity form. All participants and their parent/guardians were given an
opportunity to consider participation and ask further
questions.
GRIT intervention
Following screening and attainment of necessary study
approvals, each recruited participant was provided with
a GRIT t-shirt, visor, and drink bottle. Participants were
also provided with a Polar A300 heart rate and activity
monitor watch and Polar H7 heart rate sensor chest
strap (Polar Electro Oy, Kempele, Finland), which were
required to be returned at the close of the project. Participating children and their parents/guardians, Project
GRIT staff, and research personnel were not blinded to
the purpose of the intervention or data collection measures as the program was intended to be delivered in a
usual clinic setting. Attendance was recorded at all intervention sessions. A summary of the scheduling of intervention components across the weeks of the program is
provided in Table 2.
Table 1 Project GRIT Participant Eligibility Criteria
Inclusion Criteria
Exclusion Criteria
• Aged 9–15 years.
• Known diagnosis of learning disorder and/or medical condition with
• Inactive (self-reported as inactive; no specific criteria applied).
which the multidisciplinary Project GRIT staff cannot provide sufficient
• Participant and parent or guardian able to support lifestyle changes
support for, including: Attention Deficit Hyperactivity Disorder, Autism,
and commit to a 12-week program between July – October 2018 with Asperger Syndrome, Tourette Syndrome, or Bipolar Disorder.
an intention of ≥80% attendance of all Project GRIT sessions.
• Known diagnosis of a medical condition which contraindicates highintensity exercise, including:
o Hypertension as defined by systolic and/or diastolic blood pressure ≥
95th percentile measured upon three or more occasions
o History or evidence of cardiac abnormalities or family history of
hypertrophic obstructive cardiomyopathy
o Hypercholesterolaemia
o Chronic disease including but not limited to kidney disease, chronic
asthma, diabetes (type I or II)
o Orthopaedic or neurological disorder which limits physical activity
o Pulmonary disease
• Current smoker
• Use of steroid medications
• Food allergy which would prevent the child from involvement in healthy
eating or cooking demonstration sessions
Mayr et al. BMC Pediatrics
Page 4 of 16
(2020) 20:174
Table 2 Schedule of the GRIT Intervention Components
Week of program
HIIT Exercise
Diet
Psychology
Number of sessions offered
1
3
1
2
3
3
3
4
3
5
3
1
6
3
1
7
2
8
3
9
2
10
2
11
3
12
3
1
1
1
HIIT high intensity interval training
Exercise sessions
Research trials have demonstrated that HITT improves
cardiorespiratory fitness and cardiometabolic risk
markers in children with similar effects to Moderate Intensity Continuous Training (MICT), however, it is more
time-efficient [25, 26]. Furthermore, in adults, running
using HITT was perceived to be more enjoyable than
MICT [27]. A HIIT model was therefore chosen for the
exercise sessions in GRIT. The program involved three
group sessions of HIIT per week, which each lasted for
approximately 30-min and were offered on Mondays,
Thursdays and Saturdays. The HIIT sessions were conducted at a local outdoor recreation park (approximately
3 km travel from the medical centre offices). The sessions were implemented by a qualified Athletics Coach
and Physical Education Teacher with assistance from an
additional supervisor. Parent/guardians attended and supervised each HIIT session which their child attended.
The HIIT component involved intermittent fast running
(which aimed for ≥85% of estimated maximum heart rate
[HRmax]) for short periods followed by long active recovery periods where the participants were walking or lightly
jogging. No exercise equipment was used. Each exercise
session also began with a slow run warm up followed by a
gentle supervised stretch and finished with an easy 200 m
walk. The following interval sets, based on a percentage
HRmax, were used in the HIIT sessions, with a gradual
progression through the 12-weeks:
15-s high intensity activity at ≥85% HRmax with
2.45-min recovery at 50–70% HRmax.
30-s high intensity activity at ≥85% HRmax with
4.30-min recovery at 50–70% HRmax.
1-min high intensity activity at ≥85% HRmax with
5-min recovery at 50–70% HRmax.
This active recovery zone has been utilised in other
HIIT based training protocols in children [28]. For the
purpose of determining each participant’s HR recovery
zone, HRmax was calculated via a validated age-based
equation [29]. From week 2 onwards, all participants
were provided weekly make-up session protocols which
mirrored what was being done in the group sessions, via
email. These were intended for the child to complete in
their own time under the supervision of a parent/guardian if they were unable to make a group training session.
Heart rate monitoring
During all exercise sessions, either as part of the GRIT
program or make-up sessions in a private environment,
participants were asked to wear the Polar A300 watch
and paired H7 chest strap. During week 1 GRIT exercise
sessions, the children were guided on how to correctly
wear the chest strap, pair it with their watch and initiate
and cease data collection. Participants were also provided their HR recovery zone and guided on using their
HR which was displayed in real-time on the Polar watch
during the session intervals. Participants were advised
not to wear their chest strap during exercise they engaged in outside of the GRIT group and makeup exercise sessions.
Healthy eating and cooking demonstration workshops
Three workshops were held which focused on healthy
eating and two workshops were held involving a cooking
demonstration. All sessions used a weight-neutral and
non-diet approach [30] and were interactive with involvement of participants and their parent/guardians.
Each healthy eating session and the second cooking
demonstration was implemented in small groups (maximum 20 participants) by an Accredited Practising
Dietitian (APD) and was held for 30 min. The first cooking demonstration involved two guest chefs and was
held for approximately one hour and included all participants. Details of each of the healthy eating and cooking
demonstration sessions are provided in Supplementary
Materials, Table S1. Briefly, the healthy eating session
topics were (1) healthy lunchbox challenge, (2) healthy
snack recipe modification, and (3) food for mood. The
guest chef cooking demonstration included a healthy
breakfast meal and snack. The APD cooking demonstration involved preparation of sushi rolls. Mid-way
through the program, parents were also provided with a
hard and/or electronic copy of the Australian Dietary
Guidelines Healthy Eating for Children brochure, which
provides evidence-based recommendations on the
amount and types of foods children should be eating for
health and wellbeing [31]. Each of the three healthy eating sessions were filmed (capturing the instructing APD
only) and a private link to the video of these sessions
Mayr et al. BMC Pediatrics
Page 5 of 16
(2020) 20:174
was sent to all parent/guardians so that any children unable to attend were able to review the material in their
own time. Appropriate food safety and handling procedures were followed in the healthy eating and cooking
demonstration sessions.
Emotional freedom technique and mindfulness workshop
In week 8, the psychologist ran a single 40-min group
workshop at the medical centre offices which covered
EFT and mindful eating. The EFT component involved
instructions on using tapping, which is an alternative behaviour technique to self soothe [32]. These instructions
included advised tapping points on the body, a series of
tapping steps to follow, and example statements to say
out loud whilst undertaking the tapping steps. The
psychologist and participants shared situations when
tapping could be used as a soothing technique. The children were each provided with a brochure including a
summary of these instructions [33] and were encouraged
to use tapping as a soothing technique at home or
school. EFT was chosen as an adjunct psychological
component to the GRIT program as it is simple to teach,
able to be delivered in a group setting and has been
demonstrated to improve eating habits and self-esteem
in adolescents [34]. The mindfulness component focused
on eating behaviour techniques, including guided eating
meditations and discussions. The eating behaviour techniques focused on attending physical hunger, satiety,
taste, and awareness of cues to eat; it also focused on
the practice of savouring tastes and textures [35]. During
the workshop, the psychologist guided participants
through a mindful eating exercise with a raisin.
Study measures
Study measures have been summarised in Table 3.
Process evaluation
Attendance of participants was recorded by the project
coordinator at each of the program sessions. The withdrawal of participants was recorded, including the date
and week of the program and reason, if disclosed. Time
involved in the program for participants who withdrew
or who were lost to follow up was calculated in days
from the date of the first exercise session to the date of
the last attended program session. All adverse events
were recorded using researcher logs, including any adverse events not related to the GRIT intervention but
which occurred during the study implementation or at
home and were reported to GRIT staff members. Participant and parent/guardian satisfaction with the GRIT
program were measured on separate hard copy surveys
at study completion or withdrawal. The Likert-scaled
questions related to satisfaction with the program
overall, each discipline component and the staff involved
(see Supplementary Materials pages 5–7).
Heart rate during exercise sessions
Prior to the GRIT intervention commencing, children
and their parents were instructed in the proper set up of
both their Polar watch and private Polar account. The
HR data collected during exercise sessions was accessed
via a central Polar Coach account. The participants were
able to view their own exercise data when uploaded, but
not the data of other involved participants. The
uploaded HR data included beats per minute (bpm)
measured at 00:01 s intervals. For each uploaded session
(not including make-up sessions) the participants’ minimum, maximum, and mean HR were calculated. The
child’s mean HR as a % of HRmax (as determined by
their baseline cardiorespiratory testing data, see below)
was then calculated for each session. For all uploaded
exercise sessions, each of these HR data measures were
averaged across the children. The data for sessions
within weeks 2–4 (week 1 set up/ familiarisation period
excluded), weeks 5–7, and weeks 9–12 were then each
averaged for assessment of trends across the exercise
program phases. Uploaded HR data was also used to determine completion of make-up sessions.
Anthropometry
Outcome measures were collected at baseline (0–3
weeks pre-intervention) and follow-up (up to 3-weeks
post-intervention; i.e. 12–15 weeks post-baseline). Anthropometric measures were performed at baseline.
Weight (kg) was measured using calibrated scales with
light clothing, and shoes removed. Height (cm) was measured by a standing stadiometer using the stretch stature
method. Body Mass Index (BMI, kg/m2) was calculated.
Waist circumference (cm) was measured using a tape
measure at the narrowest point between the lower ribs
and the iliac crest. All anthropometric measures were repeated twice with the average of the two measures used
as the outcome. However, if these measures differed by
5% or more a third measure was taken, and the average
of the two closest measures was reported. BMI-for-age
percentiles according to sex were determined [37] and
used to calculate BMI Z-scores which classified participants as thin (<− 1), healthy (− 1 to + 1), overweight [1,
2] or obese (> 2); although research is ongoing regarding
the language used to describe these categories.
Maximal graded cardiorespiratory testing
Cardiorespiratory testing was performed at baseline and
follow-up at a local physiotherapist clinic. This type of
exercise testing assesses ventilatory gas exchange in
order to measure metabolic functional capacity [38].
Participants performed a resting test and treadmill ramp
Mayr et al. BMC Pediatrics
Page 6 of 16
(2020) 20:174
Table 3 Summary of Study Measures
Study Measure
Timepoints
Explanation
Related intervention component/s
Attendance
All sessions from baseline
to 12 weeks
Measure of feasibility
All
Retention
1st exercise session to last
attended study session
Measure of feasibility
Total days involved and number of participants
completing the study versus withdrawal
Program involvement
Adverse events
Reported at any exercise,
dietary or psychology session
Measure of feasibility
Minor or major
Assessed whether unrelated, potentially related
or related to the study
All
Satisfaction
12 weeks or at withdrawal
Measure of feasibility
Collected via written surveys with Likert scaled
questions
All
Heart rate during
exercise sessions
Continuously during HIIT group Guide for participants during exercise sessions
exercise sessions and individual to achieve high intensity and recovery heart
rate targets
make-up sessions
Changes in HR across the intervention are a
fitness indicator
Exercise sessions
Anthropometry
Baseline
Participant characteristics for weight, height and
waist circumference, with calculation of BMI,
BMI-for-age percentiles and Z-score
Not a target of any interventions
Maximal graded
cardiorespiratory testing
Baseline and 12 weeks
VO2peak: Peak oxygen consumption during
testing as a measure of maximal exercise
capacity. Testing time to reach VO2peak measures
time to exertion.
HRmax: Maximum heart rate measured during
exercise testing. A reduction in HRmax over time
can indicate improvements in cardiac output.
MFO: maximum fat oxidation measure during
testing, positively associated with respiratory
capacity and training status [36].
Exercise sessions
Australian Child and
Baseline and 12 weeks
Adolescent Eating Survey
FFQ (Nutrient intake
and diet quality)
Total and food-group based Australian Child and
Adolescent Recommended Food Scores, measures
of diet quality reflecting adherence to the
Australian Dietary Guidelines.
Estimated daily intake of food groups as a
percentage contribution to total energy intake.
Estimated macro- and micronutrient intake
Dietary education sessions
and cooking demonstrations
Piers Harris-2
Self-concept scale
Baseline and 12 weeks
All
Global measure of self-esteem. Measures total
and domains of behavioural adjustment,
intellectual and school status, physical appearance
and attributes, popularity, happiness and satisfaction,
and freedom from anxiety
HIIT High Intensity Interval Training, FFQ food frequency questionnaire
protocol with respiratory gas analysis (Ultima CPX™
metabolic stress testing system, MGC diagnostics) and a
facemask system (preVent® Face Mask, MGC Diagnostics). The tests were implemented by trained clinical
physiotherapists and flow and gas calibration were performed on the machine as per manufacturer instructions
prior to each test. Participants were instructed to perform the test in a fasted (at least 6 h) and rested state
(no exercise that day prior to the test). Where possible,
time of day when the baseline and follow-up tests were
performed was within 2 h. A self-report of usual exercise
sessions undertaken per week was recorded at baseline
and 12-weeks follow-up. Participants also undertook a
resting metabolic test at baseline and 12 weeks (protocol
detailed in Supplementary Materials).
The metabolic stress testing system calculated breathby-breath measures of oxygen uptake (VO2) and carbon
dioxide output (VCO2) with HR (bpm) also measured
continuously during the test. Maximal exercise capacity
is typically measured by a levelling off of VO2 despite increased workload (VO2max). However, as reported in
previous studies in children [39], it was anticipated that
most participants would not reach a VO2max. Instead,
the peak oxygen consumption (VO2peak) was chosen to
be reported. VO2peak was calculated as the average of
the two highest VO2 measures recorded during the test.
Other outcomes included: exercise test duration (time in
minutes and seconds between start of test and volitional
exhaustion); the testing time at which VO2peak was
reached (average of the times at which the two highest
Mayr et al. BMC Pediatrics
Page 7 of 16
(2020) 20:174
VO2 measures occurred); HR at the start of exercise
testing; maximum HR measured (HRmax, average of the
two highest HR measures recorded during the test); and
the testing time at which HRmax was measured (average
of the times at which the two highest HR measures
occurred).
The breath-by-breath gas analysis recorded from both
the resting tests (the mean of the last 10-min of data)
and exercise tests (means of the data from each 1-min
testing increment from 10-min onwards) were also used
to measure substrate oxidation. Based on the calculated
respiratory quotient (VCO2/VO2), fat and carbohydrate
oxidation and energy expenditure were calculated using
stoichiometric equations and appropriate energy equivalents, with the assumption that the urinary nitrogen excretion rate was negligible during the treadmill test [36,
40]. Maximum fat oxidation (MFO) [41] was calculated
in kcal/min based on the highest fat oxidation measure
within the 1-min testing increments calculated during
the exercise test. MFO time was also recorded as the 1min testing increment within which the MFO measure
occurred.
Nutrient intake and diet quality
Nutrient intake and diet quality were measured using
the Australian Child and Adolescent Eating Survey
(ACAES) at baseline and post-intervention. These were
completed online where participants’ parent/guardians
were emailed the survey link with instructions. The
ACAES is a validated 135-item semi-quantitative food
frequency questionnaire (FFQ) which reflects the Australian food supply, and includes 120 food items and 15
supplementary questions addressing demographics and
food and activity behaviours [42]. Parents/guardians
were encouraged to have their child complete the survey
questions on their own as this has been reported to produce more accurate intake data [43]. The ACAES licence
holders (University of Newcastle, Australia) performed
analysis after final data collection. Data included estimated daily micro- and macronutrient intakes, contribution to total energy intake from food groups, and the
Australian Child and Adolescent Recommended Food
Score (ACARFS). The ACARFS is a validated food-based
diet quality index which quantifies overall diet quality
reflecting the level of adherence to the Australian Dietary Guidelines for children and adolescents [44]. The
ACARFS has a total diet quality score ranging from 0 to
73 (73 indicating the highest possible diet quality); as
well as eight sub-scales for the food groups of vegetables,
fruit, grains, meat, meat alternatives, dairy, extras and
water [44]. The ACARFS shows strong correlations with
nutrient intakes; however, is independent of BMI for
children and adolescents, indicating that improvements
in dietary intake can be demonstrated without the
requirement to consume more food (and energy by
proxy) overall [44].
Psychological assessment: self-concept
The participants’ self-concept was assessed using the validated Piers-Harris Children’s Self-Concept Scale, 2nd
Edition (Piers-Harris 2) [45]. This tool is suitable for
children aged 7–18 years and takes 10–15 min to
complete the 60 items. It evaluates the domains of behavioural adjustment, intellectual and school status,
physical appearance and attributes, popularity, happiness
and satisfaction, and freedom from anxiety [45]. This
tool was self-completed by the participants in small
group sessions facilitated by the psychologist at baseline
and follow-up. The psychologist analysed the children’s
completed Piers-Harris 2 forms according to standardised procedures in which raw scores were converted to
standardised T-scores (mean = 50, standard deviation =
10). This resulted in a total score (general self-concept)
and sub-scores for each of the previously noted six domains, with a higher score reflecting greater self-concept
(refer to supplementary Table S2 for interpretation of
the T-Score ranges). This tool also measured two scales
that assessed the validity of the responses: inconsistent
responding and response bias. A T-score ≥ 70 for the inconsistent responding scale suggested a child may have
responded randomly to some questions and a T-score ≤
30 or ≥ 70 for the response bias scale may represent a
tendency toward negative or positive response bias, respectively [45].
Statistical analyses
All statistical analyses were conducted in SPSS statistical
package version 25 [IBM Corp, released 2018]. Statistical
significance was set at p < 0.05. The Shapiro-Wilk test
was applied to assess the normality of continuous variables. Data are presented as mean ± standard deviation
(SD), median (interquartile range [IQR]), or n (%), as appropriate. An Independent Student’s t-test or nonparametric Mann-Whitney U test was used to compare
continuous variables between study completers and
dropouts at baseline, whereas categorical variables were
compared using the Chi-square test. A Paired samples ttest or Wilcoxon signed-rank test was used to determine
the effect of the intervention on continuous outcome
variables between baseline and follow-up in study completers only (defined as participants who completed 12week maximal exercise testing). Repeated measures
ANOVA, with post-hoc t-tests, was used to assess differences in exercise HR data measures across weeks 2–4,
5–8 and 9–12 of the intervention. If data was missing
for study completers at follow-up due to failure to
complete/attend the measures, their data were primarily
analysed (and reported herein) by bringing baseline
Mayr et al. BMC Pediatrics
Page 8 of 16
(2020) 20:174
observations forward as a conservative method which assumes no change [46]. Analyses in only study completers
without missing data were also performed to confirm
any impact of imputation on results for intervention
effect.
Results
Participants
A total of 44 potentially eligible participants were identified in the recruitment timeframe, six of whom were ineligible or unable to start the program (Fig. 1).
Therefore, 38 eligible children and adolescents were recruited. At baseline, the total participant cohort median
age was 11.4 years (range: 8.8 to 15.8 years), 53% were
male, and 66% had BMI Z-score > 1 and median BMI
percentile of 95 (IQR 47–98) (Table 4).
Process evaluation
Of the 38 enrolled participants, 24 (63%) completed the
12-week intervention. Withdrawals occurred from within
week 1 to week 11 of the program (3 in week 1, 2 in week
2, 3 in week 3, 1 in week 4, 1 in week 6, 1 in week 7, 2 in
week 10 and 1 in week 11); where the main reasons were
competing commitments (n = 4) and medical contraindications unrelated to the intervention (n = 3) (Fig. 1). There
were no significant differences between completers and
dropouts for these general characteristics of participants
at baseline (supplementary Table S3).
Program attendance
Attendance at GRIT sessions for all participants and
completers are reported in Table 5. The program completers attended a median 58% (total range 30 to 88%) of
the 33 offered exercise sessions. Dropouts attended a
median 38% (total range 0 to 48%) of offered exercise
sessions in the first 4 weeks and then a median of 0
thereafter (supplementary Table S4). Make up exercise
sessions were completed for one quarter of the sessions
missed by completers and no make-up sessions were
done by dropouts. Completers attended a median 60%
(total range 0 to 100%) of the 5 offered dietary sessions,
compared to 20% (total range 0 to 40%) in dropouts.
Only completers (42%) attended the one EFT/mindfulness psychologist session which occurred in week 8 of
the program. Within the dropouts the mean time they
were involved in the study was 27 ± 20 out of 82 program days.
Adverse events
No serious adverse events occurred. Minor adverse
events which were self-reported by participants occurred
during exercise sessions only and did not require medical intervention. On six occasions a participant started
Fig. 1 Flow diagram of participants in Project GRIT, including completion of study measures and reasons for withdrawal
Mayr et al. BMC Pediatrics
Page 9 of 16
(2020) 20:174
Table 4 Baseline characteristics of participants enrolled in GRIT
(n = 38)
Measure
Total cohort
exercise induced) and then discontinued the program as
they were not willing to obtain General Practitioner reconsent.
Median (IQR)a, n (%), or mean ± SD
Age (years)
11.4 (9.7–12.9)
Male sex
20 (53)
Sibling involved
16 (42)
Weight (kg)
56.7 ± 18.7
Waist circumference (cm)
76.7 ± 13.7
BMI (kg/m2)
23.5 ± 5.5
BMI for age (%le)
95 (47–98)
BMI Z-score
1.6 (−0.10–1.99)
< −1
1 (42)
−1 to 1
12 (32)
> 1 to 2
16 (42)
>2
9 (24)
Exercise sessions/week
2.0 (1.0–3.0)
BMI Body mass index
a
Non-parametric data
but did not complete an exercise session; four of these
were possibly related to the intervention (sore knee, sore
groin, sore leg and n = 2 feeling unwell), and one was
not related to the intervention (recent stitches on finger). On another six occasions a participant reported an
event but completed the exercise session; all were possibly related to the intervention (soreness or pain in a
leg, knee, and/or heel). The quality of footwear (provided
by the parents and not the study) was identified by staff
as a frequent cause of minor adverse events related or
possibly related to the intervention. Other minor events
unrelated to the program were: 1) half way through the
program, one parent reported being concerned that their
child may have disordered eating habits and was referred
by medical centre staff to an eating disorders specialist
(externally) and the participant remained in the program
but chose not to attend any further healthy eating workshops or cooking demonstrations; 2) a participant reported having had an asthma attack at school (not-
Satisfaction surveys
Satisfaction surveys were returned by 12 parents and 15
participants. One participant and their parent who submitted the satisfaction surveys represented a dropout
who withdrew from the program after 6-weeks and the
remainder were completers. Satisfaction survey response
data has been provided in detail in the Supplementary
Table S5, including suggestions for potential improvements made by the survey respondents. Most participants (87%) and parents (83%) who responded reported
they were very satisfied or satisfied with the GRIT program. Most of these participants (80%) and parents
(75%) indicated they were also satisfied with the time
spent in the GRIT program. For the participants, the
proportion rating ‘very satisfied’ was highest for the
cooking demonstrations (60%), followed by EFT/mindfulness (57%, in the 7 who had attended), exercise sessions (47%), and the healthy eating sessions (40%). Two
thirds of both parents and participants who responded
indicated they would ‘definitely’ recommend the program to a friend.
Heat rate during exercise sessions
In the completers who had accessible HR data through
their Polar account (n = 22 with a mean 21 ± 5 exercise
sessions of data available per participant), there was a
mean increase of 5 bpm maximum recorded HR across
the program (p = 0.001) (Table 6). Mean HR as a % of
the participants’ HRmax (from baseline maximal exercise testing data) slightly decreased across the program
(p = 0.046), with a significant mean decrease of 2 bpm
between weeks 2–4 and weeks 5–8 only (p = 0.002).
Study outcome measures
Maximal graded cardiorespiratory testing
Figure 2 illustrates the participants’ substrate oxidation
and HR in function of their VO2peak at rest and in 1-
Table 5 Attendance at Project GRIT program sessions, reported as median (IQR)
Measure
Total cohort (n = 38)
Completers (n = 24)
No. sessions
% of offered
No. sessions
% of offered
Exercise sessions (out of 33)a
17.5 (5.0–20.5)
53 (15–62)
19.0 (18.0–25.0)
58 (55–75)
Weeks 1–4 (out of 12)
8.5 (5.0–10.3)
71 (42–85)
9.0 (8.3–11.0)
75 (69–92)
Weeks 5–8 (out of 11)
6.0 (0–7.3)
55 (0–66)
7.0 (6.0–8.0)
64 (55–73)
Weeks 9–12 (out of 10)
2.0 (0–5.0)
20 (0–50)
4.5 (2.3–6.0)
45 (23–60)
Dietary sessions (out of 5)
2.0 (1.0–4.0)
40 (20–80)
3.1 (2.0–4.8)
60 (40–95)
EFT/Mindfulness session (out of 1)
n = 10
26%
n = 10
42%
EFT Emotional Freedom Technique (tapping)
a
33 exercise sessions offered as 3 were cancelled (1 in week 5–8 and 2 in week 9–12)
Mayr et al. BMC Pediatrics
Page 10 of 16
(2020) 20:174
Table 6 Heart Rate (HR) data measured during exercise sessions
in completers (n = 22)
HR Measure
Weeks 2-4a
Weeks 5–8
Weeks 9–12
Mean ± SD
p-value
Minimum
111 ± 11
110 ± 7
109 ± 9
0.23
Maximum
191 ± 8
193 ± 8
196 ± 9
0.001*
Mean
147 ± 9
144 ± 7
146 ± 8
0.06
Mean % HRmax
75 ± 5
73 ± 4
74 ± 5
0.046**
HRmax, estimated maximum heart rate from baseline maximal exercise
testing data
a
Week 1 set up / facilitation period excluded
*Significant difference in maximum recorded HR across the program (weeks
2–4 vs. 5–8, p = 0.08; weeks 2–4 vs. 9–12, p = 0.002; weeks 5–8 vs.
9–12, p = 0.02)
**Significant difference in % HRmax across the program, (weeks 2–4 vs. 5–8,
p = 0.002, weeks 2–4 vs. 9–12, p = 0.29; weeks 5–8 vs. 9–12, p = 0.23)
min increments from 10-min in the maximal exercise
test at baseline. Completers and dropouts did not differ
in baseline maximal exercise test results (see supplementary Table S6).
Maximal exercise test outcomes for the 24 completers
are reported in Table 7. There were no significant changes
between baseline and 12-weeks; absolute VO2peak was,
however, modestly increased by 5% (96 ± 239 mL/min)
after 12-weeks when compared to baseline (p = 0.06).
Nutrient intake and diet quality
Two dropouts and one completer did not complete their
online ACAES at baseline. For the baseline dietary intake
data collected, 86% were reported as being completed by
the child and the remainder by a parent/guardian. Seven
completers and two dropouts completed their baseline
online eating survey late (after the first healthy eating
session had occurred); however, their data has still been
included as the eating survey asks questions relating to the
past 3-months and inclusion would more likely reduce the
reported effect on dietary improvement at follow-up than
inflate it. At baseline, dropouts had higher diet quality
compared to completers (see supplementary Table S7);
specifically, total ACARFS (median 34.0 [IQR 27.0–45.5]
vs. 23.0 [IQR 18.0–35.0], p = 0.03), vegetable ACARFS
(mean 12.1 ± 5.7 vs. 7.3 ± 5.0, p = 0.01), and percentage
vegetable contribution to energy intake (median 5.5 [IQR
5.0–9.5] vs. 4.0 [IQR 2.0–5.0] %, p = 0.009). With regards
to nutrient intake, the dropouts had significantly higher
daily intake of water (mean 2.8 ± 0.8 vs. 2.2 ± 0.7 L, p =
0.02) and vitamin C (median 155.9 [IQR 113.7–235.4] vs.
86.2 [53.0–264.8] mg, p = 0.01).
Four of the 23 completers who had baseline diet data
did not complete their follow-up online ACAES, so their
baseline data was carried forward to follow-up (Table 8).
At follow-up, 89% of the surveys were reported as being
completed by the participant and the remainder by a
parent/guardian. There was an increase in mean percentage contribution to energy intake from total core
foods (by 6.0 ± 11.1%, p = 0.02), accompanied by the
same % reduction in energy intake from non-core foods,
from baseline to follow-up data. This was contributed to
by a decrease in median percentage contribution to energy from confectionary (− 2.0 [IQR 0.0–3.0] %, p =
0.003) and baked products (− 1.0 [IQR 0.0–5.0] %, p =
0.02). Although some improvements were reported for
Fig. 2 Substrate oxidation in function of VO2peak (%) during a graded treadmill test to exhaustion. EEox is the amount of total energy
expenditure in kcal/min. CHOox is the amount of carbohydrate oxidized in kcal/min. Fatox is the amount of fat oxidized in kcal/min. RQ
is the respiratory quotient calculated as the ratio of carbon dioxide (CO2) produced divided by oxygen (O2) consumed during the
exercise. HR is heart rate in bpm. Data are means across all participants
Mayr et al. BMC Pediatrics
Page 11 of 16
(2020) 20:174
Table 7 Maximal graded cardiorespiratory test outcomes in
GRIT program completers (n = 24)
Measure
Baseline
12-weeks
Mean ± SD or Median (IQR)c
p-value
Test duration (min:sec)
19:41 ± 2:00
19:52 ± 01:09
0.63
VO2peak (absolute, ml/min)
1922 ± 469
2018 ± 468
0.06
VO2peak time (min:sec)
19:13 ± 02:06
19:32 ± 01:12
0.38
HR exercise start (bpm)
110 ± 14
111 ± 11
0.93
HRmax (bpm)
201 (192–205)
198 (192–203)
0.58
HRmax test time (min:sec)
19:19 ± 02:05
19:28 ± 01:05
0.67
a
MFO (kcal/min)
b
MFO time (1 min interval)
2.7 ± 1.0
2.4 ± 0.9
0.12
13 (11–15)
12 (10–17)
0.76
HRmax maximum recorded heart rate, MFO maximum fat oxidation
a
MFO data for n = 23 due to errors in one participant testing
b
MFO time represents the 1-min interval in the testing period at which peak
fat oxidation occurred
c
Non-parametric data
total and food group-based ACARFS and for nutrient intakes, none were statistically significant. The dietary intake results remained the same when analyses were
performed in study completers with complete data only.
Self-concept
Two dropouts did not complete the Piers-Harris 2 selfconcept scale at baseline. There were no significant differences between dropouts and completers for total or
individual domain scores (supplementary Table S8);
however, dropouts did tend to have a lower score for the
‘Happiness and Satisfaction’ domain (41.5 [IQR 37.8–
43.0) vs. 45.0 [IQR 40.0–51.0], p = 0.08). At baseline and
follow-up, no participants had an inconsistent responding scale T-score ≥ 70. At baseline two completers had
response bias scale T-scores of 29, which could reflect a
tendency of negative reporting. No completers had a response bias score ≤ 30 at 12-weeks. No participants had a
response bias scale T-score ≥ 70 at baseline or follow-up.
Four completers did not complete the Piers Harris-2
assessment at follow-up; hence their baseline scores
were carried forward (Table 9). There was an improvement in total mean score (by 2.8 ± 5.3, p = 0.02) and the
‘Physical appearance and attributes’ area median score
(by 4.0 [IQR 0.5–4.0], p = 0.02) from baseline to followup. The score for ‘Happiness and satisfaction’ also changed by a median score of 4.0 (IQR 0.0–8.0), p = 0.10.
There were no changes in the scales for response bias
and inconsistent reporting. The self-concept results
remained the same when analyses were performed in
only study completers with complete data.
Discussion
The primary aim of this study was to determine the
feasibility and effect of a multidisciplinary lifestyle intervention delivered in a non-institutional setting on
cardiorespiratory fitness, nutrient intake, diet quality and
self-concept in sedentary children and adolescents. The
results demonstrated that study completers improved
diet quality through an increased proportion of energy
intake from healthy core foods and decreased discretionary foods, and improved self-concept, particularly with
regards to the physical appearance and attributes domain. Cardiorespiratory fitness was not significantly improved at follow-up, although mean absolute VO2peak
increased 5%; a comparable modest increase to previous
intervention studies in children [47]. Despite being satisfied with the program, few recruited participants met
the attendance goals and the attrition rate was higher
than expected.
The GRIT program found no significant improvement
in cardiorespiratory fitness, with trends demonstrated for
increased absolute VO2peak and HR during exercise. It
has previously been demonstrated in research settings that
HIIT interventions for 5 and 12 weeks significantly improved cardiorespiratory fitness and cardiometabolic risk
markers in children with similar effects to MICT [25, 26].
A recent randomised trial conducted in Australia of HIIT
vs. MICT in children with obesity found a greater increase
in cardiorespiratory fitness, as measured by relative
VO2peak, with HIIT compared to MICT [39]. In that
study the sessions were conducted individually in a controlled environment using an exercise bike, which is not
reflective of a real-world setting. Our study was unique in
testing the use of a HIIT protocol in children in a group
setting and in a non-controlled environment. A randomised controlled feasibility study in New Zealand involving overweight inactive adults (n = 49) similarly assessed
12-weeks of supervised HITT group sessions held outdoors in a community park [48]. The intervention improved VO2max; however, the magnitude was more
modest than demonstrated in prior adult trials. The authors concluded this was most likely due to the reduced
adherence to the exercise program when moving beyond
the research clinic setting, a phenomenon which was likely
also experienced by GRIT participants.
Participants reduced intake of discretionary foods as a
contribution to energy intake, with a significant reduction in confectionary and baked products, and increased
total intake of healthy core foods. Whilst there was no
significant increase in any individual healthy core food,
there were small increases in each which contributed to
the total improvement. Our program used predominantly experiential learning in the dietary education and
cooking demonstration sessions, which aligns with previous findings that school-based programs for children
with the most significant improvements for increased
healthy food intake and reduced sugar intake used this
delivery technique [21]. The same review identified that
parental involvement in childhood healthy eating
Mayr et al. BMC Pediatrics
Page 12 of 16
(2020) 20:174
Table 8 Dietary intake outcomes in GRIT program completers (n = 23)
Measure
Baseline
12-weeks
Mean ± SD or Median (IQR)a
p-value
Food Percentage Contribution to Daily Energy Intake
Core
55.7 ± 17.0
61.7 ± 12.4
0.02*
Non-core
44.3 ± 17.0
38.4 ± 12.4
0.02*
Vegetables
4.0 (2.0–5.0)
4.5 (2.0–7.0)
0.38
Fruit
7.8 ± 4.3
10.1 ± 7.4
0.12
Grains
15.0 (8.0–19.0)
15.5 (10.3–18.8)
0.86
Meat
12.6 ± 6.0
14.7 ± 7.8
0.21
Meat alternatives
2.0 (1.0–5.0)
2.0 (1.0–4.8)
0.64
Dairy
9.0 (8.0–17.0)
11.5 (7.0–22.0)
0.41
Sweet drinks
3.0 (1.0–5.0)
2.0 (1.0–4.8)
0.89
Packaged snacks
6.0 (3.0–10.0)
4.5 (3.0–9.8)
0.73
Confectionary
6.0 (4.0–12.0)
5.0 (4.0–8.8)
0.003*
Baked products
6.0 (4.0–9.0)
5.0 (3.0–7.0)
0.02*
Takeaway
9.0 (8.0–16.0)
10.0 (9.0–16.8)
0.78
Condiments
2.0 (1.0–3.0)
2.0 (1.0–3.0)
0.12
Fatty meats
2.0 (1.0–3.0)
2.0 (1.0–3.0)
0.23
Total (/73)
23.0 (18.0–35.0)
26.0 (19.3–39.5)
0.28
Vegetables (/21)
7.3 ± 5.0
6.8 ± 4.9
1.00
Australian Recommended Food Scores
Fruit (/12)
4.0 (3.0–7.0)
5.0 (2.3–7.8)
0.25
Grains (/13)
4.6 ± 2.1
4.8 ± 2.5
0.13
Meat (/7)
2.3 ± 1.1
2.4 ± 1.6
0.73
Meat alternatives (/6)
1.0 (1.0–2.0)
2.0 (1.0–2.0)
0.79
Dairy (/11)
3.7 ± 2.2
4.0 ± 2.4
0.12
Extras (/1)
1.0 (1.0–2.0)
1.0 (1.0–2.0)
1.00
Water (/2)
1.0 (0.0–1.0)
1.0 (1.0–1.0)
0.66
Daily Nutrient Intake
Energy (kJ)
9078 ± 2689
8663 ± 3507
0.52
Protein (g)
94.4 ± 28.8
96.7 ± 42.9
0.75
Protein (%E)
17.0 (16.0–19.0)
18.0 (17.0–21.8)
0.39
CHO (g)
252.3 ± 79.9
230.1 ± 93.4
0.23
CHO (%E)
47.7 ± 5.7
45.9 ± 8.6
0.31
Fat (g)
83.5 ± 28.5
80.9 ± 36.5
0.71
Fat (%E)
35.4 ± 4.8
35.3 ± 6.1
0.86
Saturated fat (g)
38.1 ± 14.7
35.9 ± 17.7
0.53
Saturated fat (%E)
15.9 ± 3.0
15.3 ± 3.4
0.52
PUFA (g)
8.9 ± 2.9
8.6 ± 4.1
0.93
PUFA (%E)
4.0 (3.0–4.0)
4.0 (3.3–4.0)
0.59
MUFA (g)
29.4 ± 9.9
27.4 ± 13.8
0.89
MUFA (%E)
12.4 ± 2.0
12.8 ± 2.5
0.52
Cholesterol (mg)
326.4 ± 114.4
303.0 ± 172.9
0.81
Sugars (g)
131.1 ± 55.8
105.4 ± 48.1
0.18
Water (L)
2.2 ± 0.7
2.1 ± 1.0
0.63
Mayr et al. BMC Pediatrics
Page 13 of 16
(2020) 20:174
Table 8 Dietary intake outcomes in GRIT program completers (n = 23) (Continued)
Measure
Baseline
12-weeks
Mean ± SD or Median (IQR)a
p-value
Fibre (g)
22.1 (22.2–29.9)
23.7 (15.3–30.6)
0.99
Vitamin C (mg)
86.2 (53.0–264.8)
110.2 (57.1–150.5)
0.40
Folate (μg)
235.0 (235.0–359.7)
256.9 (173.7–353.3)
0.86
Niacin (mg)
21.2 ± 6.7
21.2 ± 9.2
0.99
Niacin equivalents (mg)
40.1 ± 11.8
40.6 ± 17.5
0.86
Riboflavin (mg)
2.2 ± 0.9
2.2 ± 1.1
0.87
Thiamin (mg)
1.6 (0.8–1.8)
1.5 (0.9–2.1)
0.52
Vitamin A (μg)
1145.7 (802.5–1614.7)
1261.9 (771.1–1753.0)
0.71
Retinol (μg)
497.3 (306.5–632.8)
429.3 (429.3–700.0)
0.58
Beta-carotene (μg)
3694.0 (1974.7–5720.7)
4092.9 (1487.9–6383.2)
1.00
Sodium (mg)
2197.8 ± 702.1
2141.3 ± 999.0
0.76
Potassium (mg)
3093.0 ± 997.4
3104.2 ± 1306.4
0.96
Magnesium (mg)
332.4 ± 88.1
339.2 ± 130.4
0.75
Phosphorus (mg)
1578.1 ± 513.3
1589.6 ± 723.5
0.93
Iron (mg)
12.1 ± 3.7
12.1 ± 4.7
0.97
Zinc (mg)
12.3 ± 3.6
12.7 ± 5.5
0.62
Calcium (mg)
987.6 (713.7–1318.6)
906.5 (601.1–1695.9)
0.61
CHO carbohydrate, PUFA polyunsaturated fatty acids, MUFA monounsaturated fatty acids
a
Non-parametric data
*Significant difference between baseline and follow-up, p < 0.05
programs was associated with program effectiveness in
the school setting [21]. Parents were encouraged to attend the GRIT dietary sessions, however, not all took
part and the sessions were mostly directed at the children. Inclusion of more parent-focused dietary education
could have been useful, which was also self-reported by
some parents in the feedback surveys.
There was no significant improvement in the ACARFS
as a measure of overall diet quality, the food group sub-
scores or intake of nutrients in GRIT participants. The
total and food group ACARFS are scored based on both
total daily intake and the variety of choices within the food
groups [42] to reflect the Australian Dietary Guidelines
[31]. The GRIT healthy eating sessions and cooking demonstrations promoted healthy core food choices, including
recipe modification and balance with non-core discretionary foods (which significantly improved), however, the
education did not necessarily target increased variety of
Table 9 Piers-Harris 2 Self-concept Scale outcomesa in GRIT program completers (n = 24)
Scale
12-weeksb
Baseline
c
Mean ± SD or Median (IQR)
p-value
Total score
48.2 ± 9.4
51.0 ± 10.8
0.02*
Behavioural adjustment
54.0 (46.8–62.0)
54.0 (49.0–62.0)
0.30
Intellectual and school status
51.0 (48.0–54.0)
51.0 (46.0–54.0)
0.39
Physical appearance and attributes
42.0 (40.0–50.3)
48.0 (40.5–54.3)
0.02*
Freedom from anxiety
47.0 (37.0–54.0)
52.5 (37.0–58.0)
0.08
Popularity
47.0 ± 10.4
47.3 ± 9.8
0.62
Happiness and satisfaction
45.0 (40.0–51.0)
49.0 (40.0–59.0)
0.10
Response bias
49.2 ± 10.5
49.8 ± 9.6
0.85
Inconsistent responding
53.0 (43.0–53.0)
43.0 (43.0–53.0)
0.29
a
A higher score represents better self-concept
b
Baseline data carried forward for four participants who failed to complete 12-week assessment
c
Non-parametric data
*Significant difference between baseline and follow-up, p < 0.05
Mayr et al. BMC Pediatrics
(2020) 20:174
healthy foods eaten. Future programs could therefore
benefit from greater emphasis on the importance of variety within core food groups.
Completers of GRIT had a significant improvement in
Piers-Harris 2 total self-concept and physical appearance
and attributes scores. This improvement in self-concept
was most likely an impact of the exercise and dietary
sessions as the psychology session which was held in the
last month of the program was attended by less than
one third of these participants. The GRIT program
emphasised goals for healthy eating and physical activity
rather than weight status and was delivered in a group
setting, which are both strategies recommended for improving self-esteem in higher BMI children [20]. A previous group-based cognitive behavioural therapy,
physical activity and dietary intervention in adolescents
aged 13 to 16 years improved global self-perception and
domains for physical appearance, social acceptance and
romantic appeal [49]. On the other hand, a multidisciplinary group-based healthy eating and physical activity
program involving children aged 6 to 12 years and their
families only saw a significant improvement in participants with an initial BMI ≥98th percentile. A review
concluded that improvements in self-concept or selfesteem from exercise interventions in children and adolescents were likely linked to attainment of skills and
addition of activities (rather than replacement) [50].
Having recruited participants with mostly low baseline
activity levels, it is likely that the GRIT program
achieved both.
Attendance at program sessions was lower than the
expected target of 80% and over one third of participants
withdrew from the program. Other studies of lifestyle
intervention in children and adolescents in Australia,
have reported a similar drop-out rate [39, 51]. The aforementioned Australian trial of HIIT versus MICT in children with obesity had higher exercise session attendance
rates (average 68%); however, it demonstrated a similar
trend to GRIT for reduction in attendance rates across
its 12-week program [39]. The other previously noted
study which assessed the feasibility of HIIT in adults in
a real-world setting had an attendance rate of 59% in
their aerobic interval training group, which is similar to
the attendance rates at exercise sessions for GRIT completers. Competing commitments were the main reason
for dropout in GRIT which is a difficulty associated with
delivering an intervention outside of the school setting.
Availability of parent/guardians to supervise the exercise
sessions may have also impacted attendance. Feedback
from parents included holding dietary education on the
same days as the exercise to reduce the number of days
involved in the week and to avoid having the program
run during school holidays. Furthermore, feedback from
both GRIT participants and parents highlighted that the
Page 14 of 16
dietary sessions could have been improved by dividing
participants based on age groups. Delivering and targeting dietary activities for age groups could increase attendance at those sessions as well as their effectiveness.
At baseline, the study dropouts had significantly higher
total ACARFS and vegetable sub-score, and tended to
engage in more exercise, compared to completers. This
suggests that participants who followed a healthier lifestyle may have been less engaged with the program.
Whilst the study was intended to enrol only sedentary
children, this was self-reported by their parent/guardian
and no screening tool was used. It is recommended that
exercise levels be assessed via a valid tool to identify sedentary children and adolescents in future programs. Future programs may also be better targeted at inclusion of
children and adolescents identified as having poor diet
quality at baseline, or the inclusion of some individualised sessions (as was suggested in the parent’s feedback)
could assist with identifying targeted areas of dietary improvement for each participant.
This pilot study is strengthened by testing a multidisciplinary intervention in a real world, non-institutional
setting. Furthermore, it was unique in not being focused
on weight and including children of any BMI. However,
this study was limited by not having a control group and
therefore cause and effect cannot be concluded regarding the observed improvements in diet quality and selfconcept. An FFQ validated for Australian children and
adolescents was used to measure dietary intake, however
the results may be limited by self-reported data. As a
pilot study, the participant numbers were small and outcome measures were not powered to detect a significant
change. Whilst the process evaluation will be helpful in
informing the design of future programs, the satisfaction
surveys distributed to participants who withdrew were
poorly completed and the recommendations generated
are mostly limited to the opinions of participants and
parents who completed the study.
Conclusions
The 12-week Project GRIT pilot indicated promising
results; the group-based multidisciplinary lifestyle
intervention for children and adolescents in a noninstitutional setting improved diet quality and selfconcept in study completers. A lack of significant
improvement in cardiorespiratory fitness may have been
impacted by declining attendance rates at exercise sessions across the program. Future practice and research
should focus on providing sustainable multidisciplinary
lifestyle interventions for children and adolescents with
a focus on those identified as having poor dietary and
physical activity habits, parental involvement and incorporating flexibility to enhance engagement.
Mayr et al. BMC Pediatrics
Page 15 of 16
(2020) 20:174
Supplementary information
Supplementary information accompanies this paper at https://doi.org/10.
1186/s12887-020-02069-x.
Additional file 1. Supplementary Materials including: healthy eating and
cooking demonstration session details; parent and participant satisfaction
surveys, results tables reporting baseline participant characteristics,
program attendance and baseline data for exercise testing, dietary intake
and self-concept scale of study completers versus dropouts; and additional GRIT satisfaction survey data.
Abbreviations
ACAES: Australian Child and Adolescent Eating Survey; ACARFS: Australian
Child and Adolescent Recommended Food Score; APD: Accredited Practising
Dietitian; BMI: Body Mass Index; BPM: Beats per minute; CHO: Carbohydrate;
CHOox: Carbohydrate oxidation; EEox: Total energy expenditure;
EFT: Emotional Freedom Technique; Fatox: Fat oxidation; FFQ: Food
frequency questionnaire; GRIT: Growth, Resilience, Insights, Thrive; HIIT: High
Intensity Interval Training; HR: Heart rate; HRmax: Maximum recorded heart
rate; IQR: Interquartile range; MFO: Maximum fat oxidation; MICT: Moderate
Intensity Continuous Training; MUFA: Monounsaturated fatty acids;
PUFA: Polyunsaturated fatty acids; SD: Standard deviation; VCO2: Carbon
dioxide output; VO2: Oxygen consumption; VO2max: Maximal exercise
capacity; VO2peak: Peak oxygen consumption
Acknowledgements
We thank the Project GRIT team: Ross Kingsley for development and delivery
of the exercise sessions, Julianne Leembruggen for recruitment and project
coordination; Therese Fossheim for assistance in developing the exercise
sessions and anthropometric measures and coordination of the metabolic
testing; Mark Barrett for performing the metabolic testing; Erin Wallace and
Maddison Evans for delivery of heathy eating sessions; Leslie Hartley for
conducting psychological assessments and delivering the EFT and
mindfulness session; and Angie Pettit and Asha Soni for performing
anthropometric measures. The authors are very grateful to all the
participants of the study and their parents/guardians for their involvement.
Authors’ contributions
The Project GRIT team were involved in study development, delivery and
data collection (see acknowledgements). HM assisted program coordination,
entered data, analysed data and drafted the manuscript. FC conceptualised
the study design and contributed to recruitment, protocol development and
program coordination. EI, SS and SM assisted with protocol development
and data analysis. All individual co-authors critically reviewed and approved
the final manuscript.
Funding
Funding was provided by the study site Weight Loss Solutions Australia. The
CEO of Weight Loss Solutions Australia was involved in the design and
implementation of the Project GRIT intervention. Weight Loss Solutions
Australia was not involved with data collection, analysis, or reporting of data;
but contributed to manuscript revision.
Availability of data and materials
The datasets used and/or analysed during the current study are available
from the corresponding author on reasonable request.
Ethics approval and consent to participate
This study was approved by the Human Research Ethics Committees of
Bond University (SM02967). Written informed consent was obtained from all
participants and a parent/guardian.
Consent for publication
Not applicable.
Competing interests
HM, EI, SS and SM declare no potential or existing financial or other conflicts
of interest. HM has been paid a salary for work performed related to the
study. FC is the CEO of the study site which is funder of the study. FC
receives no salary or direct financial benefit for contributing to this study. FC
was involved in the intervention by providing direct supervision to staff and
senior oversight of operations; but was not be involved with data collection,
analysis, or reporting of the study beyond providing access for the
researchers to the study site.
Author details
1
Bond University Nutrition and Dietetics Research Group, Faculty of Health
Sciences and Medicine, Bond University, Gold Coast, Queensland, Australia.
2
Weight Loss Solutions Australia, Gold Coast, Queensland, Australia.
3
Department of Nutrition and Dietetics, Princess Alexandra Hospital, Brisbane,
Queensland, Australia. 4Adelaide Medical School, Centre of Research
Excellence in Translating Nutritional Science to Good Health, The University
of Adelaide, Adelaide, South Australia, Australia. 5Faculty of Health Sciences
and Medicine, Bond University, Gold Coast, Queensland, Australia.
6
Physiologic Physiotherapy and Sports Medicine Clinic, Gold Coast,
Queensland, Australia. 7Nutrition Research Australia, Sydney, New South
Wales, Australia.
Received: 2 October 2019 Accepted: 6 April 2020
References
1. Bai G, Herten MH-V, Landgraf JM, Korfage IJ, Raat H. Childhood chronic
conditions and health-related quality of life: Findings from a large
population-based study. PLoS One. 2017;12(6):e0178539.
2. Barlow SE. Expert Committee Recommendations Regarding the Prevention,
Assessment, and Treatment of Child and Adolescent Overweight and
Obesity: Summary Report. Pediatrics. 2007;120(Supplement 4):S164–S92.
3. Michaud P-A, Suris J-C, Viner R. The adolescent with a chronic condition:
epidemiology, developmental issues and health care provision; 2007.
4. World Health Organisation. New global estimates of child and adolescent
obesity released on World Obesity Day 2017. http://www.who.int/endchildhood-obesity/news/new-estimate-child-adolescent-obesity/en/.
Accessed 28 May 2019.
5. Morrison JA, Friedman LA, Wang P, Glueck CJ. Metabolic syndrome in
childhood predicts adult metabolic syndrome and type 2 diabetes mellitus
25 to 30 years later. J Pediatr. 2008;152(2):201–6.
6. Reilly JJ, Kelly J. Long-term impact of overweight and obesity in childhood
and adolescence on morbidity and premature mortality in adulthood:
systematic review. Int J Obes. 2010;35:891.
7. Laitinen Tomi T, Pahkala K, Magnussen Costan G, Viikari Jorma SA, Oikonen
M, Taittonen L, et al. Ideal cardiovascular health in childhood and
Cardiometabolic outcomes in adulthood. Circulation. 2012;125(16):1971–8.
8. Steinberger J, Daniels Stephen R, Hagberg N, Isasi Carmen R, Kelly Aaron S,
Lloyd-Jones D, et al. Cardiovascular health promotion in children: challenges
and opportunities for 2020 and beyond: a scientific statement from the
American Heart Association. Circulation. 2016;134(12):e236–e55.
9. Saunders TJ, Chaput J-P, MSJCjod T. Sedentary behaviour as an emerging
risk factor for cardiometabolic diseases in children and youth. Can J
Diabetes. 2014;38(1):53–61.
10. Ekelund U, Ja L, Sherar LB, Esliger DW, Griew P, Cooper A, et al. Moderate to
vigorous physical activity and sedentary time and Cardiometabolic risk
factors in children and adolescents. JAMA. 2012;307(7):704–12.
11. Funtikova AN, Navarro E, Bawaked RA, Fíto M, Schröder H. Impact of diet on
cardiometabolic health in children and adolescents. Nutr J. 2015;14(1):118.
12. Johnson BJ, Bell LK, Zarnowiecki D, Rangan AM, Golley RK. Contribution of
Discretionary Foods and Drinks to Australian Children's Intake of Energy,
Saturated Fat, Added Sugars and Salt. Children. 2017;4(12):104.
13. Australian Institue of Health and Welfare. Physical activity across the life
stages. Cat. no. PHE 225. Canberra AIHW; 2018.
14. Ho M, Garnett SP, Baur L, Burrows T, Stewart L, Neve M, et al. Effectiveness
of lifestyle interventions in child obesity: systematic review with metaanalysis. Pediatrics. 2012;130(6):e1647–e71.
15. Ben Ounis O, Elloumi M, Amri M, Zbidi A, Tabka Z, Lac G. Impact of diet,
exercise and diet combined with exercise programs on plasma lipoprotein
and adiponectin levels in obese girls. J Sports Sci Med. 2008;7(4):437–45.
16. Brown T, Moore THM, Hooper L, Gao Y, Zayegh A, Ijaz S, Elwenspoek M,
Foxen SC, Magee L, O'Malley C, Waters E, Summerbell CD. Interventions for
preventing obesity in children. Cochrane Database System Rev. 2019;(7):
CD001871. https://doi.org/10.1002/14651858.CD001871.pub4.
Mayr et al. BMC Pediatrics
Page 16 of 16
(2020) 20:174
17. Wang Y, Cai L, Wu Y, Wilson R, Weston C, Fawole O, et al. What childhood
obesity prevention programmes work? A systematic review and metaanalysis. Obes Rev. 2015;16(7):547–65.
18. Smith CF, Heneghan C, Ward A. Moving Focus from Weight to Health. What
Are the Components Used in Interventions to Improve Cardiovascular
Health in Children? PLoS One. 2015;10(8):e0135115.
19. Harter S, Whitesell NR. Beyond the debate: why some adolescents report
stable self-worth over time and situation, whereas others report changes in
self-worth. J Pers. 2003;71(6):1027–58.
20. Lowry KW, Sallinen BJ, Janicke DM. The effects of weight management
programs on self-esteem in pediatric overweight populations. J Pediatr
Psychol. 2007;32(10):1179–95.
21. Dudley DA, Cotton WG, Peralta LR. Teaching approaches and strategies that
promote healthy eating in primary school children: a systematic review and
meta-analysis. Int J Behav Nutr Phys Act. 2015;12(1):28.
22. Hoffmann TC, Glasziou PP, Boutron I, Milne R, Perera R, Moher D, et al.
Better reporting of interventions: template for intervention description and
replication (TIDieR) checklist and guide. BMJ. 2014;348:g1687.
23. World Medical Association. World Medical Association Declaration of
Helsinki: ethical principles for medical research involving human subjects.
https://www.wma.net/what-we-do/medical-ethics/declaration-of-helsinki/.
Accessed 14 Feb 2018.
24. Eldridge SM, Chan CL, Campbell MJ, Bond CM, Hopewell S, Thabane L, et al.
CONSORT 2010 statement: extension to randomised pilot and feasibility
trials. Pilot Feasibility Stud. 2016;2(1):64.
25. ACC DA, Roschel H, Picanço AR, do DML P, SMF V, de Sá Pinto AL, et al.
Similar health benefits of endurance and high-intensity interval training in
obese children. PLoS One. 2012;7(8):e42747.
26. van Biljon A, McKune AJ, DuBose KD, Kolanisi U, Semple SJ. Do short-term
exercise interventions improve Cardiometabolic risk factors in children? J
Pediatr. 2018;203:325–9.
27. Bartlett JD, Close GL, MacLaren DP, Gregson W, Drust B, JPJJoss M. Highintensity interval running is perceived to be more enjoyable than
moderate-intensity continuous exercise: implications for exercise adherence.
J Sports Sci. 2011;29(6):547–53.
28. Dias KA, Coombes JS, Green DJ, Gomersall SR, Keating SE, Tjonna AE, et al.
Effects of exercise intensity and nutrition advice on myocardial function in
obese children and adolescents: a multicentre randomised controlled trial
study protocol. BMJ Open. 2016;6(4):e010929.
29. Nes B, Janszky I, Wisløff U, Støylen A, Karlsen T. Age-predicted maximal
heart rate in healthy subjects: the HUNT fitness S tudy. Scand J Med Sci
Sports. 2013;23(6):697–704.
30. Clifford D, Ozier A, Bundros J, Moore J, Kreiser A, Morris MN. Impact of nondiet approaches on attitudes, behaviors, and health outcomes: A systematic
review. J Nutr Educ Behav. 2015;47(2):143–55 e1.
31. National Health and Medical research Council. Australian Dietary Guidelines.
Canberra: NHMRC; 2013.
32. Flint GA, Lammers W, Mitnick DG. Emotional freedom techniques. J Aggress
Maltreat Trauma. 2006;12(1–2):125–50.
33. Thriving Now Support. Thriving Now; Free EFT Tapping Point Images. 2013.
https://www.thrivingnow.com/free-eft-tapping-point-images/. Accessed 10
Mar 2018.
34. Stapleton P, Chatwin H, William M, Hutton A, Pain A, Porter B, et al.
Emotional freedom techniques in the treatment of unhealthy eating
behaviors and related psychological constructs in adolescents: A
randomized controlled pilot trial. Explore. 2016;12(2):113–22.
35. Kristeller JL, Wolever RQ. Mindfulness-based eating awareness training for
treating binge eating disorder: the conceptual foundation. Eat Disord. 2010;
19(1):49–61.
36. Jeukendrup A, GJIjosm W. Measurement of substrate oxidation during
exercise by means of gas exchange measurements. Int J Sports Med. 2005;
26(S 1):S28–37.
37. Kuczmarski RJ, Ogden CL, Guo SS, Grummer-Strawn LM, Flegal KM, Mei Z,
et al. 2000 CDC growth charts for the United States; methods and
development. Vital Health Stat. 2002;246:1–190.
38. Forman DE, Myers J, Lavie CJ, Guazzi M, Celli B, Arena R. Cardiopulmonary
exercise testing: relevant but underused. Postgrad Med. 2010;122(6):68–86.
39. Dias KA, Ingul CB, Tjønna AE, Keating SE, Gomersall SR, Follestad T, et al.
Effect of high-intensity interval training on fitness, fat mass and
cardiometabolic biomarkers in children with obesity: a randomised
controlled trial. Sports Med. 2018;48(3):733–46.
40. Soenen S, Plasqui G, Smeets AJ, Westerterp-Plantenga MS. Protein intake
induced an increase in exercise stimulated fat oxidation during stable body
weight. Physiol Behav. 2010;101(5):770–4.
41. Purdom T, Kravitz L, Dokladny K, Mermier C. Understanding the factors that
effect maximal fat oxidation. J Int Soc Sports Nutr. 2018;15(1):3.
42. Watson JF, Collins CE, Sibbritt DW, Dibley MJ, Garg ML. Reproducibility and
comparative validity of a food frequency questionnaire for Australian
children and adolescents. Int J Behav Nutr Phys Act. 2009;6(1):62.
43. Burrows TL, Truby H, Morgan PJ, Callister R, Davies PSW, Collins CE. A
comparison and validation of child versus parent reporting of children's
energy intake using food frequency questionnaires versus food records:
Who's an accurate reporter? Clin Nutr. 2013;32(4):613–8.
44. Marshall S, Watson J, Burrows T, Guest M, Collins CE. The development and
evaluation of the Australian child and adolescent recommended food score:
a cross-sectional study. Nutr J. 2012;11(1):96.
45. Piers EV, Herzberg DS. Piers-Harris 2: Piers-Harris children's self-concept scale:
Western psychological services; 2002.
46. Liu-Seifert H, Zhang S, D'Souza D, Skljarevski V. A closer look at the baselineobservation-carriedforward (BOCF). Patient Prefer Adherence. 2010;4:11–6.
47. Lai HP, Miles RM, Bredin SS, Kaufman KL, Chua CZ, Hare J, et al. “With Every
Step, We Grow Stronger”: The Cardiometabolic Benefits of an IndigenousLed and Community-Based Healthy Lifestyle Intervention. J Clin Med. 2019;
8(4):422.
48. Lunt H, Draper N, Marshall HC, Logan FJ, Hamlin MJ, Shearman JP, et al.
High intensity interval training in a real world setting: a randomized
controlled feasibility study in overweight inactive adults, measuring change
in maximal oxygen uptake. PLoS One. 2014;9(1):e83256.
49. Jelalian E, Sato A, Hart CN. The effect of group-based weight-control
intervention on adolescent psychosocial outcomes: Perceived peer
rejection, social anxiety, and self-concept. Child Health Care. 2011;40(3):
197–211.
50. Rasmussen M, Laumann K. The academic and psychological benefits of
exercise in healthy children and adolescents. Eur J Psychol Educ. 2013;28(3):
945–62.
51. Burrows T, Warren J, Baur L, Collins C. Impact of a child obesity intervention
on dietary intake and behaviors. Int J Obes. 2008;32(10):1481.
Publisher’s Note
Springer Nature remains neutral with regard to jurisdictional claims in
published maps and institutional affiliations.
Academia.edu no longer supports Internet Explorer.
To browse Academia.edu and the wider internet faster and more securely, please take a few seconds to upgrade your browser.
Multidisciplinary lifestyle intervention in the obese: its impact on patients’ perception of the disease, food and physical exercise
2012
...Read more
Related Papers
Primary Health Care Research & Development, 2022
Download
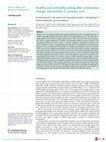
Preventive Medicine, 2003
Download

The American Journal of Clinical Nutrition, 2008
Download

Family medicine, 2006
Download

Download
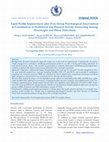

Nutrition, 2004
Download
International journal of environmental research and public health, 2018
Download


CAESURAE: POETICS OF CULTURAL TRANSLATION, 2022
Download

International Journal of Medical and Surgical Sciences, 2018
Download

