Intelligence 35 (2007) 59 – 68
Psychometric intelligence and achievement: A cross-lagged
panel analysis ☆
Marley W. Watkins a,⁎, Pui-Wa Lei a , Gary L. Canivez b
a
Pennsylvania State University, Department of Educational and School Psychology and Special Education, 125 CEDAR Building, University Park,
PA 16802, United States
b
Eastern Illinois University, United States
Received 13 January 2006; received in revised form 1 April 2006; accepted 18 April 2006
Available online 5 June 2006
Abstract
There has been considerable debate regarding the causal precedence of intelligence and academic achievement. Some
researchers view intelligence and achievement as identical constructs. Others believe that the relationship between intelligence and
achievement is reciprocal. Still others assert that intelligence is causally related to achievement. The present study addressed this
debate with a cross-lagged panel analysis of WISC-III and achievement test scores of 289 students assessed for special education
eligibility with a test–retest interval of 2.8 years. The optimal IQ–achievement model reflected the causal precedence of IQ on
achievement. That is, the paths from IQ scores at time 1 to IQ and achievement scores at time 2 were significant whereas the paths
from achievement scores at time 1 to IQ scores at time 2 were not significant. Within the limits imposed by the design and sample,
it appears that psychometric IQ is a causal influence on future achievement measures whereas achievement measures do not
substantially influence future IQ scores.
© 2006 Elsevier Inc. All rights reserved.
Keywords: Intelligence; Achievement; Causality; Longitudinal
Tests of intelligence and academic achievement are
ubiquitous in American schools. For example, it is
estimated that school psychologists administer between
1.5 and 1.8 million intelligence tests each year (Gresham &
Witt, 1997), resulting in more than five million students
enrolled in special education programs (Kamphaus,
☆
Note: This research was supported, in part, by an Eastern Illinois
University Faculty Development Grant and a Pennsylvania State
University College of Education Alumni Society Faculty Research
Initiation Grant. The authors wish to express their gratitude to the
school psychologists who generously responded to our request for
data.
⁎ Corresponding author.
E-mail address: mww10@psu.edu (M.W. Watkins).
0160-2896/$ - see front matter © 2006 Elsevier Inc. All rights reserved.
doi:10.1016/j.intell.2006.04.005
Petoskey, & Rowe, 2000). While more difficult to count,
evaluations by clinical psychologists are also likely to
include tests of intelligence and achievement (Budd, Felix,
Poindexter, Naik-Polan, & Sloss, 2002).
In current usage, intelligence tests are thought to
measure general reasoning skills that are predictive of
academic achievement (Parker & Benedict, 2002). Indeed,
concurrent IQ–achievement correlations are substantial
(Naglieri & Bornstein, 2003) and, consequently, comparisons of IQ and achievement scores constitute one of the
primary methods of diagnosing learning disabilities (Yen,
Konold, & McDermott, 2004). However, intelligence and
achievement tests often contain some items or tasks that
appear to access information that is taught in school (i.e.,
�60
M.W. Watkins et al. / Intelligence 35 (2007) 59–68
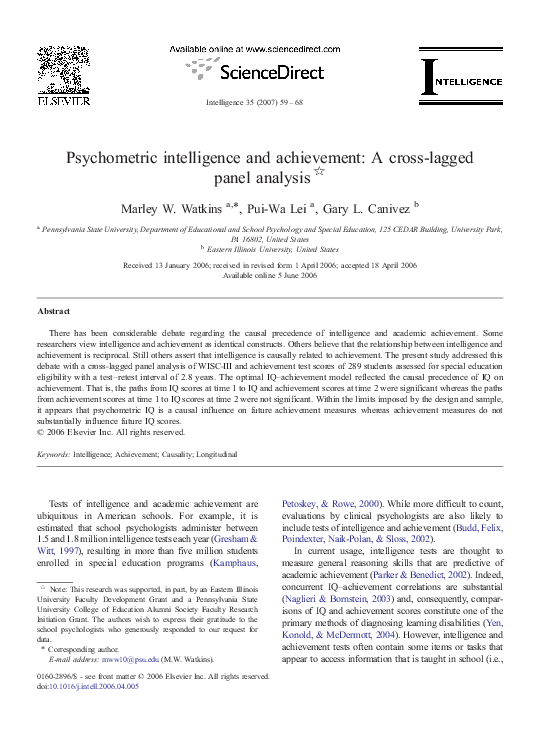
Fig. 1. Conceptual model of a cross-lag design for IQ and achievement
measured on two sequential occasions.
vocabulary, arithmetic) and there has been considerable
debate regarding the separateness or distinctiveness of
intelligence and academic achievement (Flanagan,
Andrews, & Genshaft, 1997; Lubinski & Dawis, 1992).
This apparent overlap in test coverage, among other factors,
has led some to view intelligence and achievement as
identical constructs. For example, Ceci (1991) asserted
that, “the contents of achievement tests and the contents of
so-called intellectual aptitude tests as they are currently
constructed are highly similar and inseparable both theoretically and statistically” (p. 708). Others have suggested
that the relationship between intelligence test scores and
educational achievement is reciprocal, mutually influencing each other (Brody, 1997). This interactivist view was
exemplified by Stanovich's (1986) Matthew effect: the
“tendency of reading itself to cause further development in
other related cognitive abilities, i.e., IQ, such that “the rich
get richer and the poor get poorer” (p. 21). Subsequently,
special education researchers have suggested that only
achievement tests should be used to identify children with
learning disabilities (Fletcher, Morris, & Lyon, 2003;
Siegel, 1989, 1999). Finally, some researchers assert that
intelligence is causally related to achievement (Jensen,
2000).
This debate is not new. The same questions regarding
the relationship between intelligence and achievement have
been asked for decades. As cogently stated by Crano,
Kenny, and Campbell (1972), “does the acquisition of
specific skills or the learning of specific information
Fig. 2. Final simplified, longitudinal, cross-lagged model of IQ and achievement across time. Note: Suffix of 1 indicates time 1 and suffix of 2
indicates time 2 testing. Nonsignificant loadings deleted for simplicity. PC = Picture Completion, IN = Information, SM = Similarities, PA = Picture
Arrangement, BD = Block Design, VO = Vocabulary, OA = Object Assembly, CM = Comprehension, Basic = basic word reading, Comp = reading
comprehension, Calc = math calculation, Reas = math reasoning, VC = Verbal Comprehension, and PO = Perceptual Organization. Correlations
between errors of SM1 and SM2, Comp1 and Comp2, and Reas1 and Reas2 are fixed to 0; errors between the remaining pairs of time 1 and time 2
measures are free. Parameter estimates are standardized.Fig. 3. Model 1. Note: Suffix of 1 indicates time 1 and suffix of 2 indicates time 2 testing.
VC = WISC-III Verbal Comprehension and PO = WISC-III Perceptual Organization. Parameter estimates are standardized.
�M.W. Watkins et al. / Intelligence 35 (2007) 59–68
(achievement) result in an increased ability for abstraction
(intelligence), or is the progression more accurately described as one in which intelligence causes achievement”
(p. 259). Unfortunately, most attempts to answer this
question have been correlational in nature, resulting in
equivocal conclusions (Ceci, 1991). True experiments are
required to answer these questions (Cook & Campbell,
1979), but are probably impossible to conduct. Consequently, longitudinal designs where both intelligence and
achievement tests are repeated across time have been
recommended (Crano et al., 1972).
A conceptual example of such a longitudinal design is
illustrated in Fig. 1. IQ and achievement are symbolized
by circles and are labeled IQ1 and IQ2 (for IQ at time 1
and time 2, respectively) and Ach1 (achievement at time
1) and Ach2 (achievement at time 2). The test–retest
correlations of IQ and achievement are represented by
rIQ1·IQ2 and rAch1·Ach2 and the concurrent criterionrelated validity coefficients by rIQ1·Ach1 and rIQ2·Ach2.
Given reliable tests, stability and criterion-related
validity coefficients should be high, making negative
relationships between IQ and achievement implausible.
The relationship between IQ at time 1 and achievement
at time 2 (rIQ1·Ach2) versus the relationship of achievement at time 1 and IQ at time 2 (rAch1·IQ2) are the critical
coefficients. If IQ is seminal, then rIQ1·Ach2 should
exceed rAch1·IQ2. In contrast, rAch1·IQ2 should be greater
than rIQ1·Ach2 if achievement is a precursor to IQ. No
difference between these coefficients would suggest that
no causal relationship exists or that a third, unmeasured
variable causes both IQ and achievement.
Following this logic, Crano et al. (1972) investigated
the longitudinal relationship between IQ and achievement among 5495 Milwaukee students attending fourth
grade in 1963–1964. These students were administered
the 1957 version of the Lorge–Thorndike intelligence
test and the Iowa Tests of Basic Skills (ITBS) and two
years later, when in the sixth grade, parallel forms of
those tests. Composite scores were created from the
verbal and nonverbal scales of the Lorge–Thorndike
and the 11 subscales of the ITBS. In terms of Fig. 1,
rIQ1·Ach2 was .747 and rAch1·IQ2 was .727. The former
coefficient was statistically significantly larger than the
later, and Crano et al. (1972) concluded that, “the
preponderant causal sequence is apparently in the
direction of intelligence directly predicting later
achievement to an extent significantly exceeding that
to which achievement causes later intelligence” (p. 266).
However, this conclusion was undermined by violation
of statistical assumptions (Rogosa, 1980), directional
differences between urban and suburban subsamples,
and the use of composite scales.
61
Although not discussed by Crano et al. (1972), their
conclusions were also weakened by reliance on group
administered IQ and achievement tests. Although efficient,
group administered tests share the same method (i.e.,
paper-and-pencil format) and are susceptible to common
weaknesses (i.e., errors in responding, motivation, reading
skill, etc.). Thus, a more definitive view of the causal
relationship between ability and achievement might be
obtained if individually administered tests of IQ and
achievement were used.
Additionally, Crano et al. (1972) relied on observed
variables for their analyses. Observed variables are
contaminated by measurement error and, thus, the
relationships between observed variables can be biased
by random errors of measurement. In contrast, measurement error is statistically removed from latent variables.
Estimating relationships between latent variables simultaneously via structural equation models would provide a
clearer picture of the ability–achievement relationship
(Humphreys, 1991; Judd, Jessor, & Donovan, 1986).
Finally, the Crano et al. (1972) study relied on students in
a single school district who were tested more than
40 years ago. Contemporary data from a more widely
distributed sample is needed. Consequently, the present
study applied structural equation modeling to individually administered tests of IQ and achievement to estimate
the causal precedence of ability and achievement.
Fig. 3. Model 1. Note: Suffix of 1 indicates time 1 and suffix of 2
indicates time 2 testing. VC = WISC-III Verbal Comprehension and
PO = WISC-III Perceptual Organization. Parameter estimates are
standardized. Solid path coefficients are statistically significant,
p b .05. Dotted path coefficients are not statistically significant.
�62
M.W. Watkins et al. / Intelligence 35 (2007) 59–68
1. Method
1.1. Participants
Participants were 289 students (192 male and 97 female) twice tested with the Wechsler Intelligence Scale for
Children-Third Edition (WISC-III; Wechsler, 1991) for
determination of eligibility for special education services.
Ethnicity was 78.2% Caucasian, 5.2% Hispanic/Latino,
10.4% Black/African American, 1.0% Native American/
American Indian, and 5.2% Other/Missing. Students were
diagnosed by multidisciplinary evaluation teams according to state and federal guidelines governing special education classification. Special education diagnosis upon
initial evaluation included 68.2% learning disability, 8.0%
emotional disability, 8.0% mental retardation, 4.5% unspecified, 8.2% other disabilities, and 3.1% not disabled.
The mean test–retest interval was 2.8 years (SD = .50)
with a range of .70 to 4.0 years. However, only 3 students
were retested within one year and only 14 within two
years. The mean age of students at first testing was
9.25 years and ranged from 6.0 to 13.9 years. The mean
age of students at second testing was 12.08 and ranged
from 8.0 to 16.9 years. Additional detailed demographic
information may be obtained from Canivez and Watkins
(1998, 1999, 2001).
1.2. Instruments
Fig. 4. Model 2. Note. Suffix of 1 indicates time 1 and suffix of 2
indicates time 2 testing. VC = WISC-III Verbal Comprehension and
PO = WISC-III Perceptual Organization. Parameter estimates are
standardized. Solid path coefficients are statistically significant,
p b .05. Dotted path coefficients are not statistically significant.
The WISC-III is an individually administered test of
intelligence for children aged 6 years through 16 years,
11 months that was standardized on a nationally representative sample (N = 2200) closely approximating the
1988 United States Census on gender, parent education
(SES), race/ethnicity, and geographic region. The WISCIII has 13 individual subtests (M = 10, SD = 3), ten standard and three supplementary, that combine to yield
three composite scores: Verbal (VIQ), Performance
(PIQ), and Full Scale (FSIQ) IQs (M = 100, SD = 15).
In addition, the WISC-III provides four factor-based
index scores: Verbal Comprehension (VC), Perceptual
Organization (PO), Freedom from Distractibility (FD),
and Processing Speed (PS) (M = 100, SD = 15). Given
that the VC and PO factors are robust across exceptional populations (Watkins & Kush, 2002), those
two factors were included in this study. Eight subtests
compose the VC (Information, Vocabulary, Similarities, and Comprehension) and PO (Object Assembly,
Block Design, Picture Completion, and Picture Arrangement) factors. Full details of the WISC-III and its
standardization are presented in Wechsler (1991). Additional reliability and validity data are provided by
Sattler (2001) as well as Zimmerman and Woo-Sam
(1997).
Fig. 5. Model 3. Note. Suffix of 1 indicates time 1 and suffix of 2
indicates time 2 testing. VC = WISC-III Verbal Comprehension and
PO = WISC-III Perceptual Organization. Parameter estimates are
standardized. Solid path coefficients are statistically significant,
p b .05. Dotted path coefficients are not statistically significant.
�M.W. Watkins et al. / Intelligence 35 (2007) 59–68
Fig. 6. Model 4. Note. Suffix of 1 indicates time 1 and suffix of 2
indicates time 2 testing. VC = WISC-III Verbal Comprehension and
PO = WISC-III Perceptual Organization. Parameter estimates are
standardized. Solid path coefficients are statistically significant,
p b .05. Dotted path coefficients are not statistically significant.
Academic achievement was measured by a total of 5
tests or combinations of tests. However, contemporary
versions of the Woodcock–Johnson Tests of Achievement, Wechsler Individual Achievement Test, and Kaufman Test of Educational Achievement were used in more
than 90% of the cases. In reading, all achievement tests
included separate basic word reading and reading comprehension subtests (M = 100, SD = 15). In math, separate
calculation and reasoning subtests (M = 100, SD = 15)
were available for all academic achievement instruments.
1.3. Procedure
Two thousand school psychologists were randomly
selected from the National Association of School
Psychologists membership roster and invited via mail to
participate by providing test scores and demographic data
obtained from recent special education triennial reevaluations. Data were voluntarily submitted on 667 cases by
145 school psychologists from 33 states. Of these cases,
289 contained scores for the requisite eight WISC-III and
four academic achievement subtests. These 289 cases
were provided by 67 school psychologists from 27 states.
1.4. Analyses
There were no serious departures from univariate
normality (Onwuegbuzie & Daniel, 2002). Univariate
63
skewness of the 24 variables (12 at time 1 and 12 at time 2)
ranged from −.31 to .54 and univariate kurtosis ranged
from −.41 to 2.12 (Mardia's normalized multivariate
kurtosis = 5.88). EQS (Bentler, 2002; Bentler & Wu,
2002) was used for model estimation, and robust
maximum likelihood solutions with Satorra and Bentler
(1994) correction to chi-square and standard error estimates were requested. Because the robust solution was
very similar to the normal theory solution and the chisquare difference was of primary interest for model
comparisons, without loss of generality the normal theory
maximum likelihood solution was reported.
The two-step modeling strategy for hybrid models
(Kline, 1998, p. 251–252) was followed. The first step was
to identify a measurement model that fit the data
satisfactorily and the second step was to explore the
structural relationship among the latent variables. An 8factor (4 factors for each time point: 2 WISC-III factors
[VC and PO]1 and 2 achievement factors [reading and
math]) confirmatory factor analysis (CFA) model was
fitted to the data allowing errors of the same variable across
time to correlate for each variable and all factors to be intercorrelated (Fig. 2 shows how the observed variables
loaded on the factors). One loading for each latent factor
was fixed to 1 to set its scale, and the covariance matrix
was analyzed. The final CFA model, with the across-time
correlated errors for similarities (SM), reading comprehension (Comp), and Mathematical reasoning (Reas)
excluded because they were statistically non-significant
at the .05 level, fit the data reasonably well (χ2 = 370.51,
df = 215, RMSEA = .05, SRMR = .047, CFI = .97). All
factor loadings were statistically significant at the .05
level, as were factor covariances. The acceptable fit of this
CFA model to the data lent support to the separability of
the measured intelligence and achievement constructs.
The factor loadings were similar across time 1 and time
2, suggesting that the measures were likely invariant.
1
With only two first-order ability factors (VC and PO), a secondorder factor (g) could not be statistically identified. Even if a
constraint was imposed to allow the model to be identified, the
second-order model would have been statistically equivalent to the
first-order model and, therefore, non-informative. Oh, Glutting,
Watkins, Youngstrom, and McDermott (2004) demonstrated that both
g and VC contributed to the prediction of academic achievement,
although g was at least three times more important than VC. Similar
results have been reported for other measures of intelligence
(Gustafsson & Balke, 1993; Keith, 1999; Glutting, Watkins, Konold,
& McDermott, in press). In short, when general and specific ability
constructs are compared to achievement constructs, g usually
accounts for the largest proportion of variance in achievement.
Consequently, psychometric intelligence or ability in this study
contained variance attributable to the first-order factors (VC and PO)
as well as variance from the unmodeled second-order g factor.
�64
M.W. Watkins et al. / Intelligence 35 (2007) 59–68
achievement factors had a direct path to its time 2
achievement factor.
M3: Each of the achievement time 1 factors had direct
paths to all four time 2 factors, and each of the
time 1 IQ factors had a direct path to its time 2 IQ
factor.
M4: Each of the IQ time 1 factors had a direct path to
its time 2 factor and to both time 2 achievement
factors, while each of the time 1 achievement
factors had a direct path to its time 2 achievement
factor alone.
M5: Each of the achievement time 1 factors had a
direct path to its time 2 factor and to both time 2
IQ factors, while each of the time 1 IQ factors had
a direct path to its time 2 IQ factor alone.
Fig. 7. Model 5. Note. Suffix of 1 indicates time 1 and suffix of 2
indicates time 2 testing. VC = WISC-III Verbal Comprehension and
PO = WISC-III Perceptual Organization. Parameter estimates are
standardized. Solid path coefficients are statistically significant,
p b .05. Dotted path coefficients are not statistically significant.
Watkins and Canivez (2001) demonstrated factor invariance across time for these same WISC-III subtests.
However, it was not clear if the achievement subtests
were also invariant across time. A CFA model constraining
the factor loadings for WISC-III factors [VC and PO] and
achievement factors [reading and math] to be equal across
time 1 and time 2 was examined to test this factorial
invariance hypothesis. The model provided similar
parameter estimates and similar overall model fit to the
original CFA model (χ2 = 390.62, df= 223, RMSEA = .051,
SRMR = .054, CFI =.99), suggesting that the same constructs were measured across time. Because the primary
interest of the study was the structural relations among the
time 1 and time 2 factors and because a better fitting CFA
model would provide a better baseline model for that
purpose, structural relations were tested based on the original CFA model.
Causal hypotheses among the latent factors were
tested while the measurement part of the hybrid model
remained the same as the final CFA model described
above. The structural models of interest are listed below
(see Figs. 3–7):
M1: All four time 1 latent factors had direct paths to all
four time 2 factors.
M2: Each of the IQ time 1 factors had direct paths to all
four time 2 factors, and each of the time 1
M1 was the most general among the five models and
was expected to provide the best model-data fit. If
intelligence and achievement mutually influence each
other as suggested by Ceci and Williams (1997), then all
structural path coefficients from time 1 to time 2 of M1
would be similar in magnitude and perhaps statistically
significant. However, if intelligence was causally related
to achievement as suggested by Jensen (2000), then M2
would not be significantly worse than M1 in terms of
overall model fit and M2 would provide a better modeldata fit than M3.
M4 was similar to M2 except that time 1 IQ factors
were allowed to affect their respective time 2 factors only.
M5 was similar to M3 except that time 1 achievement
factors were allowed to affect their respective time 2
Table 1
Wechsler Intelligence Scale for Children-Third Edition and
achievement scores of 289 students twice tested for special education
eligibility
Time 1
Picture Completion
Information
Similarities
Picture Arrangement
Block Design
Vocabulary
Object Assembly
Comprehension
Full scale IQ
Verbal Comprehension Index
Perceptual Organization Index
Basic word reading
Reading comprehension
Math calculation
Math reasoning
Time 2
Mean
SD
Mean
SD
8.7
7.8
8.2
8.6
8.5
8.2
8.4
8.9
89.6
91.2
92.5
82.9
85.5
86.9
91.4
3.2
3.1
3.2
3.6
3.6
3.0
3.4
3.6
15.0
14.9
16.6
14.0
13.8
15.2
15.5
9.0
8.1
8.6
9.0
8.3
7.5
8.6
8.4
89.3
90.7
93.6
84.0
89.0
85.9
91.9
3.3
3.1
3.1
4.0
4.1
2.9
3.6
3.6
16.3
14.9
18.3
14.8
15.7
17.5
15.9
�65
M.W. Watkins et al. / Intelligence 35 (2007) 59–68
Table 2
Correlation matrices for Wechsler Intelligence Scale for Children-Third Edition and achievement subtest scores at time 1 (lower triangle) and time 2
(upper triangle)
PC
IN
SM
PA
BD
VO
OA
CM
Basic
Comp
Calc
Reas
PC
IN
SM
PA
BD
VO
OA
CM
Basic
Comp
Calc
Reas
1
0.41
0.46
0.55
0.61
0.43
0.56
0.49
0.20
0.28
0.38
0.42
0.46
1
0.65
0.44
0.37
0.64
0.27
0.61
0.47
0.53
0.52
0.62
0.51
0.66
1
0.46
0.46
0.64
0.36
0.56
0.44
0.48
0.48
0.58
0.51
0.51
0.51
1
0.53
0.44
0.52
0.48
0.23
0.34
0.43
0.48
0.59
0.55
0.60
0.62
1
0.43
0.66
0.40
0.24
0.30
0.38
0.50
0.54
0.73
0.75
0.54
0.58
1
0.32
0.66
0.42
0.41
0.41
0.54
0.60
0.42
0.46
0.55
0.67
0.48
1
0.42
0.13
0.20
0.33
0.42
0.45
0.59
0.66
0.56
0.53
0.72
0.47
1
0.32
0.36
0.42
0.58
0.24
0.56
0.42
0.29
0.37
0.49
0.20
0.36
1
0.79
0.53
0.48
0.35
0.64
0.54
0.47
0.50
0.60
0.32
0.50
0.78
1
0.58
0.58
0.39
0.62
0.55
0.52
0.53
0.57
0.39
0.55
0.57
0.66
1
0.73
0.44
0.70
0.63
0.52
0.58
0.67
0.43
0.65
0.55
0.70
0.80
1
Note: PC = Picture Completion, IN = Information, SM = Similarities, PA = Picture Arrangement, BD = Block Design, VO = Vocabulary, OA = Object
Assembly, CM = Comprehension, Basic = basic word reading, Comp = reading comprehension, Calc = math calculation, Reas = math reasoning.
time in Table 3. Although somewhat lower than the
WISC-III standardization sample, IQ scores were
consistent with other samples of students with disabilities (Kavale & Nye, 1985–86). The average correlation
between IQ scores at time 1 and achievement scores at
time 2 was .466 whereas the average correlation between
achievement scores at time 1 and IQ scores at time 2 was
.398. As per the conceptual framework illustrated in
Fig. 1, rIQ1·Ach2 N rAch1·IQ2 provides preliminary support
for the causal precedence of IQ scores.
The model fit indices for M1 to M5 are provided in
Table 4 and the path coefficients are illustrated in Figs.
3–7. Fit criteria were those identified by Hu and Bentler
(1999) as most likely to protect against both Type I and
Type II errors: critical values of ≥ .96 for CFI combined
factors only. If VC and PO did not influence each other,
then M4 would not provide a significantly worse fit than
M2. Similarly, if reading and math achievement did not
influence each other, M5 would not provide a significantly worse fit than M3. In that case, Jensen's (2000)
hypothesis could be tested by comparing the relative fit of
M4 and M5.
2. Results
Descriptive statistics for the WISC-III IQ and factor
index scores across test and retest occasions are
presented in Table 1, the correlations between IQ and
achievement tests at both times in Table 2, and the
correlations between IQ and achievement tests across
Table 3
Correlation matrices for Wechsler Intelligence Scale for Children-Third Edition and achievement subtest scores across time
Time 1
Time 2
PC
IN
SM
PA
BD
VO
OA
CM
Basic
Comp
Calc
Reas
PC
IN
SM
PA
BD
VO
OA
CM
Basic
Comp
Calc
Reas
0.63
0.48
0.51
0.55
0.61
0.54
0.59
0.46
0.23
0.40
0.38
0.43
0.38
0.75
0.61
0.43
0.45
0.66
0.34
0.58
0.48
0.58
0.54
0.63
0.45
0.61
0.63
0.39
0.51
0.63
0.36
0.57
0.44
0.55
0.51
0.58
0.48
0.48
0.48
0.68
0.57
0.54
0.50
0.54
0.24
0.45
0.48
0.52
0.60
0.48
0.53
0.54
0.80
0.51
0.62
0.46
0.30
0.44
0.45
0.50
0.43
0.61
0.63
0.46
0.48
0.75
0.39
0.60
0.46
0.54
0.48
0.57
0.57
0.38
0.42
0.48
0.68
0.44
0.68
0.41
0.24
0.39
0.40
0.46
0.46
0.56
0.57
0.47
0.47
0.69
0.46
0.71
0.37
0.48
0.48
0.59
0.17
0.51
0.39
0.22
0.26
0.41
0.14
0.30
0.78
0.65
0.48
0.44
0.25
0.46
0.41
0.31
0.32
0.40
0.21
0.33
0.67
0.65
0.51
0.48
0.37
0.50
0.49
0.39
0.45
0.44
0.33
0.39
0.49
0.57
0.66
0.60
0.46
0.62
0.59
0.49
0.55
0.60
0.41
0.57
0.47
0.63
0.66
0.75
Note: PC = Picture Completion, IN = Information, SM = Similarities, PA = Picture Arrangement, BD = Block Design, VO = Vocabulary, OA = Object
Assembly, CM = Comprehension, Basic = basic word reading, Comp = reading comprehension, Calc = math calculation, Reas = math reasoning. Bold
diagonal entries are test–retest coefficients.
�66
M.W. Watkins et al. / Intelligence 35 (2007) 59–68
Table 4
Fit indices for five hypothesized IQ–achievement models
Models
χ2
df
CFI RMSEA SRMR χ2 Δ
221
227
227
229
M1
M2
M3
M4
437.32
439.94
448.28
465.46
.961
.962
.959
.957
.059
.058
.060
.061
.049
.049
.049
.051
M5
531.81 229 .947
.068
.064
––
vs. M1: χ26 = 2.62
vs. M1: χ26 = 10.96
vs. M2: χ22 = 25.52⁎
vs. M1: χ28 = 28.14⁎
vs. M3: χ22 = 83.53⁎
vs. M1: χ28 = 94.49⁎
Note. χ28,95 = 15.51, χ26,95 = 12.59, χ22,95 = 5.991.
⁎p b .05.
with values ≤.06 for the RMSEA and ≤.08 for the
SRMR index. According to these criteria, the data fit
M1, M2, and M3 quite well. However, several paths of
M1 (mostly achievement at time 1 to IQ at time 2) were
small in magnitude and not statistically significant. M2
was not significantly worse that M1. Removal of the
nonsignificant achievement to IQ paths from M1
resulted in essentially the same models. Although M3
was also not significantly worse fitting than M1 by the
chi-square difference test, the chi-square difference
value (10.96) was much higher than that between M1
and M2 (2.62) for the same gain in degrees of freedom.
Additionally, several statistically significant coefficients
in M3 (Read1 → VC2, PO2, and Math2) were negative,
which made little theoretical sense, and there was an
out-of-bound standardized path coefficient (N 1.0 for
Math1 → Math2). Given these anomalies, the solution of
M3 did not seem interpretable. M4 was significantly
worse than M2 and M5 was significantly worse than
M3. Hence, models M3, M4, and M5 were not selected.
M2 was deemed to be the most parsimonious model that
best fit the data. The final simplified, longitudinal, crosslagged model of IQ and achievement across time is
presented in Fig. 2.
3. Discussion
There has been considerable debate regarding the
separateness of psychometric IQ and academic achievement. Researchers have variously speculated that
current achievement causes future IQ, current IQ causes
future achievement, and IQ and achievement are
mutually influential. In the absence of true experiments,
longitudinal designs where both IQ and achievement
tests are repeated across time have been recommended
for estimating the relationship of IQ and achievement.
Using structural equation modeling to remove the
biasing effect of measurement error, this current crosslagged panel analysis found that the optimal ability–
achievement model reflected the causal precedence of
psychometric IQ on achievement. That is, the paths
from IQ at time 1 to IQ and achievement at time 2 were
significant whereas the paths from achievement at time
1 to IQ at time 2 were not significant.
From a theoretical perspective, the construct of
intelligence is expected to precede and influence the
development of academic achievement because “school
learning itself is g-demanding” (Jensen, 1998, p. 279).
Historically, intelligence tests were devised by Binet to
measure students' ability to succeed in school and this
fundamental characteristic has been empirically supported for more than 100 years (Kamphaus, 2001). This
notion of intelligence estimating a student's ability to
succeed in school assumes the temporal precedence of
intelligence to achievement. The concept of causality is
complex (Kenny, 1979), so terms like influence and
precedence may be preferred. Regardless, the present
study supports the view that intelligence, as measured by
the VC and PO dimensions of the WISC-III, influences or
is related to future achievement whereas reading and math
achievement do not appear to influence or are not related
to future psychometric intelligence.
From an applied perspective, researchers have asserted
that, “observed correlations between tests of reading
achievement and tests of intelligence may often be an
artifact of shared variance contributed by language based
abilities that influence performance on both sets of measures” (Vellutino, Scanlon, & Tanzman, 1998, p. 375).
Following this logic, impairments in reading would, over
time, result in deleterious effects on IQ scores, subsequently making IQ a poor predictor of achievement
among students with learning disabilities (Fletcher,
Coulter, Reschly, & Vaughn, 2004; Siegel, 1989). That
is, “low scores on the IQ tests are a consequence, not a
cause, of … reading disability” (Siegel, 1998, p. 126). This
position was not confirmed by the present results nor by
those of Kline, Graham, and Lachar (1993), who found IQ
scores to have comparable external validity for students of
varying reading skill. Nor was such a conceptualization
supported by the relatively high long-term stability of
WISC-III IQ scores among more than 1000 students with
disabilities (Canivez & Watkins, 2001; Cassidy, 1997).
Further, IQ has been a protective factor in several studies.
In a longitudinal analysis, Shaywitz et al. (2003) found
that two groups of impaired readers began school with
similar reading skills and socioeconomic characteristics,
but those students with higher cognitive ability became
significantly better readers as young adults. A metaanalysis of intervention research for adolescents with LD
demonstrated that IQ exercised similar protective effects
(Swanson, 2001). An epidemiological analysis of a
�M.W. Watkins et al. / Intelligence 35 (2007) 59–68
representative national sample of 1268 students discovered
that cognitive abilities afforded significant protection from
learning disabilities (McDermott, Goldberg, Watkins, Stanley, & Glutting, in press). Finally, a New Zealand 25-year
longitudinal study found strong relationships between IQ at
age 7 and 8 and academic achievement at ages 18–
25 years, independent of childhood conduct problems as
well as family and social circumstances (Fergusson,
Horwood, & Ridder, 2005). In sum, considerable evidence
contradicts the assertion that IQ has no predictive or
seminal relationship with academic achievement.
Although avoiding some of the weaknesses of
previous studies, the results of this investigation must be
considered within the limits of its design, sample, and
methods. First, participants were all involved in special
education. Thus, results cannot be generalized to
dissimilar students. Second, generalization of results
may be limited because these data were not obtained by
random selection. Third, there was no way to validate the
accuracy of test scores provided by participating school
psychologists. Although internal consistency of composite scores was verified during data entry, administration,
scoring, or reporting errors could have influenced results.
Finally, the use of reevaluation cases means that those
students who were no longer enrolled in special education
were not reevaluated and thus not part of the sample.
With due consideration of these caveats, the present
study provides evidence that psychometric intelligence is
predictive of future achievement whereas achievement is
not predictive of future psychometric intelligence. This
temporal precedence is consistent with the theoretical
position of Jensen (2000) that intelligence bears a causal
relationship to achievement and not the other way around.
References
Bentler, P. M. (2002). Title EQS 6 structural equations program
manual. Encino, CA: Multivariate Software, Inc.
Bentler, P. M., & Wu, E. J. C. (2002). EQS 6 for Windows user's guide.
Encino, CA: Multivariate Software, Inc.
Brody, N. (1997). Intelligence, schooling, and society. American
Psychologist, 52, 1046−1050.
Budd, K. S., Felix, E. D., Poindexter, L. M., Naik-Polan, A. T., &
Sloss, C. F. (2002). Clinical assessment of children in child
protection cases: An empirical analysis. Professional Psychology,
Research and Practice, 33, 3−12.
Canivez, G. L., & Watkins, M. W. (1998). Long term stability of the
WISC-III. Psychological Assessment, 10, 285−291.
Canivez, G. L., & Watkins, M. W. (1999). Long term stability of the
Wechsler Intelligence Scale for Children-Third Edition among
demographic subgroups: Gender, race, and age. Journal of Psychoeducational Assessment, 17, 300−313.
Canivez, G. L., & Watkins, M. W. (2001). Long term stability of the
Wechsler Intelligence Scale for Children-Third Edition among
students with disabilities. School Psychology Review, 30, 361−376.
67
Cassidy, L.C. (1997). The stability of WISC-III scores: For whom are
triennial re-evaluations necessary? Unpublished doctoral dissertation, University of Rhode Island.
Ceci, S. J. (1991). How much does schooling influence general
intelligence and its cognitive components? A reassessment of the
evidence. Developmental Psychology, 27, 703−722.
Ceci, S. J., & Williams, W. M. (1997). Schooling, intelligence, and
income. American Psychologist, 52, 1051−1058.
Cook, T. D., & Campbell, D. T. (1979). Quasi-experimentation: Design
and analysis issues for field settings. Chicago: Rand McNally.
Crano, W. D., Kenny, D. A., & Campbell, D. T. (1972). Does
intelligence cause achievement?: A cross-lagged panel analysis.
Journal of Educational Psychology, 63, 258−275.
Fergusson, D. M., Horwood, L. J., & Ridder, E. M. (2005). Show me
the child at seven II: Childhood intelligence and later outcomes in
adolescence and young adulthood. Journal of Child Psychology
and Psychiatry, 46, 850−858.
Flanagan, D. P., Andrews, T. J., & Genshaft, J. L. (1997). The
functional utility of intelligence tests with special education
populations. In D. P. Flanagan, J. L. Genshaft, & P.L. Harrison
(Eds.), Contemporary intellectual assessment: Theories, tests, and
issues (pp. 457−483). New York: Guilford.
Fletcher, J. M., Coulter, W. A., Reschly, D. J., & Vaughn, S. (2004).
Alternative approaches to the definition and identification of learning
disabilities: Some questions and answers. Annals of Dyslexia, 54,
304−331.
Fletcher, J. M., Morris, R. D., & Lyon, G. R. (2003). Classification and
definition of learning disabilities: An integrative perspective. In H.
L. Swanson, K. R. Harris & S. Graham (Eds.), Handbook of
learning disabilities (pp. 30−56). New York: Guilford.
Glutting, J.J., Watkins, M.W., Konold, T.R., & McDermott, P.A. (in
press). Distinctions without a difference: The utility of observed
versus latent factors from the WISC-IV in estimating reading and
math achievement on the WIAT-II. Journal of Special Education.
Gresham, F. M., & Witt, J. C. (1997). Utility of intelligence tests for
treatment planning, classification, and placement decisions: Recent
empirical findings and future directions. School Psychology
Quarterly, 12, 249−267.
Gustafsson, J. -E., & Balke, G. (1993). General and specific abilities as
predictors of school achievement. Multivariate Behavioral Research, 28, 407−434.
Hu, L., & Bentler, P. M. (1999). Cutoff criteria for fit indexes in
covariance structure analysis: Conventional criteria versus new
alternatives. Structural Equation Modeling, 6, 1−55.
Humphreys, L. G. (1991). Causal inferences from observational data:
Use a redesigned cross-lagged methodology. Intelligence, 15,
151−156.
Jensen, A. R. (1998). The g factor: The science of mental ability.
Westport, CT: Praeger.
Jensen, A. R. (2000). The g factor and the design of education. Paper
presented at the annual meeting of the American Psychological
Association, Washington, DC (August).
Judd, C. M., Jessor, R., & Donovan, J. E. (1986). Structural equation
models and personality research. Journal of Personality, 54, 149−198.
Kamphaus, R. W. (2001). Clinical assessment of child and adolescent
intelligence (2nd ed.). Boston: Allyn and Bacon.
Kamphaus, R. W., Petoskey, M. D., & Rowe, E. W. (2000). Current
trends in psychological testing of children. Professional Psychology, Research and Practice, 31, 155−164.
Kavale, K. A., & Nye, C. (1985–86). Parameters of learning disabilities
in achievement, linguistic, neuropsychological, and social/behavioral domains. Journal of Special Education, 19, 443−458.
�68
M.W. Watkins et al. / Intelligence 35 (2007) 59–68
Keith, T. Z. (1999). Effects of general and specific abilities on student
achievement: Similarities and differences across ethnic groups.
School Psychology Quarterly, 14, 239−262.
Kenny, D. A. (1979). Correlation and causality. New York: Wiley.
Kline, R. B. (1998). Principles and practice of structural equation
modeling. New York: The Guilford Press.
Kline, R. B., Graham, S. A., & Lachar, D. (1993). Are IQ scores valid
for children who are poor readers? Psychological Assessment, 5,
400−407.
Lubinski, D., & Dawis, R. V. (1992). Aptitudes, skills, and proficiencies.
In M. D. Dunnette & L.M. Hough (Eds.), Handbook of industrial and
organizational psychology, Vol. 3 (2nd ed.) (pp. 1−59). Palo Alto,
CA: Consulting Psychology Press.
McDermott, P.A., Goldberg, M.M., Watkins, M.W., Stanley, J.L., &
Glutting, J.J. (in press). A nationwide epidemiologic modeling
study of learning disabilities: Risk, protection, and unintended
impact. Journal of Learning Disabilities.
Naglieri, J. A., & Bornstein, B. T. (2003). Intelligence and achievement: Just how correlated are they? Journal of Psychoeducational
Assessment, 21, 244−260.
Oh, H. -J., Glutting, J. J., Watkins, M. W., Youngstrom, E. A., &
McDermott, P. A. (2004). Correct interpretation of latent versus
observed abilities: Implications from structural equation modeling
applied to the WISC-III and WIAT linking sample. Journal of
Special Education, 38, 159−173.
Onwuegbuzie, A. J., & Daniel, L. G. (2002). Uses and misuses of the
correlation coefficient. Research in the Schools, 9, 73−90.
Parker, D. R., & Benedict, K. B. (2002). Assessment and intervention:
Promoting successful transitions for college students with ADHD.
Assessment for Effective Intervention, 27(3), 3−24.
Rogosa, D. (1980). A critique of cross-lagged correlation. Psychological Bulletin, 88, 245−258.
Satorra, A., & Bentler, P. M. (1994). Corrections to test statistics and
standard errors in covariance structure analysis. In A. von Eye & C.C.
Clogg (Eds.), Latent variables analysis: Applications for developmental research (pp. 399−419). Thousand Oaks, CA: Sage.
Sattler, J. M. (2001). Assessment of children: Cognitive applications
(4th ed.). San Diego: Jerome M. Sattler.
Shaywitz, S. E., Shaywitz, B. A., Fulbright, R. K., Skudlarski, P.,
Mencl, W. E., Constable, R. T., et al. (2003). Neural systems for
compensation and persistence: Young adult outcome of childhood
reading disability. Biological Psychiatry, 54, 25−33.
Siegel, L. S. (1989). IQ is irrelevant to the definition of learning
disabilities. Journal of Learning Disabilities, 22, 469−478.
Siegel, L. S. (1998). The discrepancy formula: Its use and abuse. In B.
K. Shapiro, P. J. Accardo, & A.J. Capute (Eds.), Specific reading
disability: A view of the spectrum (pp. 123−135). Timonium, MD:
York Press.
Siegel, L. S. (1999). Issues in the definition and diagnosis of learning
disabilities: A perspective on Guckenberger v. Boston University.
Journal of Learning Disabilities, 32, 304−319.
Stanovich, K. E. (1986). Matthew effects in reading: Some consequences of individual differences in the acquisition of literacy.
Reading Research Quarterly, 21, 360−407.
Swanson, H. L. (2001). Research on interventions for adolescents with
learning disabilities: A meta-analysis of outcomes related to higherorder processing. Elementary School Journal, 101, 331−348.
Vellutino, F. R., Scanlon, D. M., & Tanzman, M. S. (1998). The case
for early intervention in diagnosing specific reading disability.
Journal of School Psychology, 36, 367−397.
Watkins, M. W., & Canivez, G. L. (2001). Longitudinal factor structure
of the WISC-III among students with disabilities. Psychology in
the Schools, 38, 291−298.
Watkins, M. W., & Kush, J. C. (2002). Confirmatory factor analysis of
the WISC-III for students with learning disabilities. Journal of
Psychoeducational Assessment, 20, 4−19.
Wechsler, D. (1991). Wechsler Intelligence Scale for Children-Third
Edition. San Antonio, TX: The Psychological Corporation.
Yen, C. -J., Konold, T. R., & McDermott, P. A. (2004). Does learning
behavior augment cognitive ability as an indicator of academic
achievement? Journal of School Psychology, 42, 157−169.
Zimmerman, I. L., & Woo-Sam, J. M. (1997). Review of the criterionrelated validity of the WISC-III: The first five years. Perceptual
and Motor Skills, 85, 531−546.
�
 Pui-wa Lei