ARTICLE IN PRESS
Planetary and Space Science 57 (2009) 1050–1067
Contents lists available at ScienceDirect
Planetary and Space Science
journal homepage: www.elsevier.com/locate/pss
Lander radioscience for obtaining the rotation and orientation of Mars
Veronique Dehant a,�, William Folkner b, Etienne Renotte c, Daniel Orban d, Sami Asmar b,
Georges Balmino e, Jean-Pierre Barriot f, Jeremy Benoist g, Richard Biancale e, Jens Biele h, Frank Budnik i,
Stefaan Burger d, Olivier de Viron j, Bernd Häusler k, Özgur Karatekin a, Sébastien Le Maistre a,
Philippe Lognonné j, Michel Menvielle l, Michel Mitrovic a, Martin Pätzold m, Attilio Rivoldini a,
Pascal Rosenblatt a, Gerald Schubert n, Tilman Spohn h, Paolo Tortora o, Tim Van Hoolst a,
Olivier Witasse p, Marie Yseboodt a
a
Royal Observatory of Belgium (ROB), 1180 Bruxelles, Belgium
Jet Propulsion Laboratory (JPL), USA
Centre Spatial de Liège (CSL), Belgium
d
Orban Microwave Products (OMP), Leuven, Belgium
e
Observatoire Midi-Pyrénées/ Groupe de Recherche de Géodésie Spatiale (GRGS)/ Centre National d’Etudes Spatiales (CNES), France
f
Université de Polynésie Franc- aise, Tahiti
g
CNES, France
h
Deutsches Zentrum für Luft-und Raumfahrt (DLR), Berlin, Germany
i
European Space Operations Centre (ESOC)/ESA, Germany
j
University Paris 7 and IPGP, Paris, France
k
Universität der Bundeswehr München, Germany
l
Centre d’Études des Environnements Terrestre et Planétaire (CETP), Paris, France
m
Universität zu Köln, Germany
n
University of California Los Angeles (UCLA), USA
o
University of Bologna, Italy
p
European Space research and Technology Centre (ESTEC)/ESA, The Netherlands
b
c
a r t i c l e in f o
a b s t r a c t
Article history:
Received 14 March 2008
Received in revised form
21 July 2008
Accepted 13 August 2008
Available online 22 August 2008
The paper presents the concept, the objectives, the approach used, and the expected performances and
accuracies of a radioscience experiment based on a radio link between the Earth and the surface of
Mars. This experiment involves radioscience equipment installed on a lander at the surface of Mars. The
experiment with the generic name lander radioscience (LaRa) consists of an X-band transponder that
has been designed to obtain, over at least one Martian year, two-way Doppler measurements from the
radio link between the ExoMars lander and the Earth (ExoMars is an ESA mission to Mars due to launch
in 2013). These Doppler measurements will be used to obtain Mars’ orientation in space and rotation
(precession and nutations, and length-of-day variations). More specifically, the relative position of the
lander on the surface of Mars with respect to the Earth ground stations allows reconstructing Mars’ time
varying orientation and rotation in space.
Precession will be determined with an accuracy better by a factor of 4 (better than the 0.1% level)
with respect to the present-day accuracy after only a few months at the Martian surface. This precession
determination will, in turn, improve the determination of the moment of inertia of the whole planet
(mantle plus core) and the radius of the core: for a specific interior composition or even for a range of
possible compositions, the core radius is expected to be determined with a precision decreasing to a few
tens of kilometers.
A fairly precise measurement of variations in the orientation of Mars’ spin axis will enable, in
addition to the determination of the moment of inertia of the core, an even better determination of the
size of the core via the core resonance in the nutation amplitudes. When the core is liquid, the free core
nutation (FCN) resonance induces a change in the nutation amplitudes, with respect to their values for a
solid planet, at the percent level in the large semi-annual prograde nutation amplitude and even more
(a few percent, a few tens of percent or more, depending on the FCN period) for the retrograde terannual nutation amplitude. The resonance amplification depends on the size, moment of inertia, and
Keywords:
Radioscience
X-band signal
Mars nutation
Mars length-of-day
� Corresponding author.
E-mail address: v.dehant@oma.be (V. Dehant).
0032-0633/$ - see front matter & 2008 Elsevier Ltd. All rights reserved.
doi:10.1016/j.pss.2008.08.009
�ARTICLE IN PRESS
V. Dehant et al. / Planetary and Space Science 57 (2009) 1050–1067
1051
flattening of the core. For a large core, the amplification can be very large, ensuring the detection of the
FCN, and determination of the core moment of inertia.
The measurement of variations in Mars’ rotation also determines variations of the angular
momentum due to seasonal mass transfer between the atmosphere and ice caps. Observations even for
a short period of 180 days at the surface of Mars will decrease the uncertainty by a factor of two with
respect to the present knowledge of these quantities (at the 10% level).
The ultimate objectives of the proposed experiment are to obtain information on Mars’ interior and
on the sublimation/condensation of CO2 in Mars’ atmosphere. Improved knowledge of the interior will
help us to better understand the formation and evolution of Mars. Improved knowledge of the CO2
sublimation/condensation cycle will enable better understanding of the circulation and dynamics of
Mars’ atmosphere.
& 2008 Elsevier Ltd. All rights reserved.
1. Scientific background and introduction
1.1. Mars’ interior and evolution
Only indirect information is currently known about the interior
of Mars. Available observations relevant to the interior are those of
the static Martian gravity field and topography, the tidal effect on
an orbiter, and the precession of the spin axis derived from radio
tracking of orbiting and landed spacecraft (e.g., Smith et al., 1998;
Folkner et al., 1997; Konopliv et al., 2006; Rosenblatt et al., 2008a).
These observations are complemented by geochemical constraints
deduced from analysis of SNC meteorites (Shergottite, Nakhlite,
and Chassigny meteorites) or chondrite data and by extrapolation
of the Earth’s internal structure to the lower pressures of Mars’
interior (Sohl and Spohn, 1997; Sanloup et al., 1999; Bertka and
Fei, 1998; Sohl et al., 2005; Verhoeven et al., 2005). Geochemical
studies argue in favor of a relative enrichment in iron of the
Martian mantle with respect to the Earth’s mantle, and a relative
enrichment in sulfur content of the iron core. Recent results from
geodesy experiments favor models with a large core and a hot
mantle (Yoder et al., 2003; Konopliv et al., 2006). However, these
results are controversial since recent evaluation (Marty et al.,
2008) of the tidal Love number k2 (the ratio between the mass
redistribution potential to the tidal potential) suggests smaller
cores, which could be favored by thermal evolution models
sustaining large plumes possibly responsible for Tharsis’ rise
(Breuer et al., 1997; Spohn et al., 2001; Van Thienen et al., 2007).
Theoretical models of Mars’ interior that incorporate all these
possible hypotheses and match the measured quantities lead to
values of the outer core radius ranging from 1400 to 1800 km, i.e.,
40–50% of the mean radius of the planet (e.g., Schubert and Spohn,
1990; Schubert et al., 1990; Dupeyrat et al., 1996; Sohl and Spohn,
1997; Zharkov and Gudkova, 2000; Verhoeven et al., 2005; Sohl
et al., 2005; Duron, 2007; van Thienen et al., 2006). The present
state of the core (liquid or solid) is still an open question, although
the measured tidal perturbations of the orbits of Mars Global
Surveyor (MGS), Mars Odyssey, and Mars Express (MEX) suggest a
core at least partially liquid (Yoder et al., 2003; Balmino et al.,
2006; Konopliv et al., 2006; Marty et al., 2008; Rosenblatt et al.,
2008b).
Knowledge of the state of Mars’ core and its size is important
for understanding the planet’s evolution. The thermal evolution of
a terrestrial planet can be deduced from the dynamics of its
mantle and core. The evolution of a planet and the possibility of
dynamo magnetic field generation in its core are highly
dependent on the planet’s ability to develop convection in the
core and in the mantle. In particular, a core magnetodynamo is
related either to a high thermal gradient in the liquid core
(thermally driven dynamo) or to the growth of a solid inner core
(chemically driven dynamo), or both (see e.g., Longhi et al., 1992;
Dehant et al., 2007; Breuer et al., 2007). The state of the core
depends on the percentage of light elements in the core and on
the core temperature, which is related to the heat transport in the
mantle (Stevenson, 2001; Breuer and Spohn, 2003, 2006;
Schumacher and Breuer, 2006). The present size and state of the
core thus have important implications for our understanding of
the evolution and present state of Mars (Breuer et al., 1997; Spohn
et al., 2001; Stevenson, 2001; Van Thienen et al., 2007; Dehant
et al., 2007).
Mantle dynamics is also essential in shaping the geology of the
surface and in sustaining plate tectonics (Spohn et al., 1998). The
radius of the core has implications for possible mantle convection
scenarios and in particular for the presence of a perovskite phase
transition at the bottom of the mantle, which enables global
plume-like features to exist and persist over time, i.e., it allows
sustained localized upwelling of hot material as might have
occurred below Tharsis (van Thienen et al., 2006). Strong and
long-standing mantle plumes arising from the core–mantle
boundary may explain the long-term volcanic activity in the
Tharsis area. Nevertheless, their existence during the last billion
years is uncertain under Martian conditions. Alternatively,
Schumacher and Breuer (2006) have proposed that the thermal
insulation by locally thickened crust, which has a lower thermal
conductivity and is enriched in radioactive heat sources in
comparison to the mantle, leads to significant lateral temperature
variations in the upper mantle that are sufficient to generate
partial melt even in the present Martian mantle. This provides an
alternative explanation for Tharsis and its recent volcanism
(Neukum et al., 2004).
1.2. Mars’ atmosphere and the CO2 sublimation/condensation
process
1.2.1. Mars’ global atmosphere, length-of-day (LOD), and polar
motion
Knowledge of the Martian atmosphere derives from many
measurements by orbiters and landers, e.g., pressure measurements, infrared spectroscopic observations, radio occultations, etc.
The global circulation of the atmosphere is computed from
general circulation models that are constrained by these data.
The global circulation can also be constrained from knowledge of
the seasonal mass exchange in the atmosphere. About one fourth
of the atmosphere participates in the sublimation and condensation of the CO2 in the ice caps. This large seasonal phenomenon
induces, in turn, an exchange of angular momentum with the solid
planet and a change in the rotation of Mars.
LOD variations are deviations from the uniform rotation speed
of the planet. They are mostly related to the dynamics of the
geophysical fluids of the system (the core and atmosphere of
Mars). Seasonal condensation/sublimation of the icecaps induces
a large change in the LOD at the seasonal periods (Cazenave and
Balmino, 1981; Chao and Rubincam, 1990; Defraigne et al., 2000;
Van den Acker et al., 2002; Sanchez et al., 2004; Karatekin et al.,
�ARTICLE IN PRESS
1052
V. Dehant et al. / Planetary and Space Science 57 (2009) 1050–1067
2006a, b; see also Duron et al., 2003, for improvement of tracking
strategy).
This CO2 mass exchange between the ice caps and the
atmosphere due to the seasonal sublimation/condensation process is also the main reason for polar motion (motion of the
rotation axis in a frame tied to the planet). Due to the geometry of
the icecaps, we expect polar motion to be very small. LOD
variations, on the other hand, will be fairly large due to the large
mass exchange.
1.2.2. Long-term obliquity constraint
The present-day obliquity and rotation period of Mars and the
Earth are similar, and daily and seasonal insolation variations are
therefore comparable. The seasonal insolation variations on Mars
are larger due to the about five times larger eccentricity of Mars
compared to the Earth, which implies a 40% difference between
the solar flux received at perihelion and aphelion. Moreover, the
seasonal and diurnal temperature variations compared to the
insolation variations are relatively larger for Mars than for
the Earth due to the presence of oceans and a denser atmosphere
on Earth.
Although the current obliquity and rotation period of Mars and
the Earth are similar, the long-term spin variations of the Earth
and Mars differ substantially. Due to its closer distance to the Sun
and the presence of a large moon, the rotation rate of the Earth
has changed much more than that of Mars as a result of tidal
dissipation (see Laskar and Joutel, 1993; Laskar and Robutel,
1993). Mars’ rotation rate can be considered as close to primordial.
Earth’s obliquity has remained in the range of 22.1–24.51 over the
last 18 Myr (Laskar et al., 1993a, b). Mars’ obliquity shows much
larger variations: during the last 20 Myr, the obliquity of Mars
varied between about 101 and 451 (Laskar and Robutel, 1993;
Laskar et al., 2004). An important improvement in our present
understanding can be provided by a better determination of the
obliquity and precession rate. Indeed, they are very important
parameters for getting a better present constraint on the paleoclimate of Mars (Laskar et al., 2004). The Earth owes its spin axis
stability to the lunar torque, which decreases its precession period
from 8.1 �104 to 2.6 � 104 years (Ward, 1973). As a result, the
motion of the Earth’s spin axis is much faster than the motion of
the orbit normal and the spin axis follows the instantaneous orbit
pole, keeping the obliquity nearly constant. For Mars, the
precession period of the spin axis is close to periods of slow
secular changes in its orbit, and large chaotic obliquity variations
can occur as a result of this secular resonance overlap. It is thus
important to better constrain the precession value.
Progress in climate simulations involving solar insolation and
the changing obliquity of Mars has provided a theoretical basis for
the study of recent orbitally induced climate changes on Mars (for
an overview, see Montmessin, 2006).
A better knowledge of the present obliquity and precession
rate will improve our understanding of the obliquity evolution of
Mars over tens of million years (Laskar et al., 2004). It is known for
Earth that obliquity changes have played a critical role in pacing
glacial and interglacial eras. For Mars, such orbital changes have
been far greater (the obliquity of Mars is strongly chaotic) and
have generated extreme variations in insolation.
nutation observations, while atmospheric questions will be
addressed using observations of LOD variation.
As for Earth, information on Mars’ deep interior can be inferred
geodetically. The study of Mars orientation in space (rotation,
nutation) will allow isolation of the non-rigid response of Mars to
nutational forcing, which is directly linked to the state (liquid or
solid) of the core. In addition, the observation of precession will
allow a better determination of the total moment of inertia of the
planet, providing an additional constraint on the global mass
distribution inside the planet.
The experiment proposed is a radioscience experiment on
board the ExoMars mission to Mars to be launched in 2013 (http://
www.esa.int/SPECIALS/ExoMars/index.html). It is called LaRa for
Lander Radioscience.
LaRa will measure the variation of Mars’ rotation speed
(related to the LOD), the orientation of Mars’ rotation axis in
space (precession and nutation), and the orientation of Mars
around its rotation axis (polar motion), by monitoring the Doppler
shift due to the motion of Mars relative to the Earth on the radio
signal between the ExoMars lander and the tracking stations of
ESA ESTRACK (ESA TRACKing) network and NASA Deep Space
Network (DSN). The primary objective of LaRa is a precise
measure of these quantities, which can be theoretically calculated
for different states and sizes of the core, for different internal
compositions, and for different interior temperature profiles.
Precession and LOD variations have already been detected from
spacecraft data. Precession is presently known at the 0.3% level
(see Konopliv et al., 2006) and LOD variations are known at about
the 10% level (see Konopliv et al., 2006). The expected precision of
LaRa will be at least a factor of two better in the known quantities
(even a factor of four for the precession value for a very
conservative 180-day mission lifetime and better for a long stay
at the surface of Mars). An analysis of LaRa data will provide
(improved) estimates of Mars’ precession and nutation, polar
motion, and LOD variations.
LaRa thus aims at characterizing the present interior of Mars
and, in conjunction with other Humboldt Payload instruments
(see Section 8 on the synergies with the other instruments), will
be able to determine the physical state of the core, the size of the
core, the possible existence of an inner core, the core composition
and the mantle mineralogy. These parameters are very important
for understanding the evolution of Mars. Temperature and
mineralogy are the basis for obtaining the profiles of density,
thermodynamic parameters (bulk and shear moduli), and the
thermal conductivity inside Mars. The mass, moment of inertia,
impedances (characterizing the inductive response of the conductive planet), heat flow, and seismic velocities are all based on
these interior properties.
The paper is organized as follows. Sections 2 and 3 address the
way we will reach the goals with LaRa. Section 4 addresses
the observation strategy and Section 5 presents the results of the
simulations we have performed in order to show that the
radioscience data can be used to achieve the objectives. The
instrument description and its performance are addressed in
Sections 6 and 7. We address the synergy with other instruments
on the platform of the ExoMars mission as well as the synergy
with the orbiter payload in Sections 8 and 9, respectively.
2. How lander–Earth radioscience achieves the major goals
1.3. Objectives
2.1. Mars’ deep interior
This paper shows how radioscience will answer major
questions related to the internal structure of Mars, its climate,
and the global circulation of its atmosphere. Questions related to
the interior of Mars will be addressed using precession and
The direction of the rotation axis of Mars varies with time due
to the gravitational attraction exerted by the Sun and, to a lesser
extent, the natural satellites Phobos and Deimos. Because of the
�ARTICLE IN PRESS
V. Dehant et al. / Planetary and Space Science 57 (2009) 1050–1067
2.1.1. Core composition and size from precession
As mentioned in the previous paragraph, the LaRa data will
provide improved estimates of Mars’ precession and nutation,
polar motion, and LOD variations by monitoring the Doppler shift
due to the rotation of Mars on the radio signal between the
ExoMars lander and the tracking stations from ESA ESTRACK and
NASA DSN. LaRa will reduce the uncertainty in the precession rate
by about one order of magnitude after one Martian year (at the
order of a few milliarcsec/year) and therefore also in the moment
of inertia (C) by the same factor. The value of C/mara2, the scaled
moment of inertia, where ma is the mass of Mars and ra is the
mean radius of Mars, will be determined with an uncertainty of
about 0.0001. This quantity can be used to estimate likely values
of core size and density, and further constrain the core
temperature and composition if additional knowledge like mantle
composition and crust density and thickness are provided. In
addition, LaRa data will be used together with seismological and
gravity data to determine crustal density and thickness as well as
mantle mineralogy. This will be discussed further in the section
on synergies (Sections 8 and 9).
The moment of inertia is a function of the radial distribution of
mass. For a given planetary mass, a low value of the moment of
inertia corresponds to a mass concentration towards the center of
the planet while a high value of the moment of inertia implies a
more uniform distribution of mass with radius. If we know the
mean density of the mantle and the thickness and density of the
crust, it is possible to determine a range of values for the core
radius if the density of the core is known, as was done in Sohl and
Spohn (1997). Rivoldini et al. (2008a, b, c) have taken a different
approach and used two different models for the mantle composition: (1) the mineralogy of Dreibus and Wänke (1985) built under
the assumption that the refractory elements are derived from
chondritic CI (Ivuna-type of chondrite) abundances and the
volatile elements are derived from the SNC meteorites and (2)
the mineralogy of Sanloup et al. (1999) based on a mixture of
chondritic meteorites such that specific oxygen isotope fractions
are those of the SNC meteorites. They also consider two
temperature profiles, hot and cold, end-members of thermal
evolution modeling under the stagnant lid convective regime. The
temperature profiles are in agreement with an early episode of
magnetic activity and are compatible with present-day crustal
thickness estimates (Breuer and Spohn, 2003). Fig. 1 shows the
core radius as a function of the normalized polar moment of
inertia for models with 14-wt% sulfur in the core and fixed crust
density. The figure shows results for the cold and hot mantle
temperature profiles and for two different mineralogies: the
mineralogy of Dreibus and Wänke (1985) and the mineralogy of
Sanloup et al. (1999). The moment of inertia of Mars allows core
sizes corresponding to a range of crustal thicknesses from 40 to
120 km.
The figure is drawn for the range of scaled moment of inertia
values C/mara2 given by Konopliv et al. (2006). This range should be
compared with the range reached after a few months of LaRa
operation, which corresponds to a factor of 4 improvement in the
precision of the scaled moment of inertia (light grey-shaded area).
The precision that could be reached after one Martian year is even
better and corresponds to an estimated uncertainty of 0.0001 on
the scaled moment of inertia. This range is also indicated in Fig. 1
(grey shaded area). The central values of these shaded areas are
chosen arbitrarily. For a given mantle temperature profile and
composition, the resulting uncertainty in core size arises from two
different contributions: the uncertainty in the moment of inertia
and in the compatible crustal thickness, between 40 and 120 km.
The improvement in the precision of the moment of inertia
determination by a factor of 4 (a very conservative value for a 180day mission; a factor of 10 after one Martian year), which will be
realized by LaRa, reduces the uncertainty accordingly. Without
further independent improvement in the mantle temperature, one
Dreibus & Wänke 84
Sanloup & al. 99
1720
1700
rcmb [km]
existence of an equatorial bulge (like the Earth, Mars is flattened
at the poles, mainly due to its rapid rotation), the Sun’s attraction
continuously tends to tilt Mars’ equatorial plane towards the
orbital plane. The rotating Mars reacts to this force as a gyroscope,
and Mars’ rotation axis describes a broad cone around the
perpendicular to the orbital plane. This forced long-term component is called precession and has a period of about 91,000 Martian
years or 170,000 Earth years. Because the relative positions of the
Sun and Mars periodically change with time and, to a minor
extent, because of the existence of the gravitational forcing of the
two moons of Mars, the rotation axis also exhibits short periodic
variations in space called nutations (Reasenberg and King, 1979;
Borderies, 1980; Roosbeek, 2000). Both motions are very interesting for studying the deep interior of Mars: precession because it is
linked with the moment of inertia of the planet, nutations mainly
because they are different for a planet with a liquid core than for a
planet with a solid core. From the observation of nutation over a
long period of time (at least two Martian years will be necessary
to best constrain the core contribution to the nutation amplitudes), one can determine whether Mars has a liquid core or a
solid core. Mars’ response to gravitational nutation forcing is
influenced by the core physical state; a liquid core leads to a
resonant enhancement of nutation due to a normal mode called
the free core nutation (FCN) (Sasao et al., 1980; Dehant et al.,
2000b). This mode is related to the existence of a flattened fluid
core inside a solid mantle. The moment of inertia and the size and
density of the core can also be determined from the FCN
resonance related to the excitation of an angle between the
rotation axis of the core and the rotation axis of the mantle if the
core is liquid and flattened. In particular, the nutations driven by
the gravitational force of the Sun with frequencies at multiples of
the orbital frequency are influenced by the resonance effect due to
the FCN (see, e.g., Dehant et al., 2000a, b; van Hoolst et al.,
2000a, b). The existence of a liquid core enhances the nutation,
i.e., the peak-to-peak amplitude of the nutation is larger with a
liquid core than with a solid core.
1053
1680
1660
1640
1620
0.3660
0.3665
0.3670
0.3675
C/ma ra2
Fig. 1. Core radius rCMB as a function of the normalized polar moment of inertia C/
mara2 for cold and hot mantle models and for two different mineralogies. The full
curve corresponds to the mineralogy of Dreibus and Wänke (1985) and the dashed
curve to the mineralogy of Sanloup et al. (1999). The black curves correspond to a
hot mantle model and the grey curves to a cold mantle model. The range of scaled
moments of inertia presented in the figure corresponds to the range of values
proposed by Konopliv et al. (2006). Also indicated is the range reached after a few
months of LaRa operation (light grey shaded area) and after one year (grey shaded
area); it corresponds to a factor of four and ten improvement in the precision of the
scaled moment of inertia as proposed by LaRa.
�ARTICLE IN PRESS
1054
V. Dehant et al. / Planetary and Space Science 57 (2009) 1050–1067
would reduce the uncertainty in the core radius from 110 to
70 km. This shows the importance of synergies with other
Humboldt Payload instruments which will provide complementary constraints on all basic model parameters.
Using a model of Mars interior based on a few parameters
(crustal thickness between 20 and 120 km, crustal density
between 2900 and 3100 kg/m3, mantle temperature (hot or cold)
and mineralogy (Dreibus and Wänke, 1985; Sanloup et al., 1999)),
1800
hot mantle
cold mantle
rcmb [km]
1700
1600
we can determine ranges for the core size and the light element
fraction such that the values of the global mass and moment of
inertia lie within their determined error bars (more detail in
Rivoldini et al., 2008a). The results are presented in Fig. 2. The
span of the horizontal segments in the figure results from
different parameter values and the two mantle mineralogies for
a given core radius. The figure shows the plausible range of core
radius for the two mantle mineralogies, for different crust
densities and thicknesses, for different core sulfur fractions Xs
(X-axis), and for a hot and a cold mantle (black and grey points in
Fig. 2). Only completely liquid core models are represented in the
figure.
The figure shows that the mineralogy and the crustal thickness
are not the most important driver for the sulfur concentration Xs
and that there is a quasi-linear relation between the radius of the
core and the sulfur concentration for a given moment of inertia.
The results are also reported in Table 1.
1500
1400
0.00
0.05
0.10
0.15
xS
Fig. 2. Core radius rCMB vs. sulfur concentration Xs for a range of values of moment
of inertia, cold and hot mantle models, different crustal densities and thicknesses,
and different mantle mineralogies. The mineralogies considered are the mineralogy of Dreibus and Wänke (1985) and the mineralogy of Sanloup et al. (1999).
The black points correspond to a hot mantle model and the grey points to a cold
mantle model.
2.1.2. Core composition and size from nutation
For a core radius of around 1500 km, the FCN has an inertial
period close to 250 days (Dehant et al., 2000a, b). It ranges from
230 to 280 days for other values of the core radius (see Table 1).
These values of the FCN are very close to the ter-annual nutation
(Dehant et al., 2000a, b; Van Hoolst et al., 2000a, b), which can be
strongly influenced by the FCN resonance. Fig. 3 presents the ratio
between the amplitude of the nutations for a planet with a liquid
core and the amplitude of the nutations for a rigid planet. This is
called the nutation transfer function or the non-rigid Mars
amplification factor. The closest to the FCN the nutations are,
Table 1
Interior models and geophysical parameters of Mars
Core radius (km)
Mantle temperature
Scaled moment of
inertia C/mara2 factor
Sulfur
concentration Xs
Inner core
Love number k2
FCN
1300
Hot mantle
Cold mantle
0.3648
0.3648
0.001
0.015
rICB ¼ 1291 km
rICB ¼ 1191 km
0.100
0.093
�261.5
�173.7
1350
Hot mantle
Cold mantle
0.3649
0.3650
0.017
0.035
rICB ¼ 951 km
rICB ¼ 1071 km
0.102
0.098
�256.7
�231.8
1400
Hot mantle
Cold mantle
0.3660
0.3652
0.037
0.054
No
rICB ¼ 901 km
0.107
0.103
�270.4
�257.5
1450
Hot mantle
Cold mantle
0.3662
0.3656
0.058
0.072
No
rICB ¼ 571 km
0.113
0.108
�263.7
�261.5
1500
Hot mantle
Cold mantle
0.3654
0.3661
0.072
0.093
No
No
0.119
0.115
�260.1
�254.4
1550
Hot mantle
Cold mantle
0.3657
0.3655
0.092
0.110
No
No
0.125
0.120
�254.5
�250.7
1600
Hot mantle
Cold mantle
0.3661
0.3658
0.116
0.133
No
No
0.133
0.127
�249.0
�245.4
1650
Hot mantle
Cold mantle
0.3654
0.3661
0.133
0.157
No
No
0.139
0.134
�246.0
�240.8
1670
1700
Hot mantle
Hot mantle
Cold mantle
0.3661
0.3658
0.3655
0.136
0.158
0.174
No
No
No
0.143
0.148
0.141
�242.7
�241.5
�238.3
1710
1740
1750
Cold mantle
Cold mantle
Hot mantle
Cold mantle
0.3656
0.3650
0.3661
0.3658
0.164
0.168
0.187
0.200
No
No
No
No
0.143
0.148
0.157
0.150
�236.6
�236.6
�237.7
�234.5
1770
Hot mantle
Cold mantle
0.3653
0.191
422%
No
0.160
�237.4
1800
Hot mantle
Cold mantle
0.3655
0.216
422%
No
0.166
�235.8
�ARTICLE IN PRESS
V. Dehant et al. / Planetary and Space Science 57 (2009) 1050–1067
DW
prograde semi−annual
retrograde annual
retrograde semi−annual
retrograde ter−annual
retrograde quater− annual
amplification factor
0.4
0.2
0.0
0.2
0.4
500
0
T days
500
Fig. 3. Liquid core resonance effects on the nutation transfer function (liquid core
amplification factor) minus 1 for different core dimensions and the mineralogy of
Dreibus and Wänke) as a function of the period T in days. Grey (for large core) and
black (for smaller core) denote the limit obtained from the different extreme
values of the tidal k2 Love number observed from spacecraft by Konopliv et al.
(2006). The vertical lines indicate the Martian nutation frequencies. The figure
shows two extremes in the range of liquid core dimensions and the corresponding
FCN frequency changes on the transfer function.
the more they are amplified. The amplification factor given in
Fig. 3 has been computed for the particular mineralogy of Dreibus
and Wänke (1985) and for different core dimensions ranging from
1500 to 1770 km. In order to obtain the non-rigid Mars nutation
amplitude, it is necessary to multiply the rigid-Mars nutation
amplitude with the amplification factor presented in Fig. 3. The
largest nutation amplitude is the prograde semi-annual nutation
whose frequency is not close to the FCN frequency; nevertheless,
the perturbation of the nutational motion (of the order of 10 cm at
Mars’ surface) by the resonance would be large enough to be
observed by LaRa in its most accurate configuration with the help
of the lander–orbiter link (see Fig. 3). Observing the nutations
with LaRa will therefore settle the question about the physical
state of the core. It must however be mentioned that this objective
will be hard to attain if only the lander–Earth link is used. (It
would require that LaRa operate over at least one Martian year
and more. A new strategy for obtaining information on the state
and size of the core for less than one Martian year has been
studied and is presented in a paper in preparation (Le Maistre
et al., 2008).) Additionally, the size (and the flattening) of the core
has an influence on the resonance frequency (see Fig. 3, where the
core size range is [1500, 1770 km], corresponding to the Konopliv
et al. (2006) value of the k2 Love number as determined from
spacecraft radioscience). Under the hypothesis of a hydrostatic
shape of the core, one can estimate the size of the core and the
density jump at the core–mantle boundary from observation of
resonant amplification of nutation amplitudes (Van Hoolst et al.,
2000b). For a mission lifetime of two Earth years, the expected
precision in the FCN period determined using all the nutations
will be about 15 days, corresponding to an equivalent precision on
the core radius of about 100 km. The expected value of the FCN
period obtained from simulations for the ‘‘nominal’’ case is far
from the periods of the nutations. For closer resonances, the
resonance effects will be larger as shown in Fig. 3 and the results
on the core size will be more precise. In particular, for the k2 Love
number of Konopliv et al. (2006), the core would be large and
therefore the FCN period would be low, close to the retrograde terannual nutation, which will be enhanced. The numerical results
are also reported in Table 1.
For Mars, nothing is known about the existence of an inner
core. There is nevertheless some support for the absence of an
1055
inner core from the study of thermal evolution, using knowledge
of the remnant magnetic field and the absence of plate tectonics.
The core could be either completely liquid (no inner core) or
completely solid (very unlikely from thermal evolution studies
and not favored by the recent Mars orbiter k2 values). All
situations in between, even an almost completely liquid outer
core (very small inner core) or an almost completely solid outer
core (very large inner core), would also be possible. A large inner
core can have an effect on the nutations that could be measured
by LaRa: due to the existence of another resonance, the FICN, Free
Inner Core Nutation, there would be amplification in the prograde
band of the nutation frequencies. The main effect on nutation
would be that the amplification of the largest prograde semiannual nutation due to a liquid core (to the FCN) would be
canceled (Van Hoolst et al., 2000a; Dehant et al., 2003; Defraigne
et al., 2003). Failure to detect the amplification of the semi-annual
nutation with LaRa in its more precise configuration, together
with the detection of a liquid core from the retrograde band of the
nutations and from the k2 Love number, could then be interpreted
as evidence for a large inner core.
2.1.3. Mars’ interior from polar motion
Since polar motion and LOD variations are mainly excited by
seasonal changes in the atmosphere and ice caps (see next
paragraph), it will therefore be possible to learn about the
seasonal variations in the atmosphere and ice caps from the LaRa
data. Polar motion will also help in determining the global
deformation of the mantle and the core (Dehant et al., 2003,
2006).
Polar motion is the motion of the rotation axis in a reference
frame tied to the planet; it is sometimes explained as the motion
of the planet around its rotation axis. Mars’ polar motion contains
seasonal effects of the atmosphere as well as a resonance with a
rotational normal mode of the planet, the Chandler Wobble (CW),
which is the natural wobbling of an oblate planet that does not
rotate around its principal moment of inertia. The period and
damping of this mode are very interesting since they are linked to
the interior structure of the planet.
The CW period depends mainly on the dynamical flattening of
the planet and it provides information on the planet’s elasticity (a
change from a rigid model to an elastic model affects the expected
period at the level of 11 days), inelastic behavior (effect of up to 7
days), and the existence of a fluid core (at the level of 1.5 days)
(Zharkov and Molodensky, 1996; Van Hoolst et al., 2000b; Dehant
et al., 2006). However, since this mode is low frequency (close to
205 days; Van Hoolst et al., 2000b), it will be very difficult to get
precisely the CW period and amplitude with only one lander,
unless the lander operates on the surface for more than one
Martian year. The combination of LaRa data with other lander data
or orbiter data will help to better constrain this normal mode of
Mars. One does not expect improvement in the polar motion
determination using tracking data from one single lander located
near the equator of the planet since in this case the sensitivity of
the Doppler signal to the Polar motion is very small (Yseboodt
et al., 2003). Improvement in polar motion will be possible with a
lander network mission having some of the landers not on the
equator.
2.2. Atmospheric effect on rotation
The changes in the rotation speed with respect to uniform
rotation can best be viewed by measuring the motion of a point on
the equator over the seasons, which has an amplitude of almost
10 m. This effect will be the easiest one to observe with LaRa. The
main part of the signal is due to moment of inertia changes
�ARTICLE IN PRESS
1056
V. Dehant et al. / Planetary and Space Science 57 (2009) 1050–1067
induced by the mass redistribution. LOD variations can be
estimated from general circulation models (GCM) (e.g., Defraigne
et al., 2000; Van den Acker et al., 2002; using the GCM from Forget
et al., 1995, 1998) and have been determined from Viking lander
data (Yoder and Standish, 1997; Folkner et al., 1997) and orbiter
radioscience data (Konopliv et al., 2006), although this estimation
is rather difficult since the orbiter tracking data precision is at the
level of the effect of LOD variations onto the orbiter motion. The
estimated annual and semi-annual rotation angle amplitudes are
394 and 192 milliarcsec, respectively, in the study of Van den
Acker et al. (2002) and are consistent with the observational
values of Konopliv et al. (2006) within their uncertainties. While
the annual and semi-annual LOD amplitudes estimated from
lander and orbiter data are in very good agreement, they are
inconsistent with the estimated seasonal fluctuation of the
surface loads (GCM, MOLA and HEND data) (Karatekin et al.,
2006b). The differences between atmosphere general circulation
models with different atmospheric dust contents and dust storms
are about one order of magnitude (at 10% level) larger than the
expected accuracy of future DLOD measurements (at the percent
level, DLOD refers to changes in the length of day) (Defraigne
et al., 2000; Van den Acker et al., 2002). Winds are found to induce
rotation angle variations with an amplitude of 14 milliarcsec for
the annual period and 76 milliarcsec for the semi-annual period
(Van den Acker et al., 2002). Since winds induce angular
momentum changes and not gravity changes (reflecting mass
changes), the joint use of LaRa observations (at the few milliarcsec
precision level) together with the gravity coefficient variations
allows identification of the different contributions to DLOD and
could therewith better constrain atmosphere dynamic models and
the mass exchange between the atmosphere and the polar caps
due to the seasonal CO2 sublimation and condensation processes.
It must be noted that one should observe at least one Martian year
to be able to estimate both the annual and semi-annual
contributions to DLOD.
Due to the high precision that will be obtained on the obliquity
and precession rates, LaRa results will also be crucial for assessing
the past climate of Mars and the evolution of the polar ice caps as
explained in Section 1.
with nominal values (predicted values) calculated by nominal
Earth and Mars rotation and orbital revolution models. The raw
data directly recorded by the receiving system (level 1a) will be
translated into a format that can be more easily handled (level
1b). Calibrated data (Level 2) will be processed from Level 1 using
models for the Earth’s atmosphere and ionosphere and the orbits
of Mars and Earth to compute a predicted received frequency. The
Level 2 file contains information on the time of measurement in
UTC and ephemeris time, the received carrier frequency, the
predicted carrier frequency, the frequency residual, etc.
The calibrated Doppler data (Level 2) will be fitted with a
modified version of the software already developed to analyze the
Viking and Pathfinder lander Doppler data, and that is presently
used for working on the stable MER (Mars Exploration Rover)
Doppler data at the Royal Observatory of Belgium (software called
GINS/Dynamo) and JPL (software called the Solar System
Dynamics Processing Software (SSDPS)). GINS stands for ‘Géodésie
par Intégrations Numériques Simultanées’. This software has been
developed at Observatoire Midi-Pyrénées/CNES and has been
adapted to the planet Mars by the Royal Observatory of Belgium
for the preparation of the NEtlander Ionosphere and Geodesy
Experiment (NEIGE) within the Netlander CNES mission and for
the analysis of the MEX radio science data. The data will be
processed continuously as acquired, with final estimates of the
geophysical parameters and the other parameters one year after
the end of the Humboldt Payload/ExoMars mission.
A Belgian industrial firm, Orban Microwave Products (OMP),
has been identified as being able to build the X-band transponder.
OMP is presently working on a prototype that will be delivered in
a few months for a Preliminary Design Review (PDR) (November
2008). The design and the link budget of the instrument have
already been studied. The planned design is the following: an Xband uplink at 7.15 GHz and an X-band downlink at 8.4 GHz. The
radio link provided by LaRa will be further complemented by a
radio link between the lander and the orbiter for the telemetry
and the telecommands (TMTC) in UHF (it was called SMarT, for
3. LaRa measurements and strategy
The LaRa instrument is a coherent transponder using one
uplink and one downlink in X-band and is proposed for the
Humboldt Payload (on the fixed platform lander) of the ExoMars
ESA mission. There is a corresponding ground segment in the
experiment since the signal is observed by the DSN ground
stations as well as by the ESA tracking stations of the ESTRACK
(ESA TRACKing) network. One other complicated part of the
experiment is the analysis of the data, which will be done using
dedicated software built for the determination of the variations in
lander position as a function of time.
LaRa transponds a signal transmitted from the Earth ground
stations back to the Earth. The Doppler effects from the motion of
the Martian lander with respect to the Earth stations are
measured at these ground stations on Earth. The ground-based
reference for the Doppler is the same one that drives the
transmitter. The observations are called ‘‘two-way’’. The LaRa
data thus consist of Doppler shifts of the radio signals transmitted
by the ESA and NASA Earth ground stations to the ExoMars lander
and re-transmitted coherently by the transponder LaRa back to
Earth. The Maser frequencies from the ground stations ensure the
stability of the LaRa reference frequency. The required precision
on the Doppler for LaRa is 0.1 mm/s at 60 s integration time. The
data will be validated by comparing the observed Doppler values
Fig. 4. LaRa X-band link from the lander to Earth, UHF radio link (in practice
incorporating TMTC (TeleMetry & TeleCommand)) from the orbiter to the lander,
and X-band link from the orbiter to the Earth ground stations.
�ARTICLE IN PRESS
V. Dehant et al. / Planetary and Space Science 57 (2009) 1050–1067
Small Martian Transponder, in the Netlander mission). Fig. 4
represents all the radio links for the ExoMars lander. They
incorporate a lander–Earth link in X-band, an orbiter–lander link
in UHF, and an orbiter–Earth link in X-band.
The Doppler measurements will be used to deduce the position
and velocity of the lander in space as a function of time. The signal
will be used to reconstruct the position and velocity of the lander
with respect to the Earth. Knowing the orientation and rotation of
the Earth in space at the centimeter level thanks to very long
baseline interferometry (VLBI) measurements, it will be possible
to reconstruct the orientation and rotation of Mars in space. The
data processing is one of the most important parts of the
experiment. The interpretation of the data in terms of the physics
of the interior of Mars and of its atmosphere will be done using
software developed at ROB in collaboration with IPGP, CETP, and
Nantes University, based on the synergism between the geodetic,
magnetometer, and seismic data (see e.g., Verhoeven et al., 2005).
The Doppler measurements are performed from Earth using
the ground station equipment (ground segment) at the ESA or
NASA large deep space antenna complex without modification.
1057
However, the bandwidth of the transponder will not be very large
and will require adapted uplink frequency changes. This means
ramping or equivalent frequency shift at the NASA DSN stations
and frequency shift during tracking at the ESA stations. There
exists a procedure in the NASA DSN ground stations to tune or
ramp the uplink to pre-compensate for the Doppler shift on the
uplink and aim within a narrower receiver bandwidth. Nonconstant uplink is by now a proven standard procedure for many
missions and one can be satisfied with the quality of the data for
navigation. The coherency between the uplink and the downlink
allows determination of the Doppler shift induced by the
lander motion at the surface of Mars relative to Earth, without
contamination of instrumental delay; it also ensures that
the Doppler shift is not contaminated by the frequency instabilities of the generated signal. The plasma and ionospheric noise on
the received radio signal will be small enough to be either ignored
or corrected by appropriate models for the ionospheres of Mars
and Earth, when the observations are not too close to solar
conjunction (solar elongation angle 4201). We discuss this in
Section 5.
Fig. 5. Precision achieved on geophysical parameters (core momentum and FCN period) and Mars orientation and rotation parameters (precession, rotation rate, and polar
motion components) as a function of mission lifetime based on simulations of a lander–Earth radio link for a noise of 0.1 mm/s at a 60 s integration time.
�ARTICLE IN PRESS
7
7
5
3
1
1
0.7
0.5
a
The orbiter–Earth link in addition to the lander–Earth does not help the determination of precession; here we present simulations for different initial value of precession.
7
7
5
5
5
3
1
1
8
6.6
5.2
3.8
2.4
1
1
1
8
7.7
7.3
7.0
6.7
6.3
6
5.7
8
7.9
7.8
7.7
7.6
7.5
7.5
7.5
8
8
8
8
8
8
8
8
22
13
5
5
5
3
2
2
35
31
29
27
23
19
14.5
10
7000
1000
100
70
70
60
15
5
50
44
38
32
27
21
15
10
50
49
48
47.5
47
46
45
44
30
27.4
26.2
25
23.8
22.6
21.4
20
30
29
28
27.5
27
26
25
25
0
100
200
300
400
500
600
1 yr
Lander–Earth
link
With
orbiter–lander
link
Lander–Earth
link
With
orbiter–lander
link
Lander–Earth
link
Lander–Earth link and with
orbiter–lander linka
With
orbiter–lander
link
Lander–Earth
link
With
orbiter–lander
link
Rotation time (ms)
Chandler polar motion (cm)
Annual polar motion (cm)
Precession rate precision (milliarcsec/
year)
FCN period precision (days)
Mission
Core momentum (%)
lifetime (days)
We now discuss the precision that LaRa will achieve on the
Doppler measurements. It is at the level of 0.1 mm/s at a 60 s
integration time if the solar elongation angle is 4201 as required
in the LaRa strategy. This precision has been used for LaRa
simulations (method presented in Yseboodt et al., 2003)
performed in conjunction or not with the lander–orbiter radiolink.
The main simplifications used in the simulations are neglect of the
propagation effects (ionosphere and atmosphere), assumption
that the lander position is determined by observing from Earth for
a period of a couple of weeks just after landing, neglect of nongravitational forcing and wheel desaturation on the spacecraft,
and neglect of imperfections in the static gravity field for the radio
links with the spacecraft. Fig. 5 shows the precision on the
different geophysical parameters measured by the radioscience
experiment as a function of mission lifetime.
The figure represents the evolution of the uncertainty (or
precision) on the parameters determined from simulated data
(value fitted to the simulated observations minus the starting
‘real’ value or nominal value used in the data simulation) as a
function of mission lifetime. These parameters are the FCN period,
the ‘core momentum’ corresponding to the FCN resonance
amplification factor in the nutation amplitudes, the precession
rate, the annual and Chandler components of polar motion, and
the rotation time. The noise considered on the simulated data is of
the order of 0.1 mm/s at 60 s. The precision on the determination
of the parameters is also reported in Table 2. The precision
obtained using a lander–orbiter link in addition to the
Earth–lander link is also reported in this table.
The precession rate and rotation time are the best determined
parameters if the mission lifetime is small (if no mission
extension). After one Martian year, however, the FCN period
would be determined with a precision of about 10 days. The
period could be even better determined if the core is large, since
the FCN period will be closer to the ter-annual retrograde nutation
and thus provide high amplification.
The present precision on the precession rate is 17 milliarcsec/
year (Konopliv et al., 2006). LaRa will improve the precession rate
estimate by an order of magnitude after one Martian year (see Fig.
5 and Table 2). The resulting improved moment of inertia accuracy
from LaRa will tightly constrain the core size and eliminate many
possible core compositions, as discussed in Section 2. In addition,
the measurements of the nutation of Mars will determine
whether the Martian core is fluid and, if the FCN resonance is
close to one of the periods of the nutation, provide further
constraints on the core density and size. However, if the FCN is not
very close to one of the nutation periods, it will be difficult to
observe if the mission lifetime is not more than one Martian year.
The determination by LaRa of a free rotational oscillation of the
planet similar to the Chandler Wobble in the Earth’s polar motion
will yield independent constraints on the core size and density
and on the elastic and inelastic behaviors of the mantle. Our
simulations have shown that the Chandler Wobble can be
detected if its amplitude is at the decimeter level or above. The
seasonal polar motion components could be more difficult to
determine from the LaRa lander–Earth link only (see simulations
performed with an additional lander–orbiter link for a better
determination).
The present error on Mars’ rotation is a few ms (Konopliv
et al., 2006) larger than the simulation results for LaRa of about
1 ms after about 500 days. Accurate LaRa measurements of
seasonal
LOD
variations
will
thus
provide
detailed
global information on the general circulation of the atmosphere
and constrain the sublimation/condensation cycle of the polar
caps.
Table 2
Geophysical parameters (core momentum and FCN period) and orientation and rotation parameters (precession, rotation rate, and polar motion components) of Mars as a function of the mission lifetime
4. Simulations
With
orbiter–lander
link
V. Dehant et al. / Planetary and Space Science 57 (2009) 1050–1067
Lander–Earth
link
1058
�ARTICLE IN PRESS
V. Dehant et al. / Planetary and Space Science 57 (2009) 1050–1067
The discussion presented here is based on a mission lifetime of
180 days as well as one Martian year, but the longer the lander
operates on the surface of Mars, the more precise will be the
determination of the geophysical parameters.
The addition of a lander–orbiter link will improve the solutions
for the geophysical parameters. A classical UHF radio link is
foreseen, since the Humboldt Payload will be equipped with such
a transponder for TeleMetry and TeleCommand (TMTC). Simulations similar to those for which the parameter uncertainties are
determined in Fig. 5 and for a lander–orbiter link are presented in
Fig. 6. The numerical values are also reported in Table 2. For these
simulations we have considered a precision of 0.1 mm/s at a 60 s
integration time as shown by the error budget at this frequency
(Barriot et al., 2001) and as used for Fig. 5, a quasi-polar orbit at
550 km altitude, and an almost-equatorial lander. In that case, the
parameters of the core will be well constrained. Combining the
lander–Earth radio link with LaRa and the lander–orbiter and
orbiter–Earth links will greatly help in the determination of the
core parameters. The FCN period will be better determined (at the
level of 10 days) for the nominal case. In the simulations,
the orbiter is assumed to have a quasi-polar orbit. Such an orbit
is ideal for the determination of the core effects on the nutations
and the LOD variations, but it is not well adapted to the
determination of polar motion, given that the lander is at an
equatorial latitude. The CW will, however, be better determined,
which might in this case be used for constraining the elastic
properties of the planet. The precision on the precession rate and
the rotation time will gain a factor 2 with respect to the case
which uses the direct link only.
As shown in Fig. 6, additional parameters must be considered
in the simulations in order to account for the J2 and DJ2 effects on
1059
the orbiter motion. Not only are the precession rate and the LOD
variations well determined, but so are the FCN parameters. It must
be noted that the simulations have been performed for the
nominal value of the core parameters, i.e., for a mean core radius
of about 1500 km. In these simulations of the lander–orbiter link,
we did not take into account the effects of the perturbing forces
acting on the orbiter motion such as those induced by the orbiter
angular momentum desaturation typically occurring once per day.
Nevertheless, Rosenblatt et al. (2004) have shown that these
effects should not significantly degrade the determination of the
geophysical parameters, given that the orbiter could be tracked
quasi-continuously from the Earth, especially when these perturbing events occur.
The precision of this additional link might, however, well be
affected by multipath effects, which would increase the noise
level and degrade the solutions. An additional X-band link
between the lander and the orbiter would avoid these problems,
but the present designs of the existing orbiters do not support
this. Without X-band for the lander–orbiter link, precisions
similar to those in Fig. 6 could be obtained by observing longer.
Simulations not shown here have led to the conclusion that the
noise level impact on the retrieval of the parameters is similar to
the mission lifetime effect: an increase of the noise level by a
factor of two may roughly be compensated by an increase by a
factor of two in the mission lifetime.
5. Instrument description
The instrument consists of electronics for the transponder, a
cable (or two) connecting this to the patch antenna(s) (fixed on
Fig. 6. Precision achieved on geophysical parameters (core momentum and FCN period), Mars orientation and rotation parameters (precession, rotation rate, and polar
motion components), and first gravity field coefficients (J2) and its annual time variations (DJ2) as a function of mission lifetime based on simulations of a lander–orbiter
radio link for a noise of 0.1 mm/s at a 60 s integration time.
�ARTICLE IN PRESS
1060
V. Dehant et al. / Planetary and Space Science 57 (2009) 1050–1067
the lander), a cable connecting this to the command and data
management subsystem (CDMS), and a cable connecting this to
the power control and distribution unit (PCDU) as shown in Fig. 7.
The transponder electronic part has a dimension of
120 � 120 � 30 mm3 and the total weight is estimated at 600 g
(200 g margin) including the antenna(s).
5.1. Characteristics of the transponder electronics
Fig. 8 shows the plans for the transponder receiver and
the transmitter. Two different designs can be considered, since
the industry is presently studying the possibility of skipping the
duplexer and replacing the antenna by a dual-band antenna (this
adds a cable only).
The transponder presented in these figures has a simple
design. The schematics shown are classical and the circuits are
typical for a spacecraft transponder.
5.2. Characteristics of the X-band antenna
Fig. 7. LaRa instrument design onboard the lander; the Rx/Tx is the receiver and
the transmitter of LaRa; the PCDU is the Power Control and Distribution Unit; the
CDMS is Command and Data Management Subsystem; and the TCU is the Thermal
Control Unit.
We have studied the direction of the line-of-sight of the Earth
in the lander sky to find the optimum design of the antenna. Fig. 9
shows the elevation angle of the line-of-sight of the Earth in the
sky of the lander with respect to the horizon of the lander. The
form of this area depends on the initial conditions of the mission
but repeats every 2.13 years (the synodic period). The
Fig. 8. Diagram of the transponder transmitter and receiver with a duplexer. The acronyms are defined in the acronym table at the end of the document. The signal is
received by the antenna at the X0 frequency; it is transmitted to the transponder after passing through a duplexer; it is amplified by a low noise amplifier (LNA) and goes in
the coherent down-converter (using a voltage-controlled oscillator (VCO) and an automatic gain control (AGC)); it is then multiplied in order to account for the transponder
ratio k (the ratio between the output frequency X and the input frequency X0); it then goes in the coherent up-converter and into a high power amplifier (HPA) and a filter; it
is then sent back to Earth via the antenna. DC/DC stands for direct current/direct current converter; the PCDU is the power control and distribution unit; the CDMS is
command and data management subsystem.
�ARTICLE IN PRESS
V. Dehant et al. / Planetary and Space Science 57 (2009) 1050–1067
influenced by the fundamental frequency coming from the
oscillator (VCO) in a non-coherent mode and allow monitoring
of the behavior (aging) of the VCO or serving as a check for any
problem related to locking of the frequency by the LaRa
transponder. If possible (but not absolutely necessary), the
tracking should be performed at the time of the Martian day
when the line-of-sight of the Earth antenna is at an elevation of
about 30–401 (better LaRa antenna gain). The ground stations
should be turned on before the lander LaRa transponder in order
to account for the travel time of the signal (typically 20 min).
A measurement cycle will consist of the following operations:
Earth elevation in the sky of LaRa
landing area at 20 degrees of north latitude
90
80
Elevation angle (degree)
70
60
50
40
30
20
10
0
2013
2013.5
2014
2014.5
2015
2015.5
2016
1061
2016.5
2017
date in fraction of year
Fig. 9. The area represents the elevation angles of the Earth in the sky of the lander
for 4 years as a function of time during the ExoMars mission.
horizontality of the lander can also be accounted for in this
computation. Generally speaking, there is sometimes a zone of
blackout during the mission near the lander zenith. Moreover,
observations close to the horizon must be avoided because of
possible perturbations from the atmosphere of Mars. It is thus
preferable to have a design of the antenna with optimal antenna
gain centered on an elevation of about 30–401. The size of the
antenna is quite small, o130 mm in diameter, and its mass is very
small as well, about 125 g (25 g margin).
As a result, the antenna diagram could be based on a torus
concept in which the main lobes concentrate the energy favoring a
reception in the elevation range between 301 and 401.
5.3. Power and energy budgets
In the ‘‘transponder on’’-mode, the expected power that will be
used by LaRa is 20 W (margin 5 W) for 45 min to 1 h communication with the Earth once per week for at least one Martian year.
Thus, the energy consumption of LaRa is very low. In this strategy,
the mission lifetime has been favored instead of the number of
passes per week. In other words, if a choice must be made, it is
preferable to have a longer series of measurements and less passes
per week (one pass per week instead of two) than the other way
around.
6. Instrument performance and expected results
The transponder design will maintain the coherency of the
signal, and the global precision on the Doppler is expected to be
better than 0.1 mm/s at a 60 s integration time (compared to the
Doppler precision of Viking: 1 mm/s, of Pathfinder: 0.15 mm/s, and
of the MERs: 0.1 mm/s over 60 s integration time).
After landing, the transponder will be operated when an Earth
ground station is available and when the Earth is in the sky of the
lander. The position of the lander will be determined with the first
passes during commissioning. After this, it is expected that LaRa
will operate once or twice per week at least during the whole
mission lifetime. No operation is required at solar conjunction and
for a solar elongation angle o201. The transponder should be
turned on a few minutes before it receives the uplink signal from
the ground station. This will permit reception of a signal
1. Emit the uplink signal from the ground station.
2. Turn on the transponder a few minutes before reception of the
uplink signal; reception of this signal on Earth will provide the
status of the oscillator or the transponder within LaRa.
3. Receive the ground station signal at the lander, apply the
transponder ratio, and transmit the signal coherently back to
Earth at the downlink frequency (LaRa operating configuration); the same ground station as the emitting station should
be listening to the signal from Mars.
4. Turn off the transponder.
The 70 m antennas of the DSN are preferred for a better link
budget. This is particularly true when the Earth–Mars distance is
large. A longer mission lifetime facilitates the achievement of our
objectives. In the favored strategy for LaRa, we expect measurements once per week for at least one Martian year.
Non-signal disturbances in a Doppler link are due to instrumental noises (random errors introduced by the ground station or
the lander), propagation noises (random frequency/phase fluctuations caused by refractive index fluctuations along the line-ofsight), or systematic errors. Instrumental noises include phase
fluctuations associated with finite signal-to-noise ratio (SNR) on
the radio links, ground and lander–transponder electronics noise,
unmodeled motion of the ground station, frequency standard
noise (ground standards for a two-way radio link), and antenna
mechanical noise (unmodeled phase variation within the ground
station). Propagation noise is caused by phase scintillation as the
radio wave passes through the troposphere, ionosphere, and solar
plasma (for a complete discussion of the noise contribution, see
Asmar et al., 2005). The most important remaining Doppler error
sources include thermal noise (Sniffin et al., 2000), solar plasma
(Dobrowolny and Iess, 1986; Iess and Boscagli, 2001; Iess et al.,
2003; Morabito et al., 2003; Garcia et al., 2004), ionosphere,
troposphere, and ground station delay uncertainty. We have
carefully examined all the error contributions and their levels,
Table 3
Error contributions to the Doppler shift (worst cases)
Error sources
Level on the Doppler at 60 s
integration time; in mm/s
Thermal noise of the transponder (from LaRa
link budget given below)
Solar plasma effects at 201 and 301 elongation
starting from an evaluation of the solar
plasma from the formula given in the DSN
Handbook 810 (less for larger solar
elongation angles)
Ionosphere effects (including scintillations)
Remaining troposphere at 301 elevation angle
after dry troposphere corrections from
model explaining 90% of the effect: from
0.060 to 0.006
Ground station
Total root mean square
0.024
0.056 and 0.039
0.019
0.006
0.040
0.075 and 0.064
�ARTICLE IN PRESS
1062
V. Dehant et al. / Planetary and Space Science 57 (2009) 1050–1067
considering as reference the results from Zuber et al. (2007).
Table 3 shows the summary of our study. Observations should be
performed at times far from solar conjunction (at a solar
elongation angle larger than 201) in order to avoid the plasma
effects on the signal. The known ionospheric effects are very small
in X-band but may be corrected by using models of the
ionospheres of Mars (Trotignon et al., 2000; Witasse et al.,
2002; Pätzold et al., 2005) and of the Earth. Ionosphere models for
the Earth used for GNSS applications are, for example, the
Klobuchar model (Klobuchar, 1986) or the NeQuick model. The
ionospheric scintillation effects are shown in the table and may be
considered as sporadic, irregular, and unpredictable events. They
will be the largest contributions to the noise. Concerning the
troposphere, the dry component of the tropospheric delay may be
estimated from a model; this corresponds to 90% of the
tropospheric effect; it depends mainly on atmospheric pressure
on the Earth’s surface and therefore it is easy to account for from a
model of the so-called standard atmosphere (Hugentobler et al.,
2001). The remaining 10% of total tropospheric delay, the wet
component, depends on the water vapor in the Earth’s
atmosphere and it is difficult to model without water vapor
radiometer measurements. The figures in Table 3 thus constitute
very large extremes and a value of o0.1 mm/s seems more
reasonable. On the basis of the demonstrated performances of
telecom systems in previous and ongoing missions (Tyler et al.,
2001; Zuber et al., 2007), the Doppler accuracy is even better than
that. It is at the level of 0.02 mm/s for the MRO spacecraft, for
example (Zuber et al., 2007). Additionally, working with the
‘‘Open Loop’’ technique (with adequate digital signal processing)
instead of ‘‘Close Loop’’ may help to reduce these numbers further.
The error budget of the uplink and downlink is shown in Tables
4 and 5 for a large Mars–Earth distance at 201 elongation
(352 Mkm) and a 70 m antenna. Light grey indicates the
intermediate elements considered in the sum for the total
budget contribution. Grey indicates the final results. The error
budget of the uplink and downlink is shown in Tables 6 and 7 for a
mean Mars–Earth distance (150 Mkm) and a 34 or 35 m antenna
Table 4
Uplink budget (italics indicates what is considered for the intermediate sub-total;
bold indicates the final result)
For a transmit frequency of 7.15 GHz (from ground
station) we give below the necessary data to compute
the link budget
Effect
Transmitter output power
Transmitter antenna gain
EIRP
Free space path loss (for 352 Mkm Earth–Mars distance)
Received carrier power density
System noise temperature (Te)
Receiver noise power
Receiver antenna gain (G)
Receiver wave guide loss
Atmospheric attenuation
Receiver G/Te
C/N0
Noise bandwidth
C/N (carrier-to-noise ratio)
43
72.6
115.6
280.4
�167.8
745
�200
6
1
2
�23.7
38.2
20
25.2
Table 5
Downlink budget (italics indicates what is considered for the intermediate subtotal; bold indicates the final result)
For a transmit frequency of 8.45 GHz (from lander) we
give below the necessary data to compute the link
budget
Effect
Unit
Transmitter output power
Transmitter antenna gain
Transmitter cable loss
EIRP
Free space path loss (for 352 Mkm Earth–Mars distance)
Received carrier power density
System noise temperature (Te)
Receiver noise power
Receiver antenna gain (G)
Receiver wave guide loss
Atmospheric attenuation
Receiver G/Te
C/N0
Noise bandwidth
C/N (carrier-to-noise ratio)
4.8
6
1
9.8
281.9
�274.5
28
�214.1
74
0.45
2
59.1
13.6
3
8.8
dBW
dB
dB
dBW
dB
dBW
K
dBW/Hz
dB
dB
dB
dB/K
dB-Hz
Hz
dB
Case of a 70 m antenna and a maximum Earth–Mars distance; worse case for all
the other parameters.
Table 6
Uplink budget (italics indicates what is considered for the intermediate sub-total;
bold indicates the final result)
For a transmit frequency of 7.15 GHz (from ground
station) we give below the necessary data to compute
the link budget
Effect
Unit
Transmitter output power
Transmitter antenna gain
EIRP
Free space path loss (for 150 Mkm Earth–Mars distance)
Received carrier power density
System noise temperature (Te)
Receiver noise power
Receiver antenna gain (G)
Receiver wave guide loss
Atmospheric attenuation
Receiver G/Te
C/N0
Noise bandwidth
C/N (carrier-to-noise ratio)
43
67
110.0
273.0
�166
745
�200
6
1
2
�23.7
40
20/3000
27/5.2
dBW
dB
dBW
dB
dBW
K
dBW/Hz
dB
dB
dB
dB/K
dB-Hz
Hz
dB
Unit
Case of a 34 m antenna and an Earth–Mars distance of 150 Mkm; worse case for all
the other parameters.
dBW
dB
dBW
dB
dBW
K
dBW/Hz
dB
dB
dB
dB/K
dB-Hz
Hz
dB
Case of a 70 m antenna and a maximum Earth–Mars distance; worse case for all
the other parameters.
The units in the tables are dB, which stands for Decibel (10 log10 DP/P or 10 log10 Df/
f), and dBW, which stands for Decibel Watt (ratio of a power to one Watt expressed
in Decibels).
EIRP, effective isotropic radiated power.
C/N0 means carrier-to-noise power density (ratio of the power level of a signal
carrier to the noise power in a 1-Hz bandwidth) and is given in dB; C/N means
carrier-to-noise ratio, also given in dB.
(we only quote 34 m in the text below but this is true for the 35 m
antenna of ESA as well). The units in the tables are dB, which
stands for Decibel (10 log10 DP/P or 10 log10 Df/f) and dBW, which
stands for Decibel Watt (ratio of a power to one Watt expressed in
Decibels).
The overall carrier-to-noise (C/N) ratio is the measure of
effectiveness of the communications system. This link budget can
be considered as performing well if the C/N is greater than a few
dB. This is the case for both the uplink and downlink budgets.
7. Impact of instrument’s science for planning mission
operations
LaRa uses NASA and ESA ground stations. The operation of LaRa
is therefore dependent on the availability of the ground stations
and the visibility of the lander from the ground stations. Changes
in the uplink frequency must be performed at the ground stations
in order to be within the bandwidth of the LaRa transponder. This
must be computed a priori according to the relative position
�ARTICLE IN PRESS
V. Dehant et al. / Planetary and Space Science 57 (2009) 1050–1067
Table 7
Downlink budget (italics indicates what is considered for the intermediate subtotal; bold indicates the final result)
For a transmit frequency of 8.45 GHz (from lander) we
give below the necessary data to compute the link
budget
Effect
Unit
Transmitter output power
Transmitter antenna gain
Receiver wave guide loss
EIRP (effective isotropic radiated power)
Free space path loss (for 150 Mkm Earth–Mars distance)
Received carrier power density
System noise temperature (Te) DSN/ESA
Receiver noise power
4.8
6
1
9.8
274.5
�267
29/70
�214/
�210
68.2
0.25
2
53.3/
49.5
15.2/11.2
3
10.4/6.4
dBW
dB
dB
dBW
dB
dBW
K
dBW/Hz
Receiver antenna gain
Receiver wave guide loss
Atmospheric attenuation
Receiver G/Te
C/N0
Noise bandwidth
C/N (carrier-to-noise ratio)
dB
dB
dB
dB/K
dB-Hz
Hz
dB
Case of a 34 m antenna and an Earth–Mars distance of 150 Mkm; worse case for all
the other parameters.
between the lander and the ground station. The antennas must be
chosen according to the geometry of the measurement. The
criteria to consider are the following:
(1) Lander tracking from Earth should be performed when the
lander can be seen from Earth.
(2) Tracking should be performed twice per week (possibly once
per week during winter energy problem period) for at least
one Martian year; a longer mission lifetime is preferred to
more observations per week.
(3) Tracking should be performed at the time of the Martian day
when the line-of-sight of the Earth antenna is at an elevation
of about 30–401 (better LaRa antenna gain and better
sensitivity to the precession, nutation, LOD variations).
(4) If possible, tracking should be performed roughly simultaneously with respect to the lander–orbiter TMTC transfer with
UHF (this allows determination of one common set of
parameters for both measurement sets, with no maneuver of
the orbiter between the measurements, as explained in the
next section); the orbiter should be tracked as often as
possible and in particular when maneuvers are performed in
order to constrain the orbit very well (see synergy part).
(5) No observation at conjunction is foreseen when the elongation angle is lower than 201 in order to avoid a large plasma
contamination to the signal.
(6) Observation at large Earth–Mars distance should be performed with the 70 m antennas if the classical bandwidth of
5000 Hz is retained; there is no constraint on the antennas if
the narrow bandwidth option is retained; observation at
mean and short distances can be performed with any of the
antennas (34 or 70 m antennas); nevertheless, for link budget
reasons, it is always better to use the DSN 70 m antenna.
As complementary data, the UHF link with the relay orbiter may
be used for further scientific objectives as explained above. The
same kinds of visibility conditions between the lander and the
orbiter and between the orbiter and the Earth must be applied and
are important for planning the mission. It is also desirable to have
tracking of the orbiter for a long time (one orbit) without any
maneuvers in order to obtain the parameters of the spacecraft
orbit and to be able to obtain the other geophysical parameters
1063
(but this is known and already applied for the spacecraft radio
science objectives). It is preferable (but not absolutely necessary)
to have the UHF radio link almost simultaneously (at 1-day
interval or so in order to avoid maneuvers of the orbiter in
between the measurements) with the X-band LaRa link with the
Earth.
The operation of LaRa requires that (1) the Earth is seen in the
lander sky or similarly the lander can be tracked from Earth and
that (2) one of the ground stations is available for the tracking. For
operation of LaRa, the available power supply should be able to
maintain 20 W of power during the whole tracking period (about
45 min).
8. Relation to other Humboldt instruments and to the orbiter
(science complementarities)
8.1. Synergy with the other Humboldt instruments
One main objective of the LaRa experiment is to contribute to
the determination of the mineralogy, temperature, and state of
the deep interior of Mars, complementing information provided
by seismology, tides, heat flow measurements, and magnetic
induction measurements. Combination of the geodetic data
(moment of inertia of the planet, tidal deformation, gravity,
rotation and orientation variations) with other observations from
the geophysical Humboldt package of ExoMars (seismology, heat
flow, magnetic induction) allows us to solve for the temperature
and mineralogy of Mars’ deep interior, as shown by Verhoeven
et al. (2005) using a Bayesian approach. [In this paper, it is
demonstrated that it is possible to provide the temperature and
mineralogy profiles, by using a Bayesian approach, as the most
probable values in agreement with future observations and with
existing laboratory experiments.] The mineralogy and temperature of the deep interior will provide key information on the
accretion of the planet, and, more generally, can be used to test
theories of terrestrial planet accretion and thermal evolution.
These objectives are high-priority items in the roadmap for solar
system exploration. The contribution of radioscience to Mars’
interior structure will derive from the interior’s effect on
variations in the rotation and orientation of Mars with respect
to inertial space.
LaRa is the only Humboldt Payload instrument to determine
the moments of inertia and angular momentum transfers among
the different parts of Mars (core, mantle, and atmosphere). But it
is only by using LaRa jointly with other Humboldt Payload
instruments that the ultimate goal of determining the mineralogy
and temperature profile of Mars will be reached. Presently, as
explained in the introduction of the paper, the composition,
thermal state, and dynamics of Mars’ interior are poorly
constrained. For example, the state, the size, and the composition
(percentage of light element) of the core are important remaining
questions. The global constraints from the moment of inertia and
tidal Love number k2 provided by geodesy (Folkner et al., 1997;
Yoder and Standish, 1997; Lemoine et al., 2001; Yoder et al., 2003;
Konopliv et al., 2006; Marty et al., 2008) only provide constraints
on the mineralogy constituents, the mineralogical phase transitions, and the temperature profile of the whole planet. The
magnetometer, the seismometer, the heat flow and physical
properties probe, and the geodesy experiment of the Humboldt
Payload will provide additional important data: electrical conductivity, seismic velocity, heat flow, and moments of inertia. By
means of a sophisticated approach based on a stochastic inversion
of such geophysical data (within uncertainty ranges for the
laboratory experiment data and for the observational data) we
will be able to compute temperature and composition profiles of
�ARTICLE IN PRESS
1064
V. Dehant et al. / Planetary and Space Science 57 (2009) 1050–1067
Mars’ interior. This method has been demonstrated on simulated
data (Verhoeven et al., 2005) and validated for the Earth
(Verhoeven et al., 2008) and Mars (Rivoldini, 2008). The
geodetically measured value of the k2 Love number, further
improved by the lander–orbiter–Earth radio links, can be jointly
used with the SEIS (define) tidal output to constrain the interior
modeling from tides.
called lumped coefficients. With a single orbiter, these lumped
coefficients can be derived from radio science experiments. To
disentangle the coefficients, a combination of observations from
different orbiters with different orbit characteristics is very
promising (see Karatekin et al., 2005). The calculations of Chao
and Rubincam (1990) showed that the time variations of the
gravity field could be large enough to have a measurable effect on
the orbit of a spacecraft around Mars. The low-degree zonal
coefficients of the Martian time-variable gravity field have been
determined from the tracking data of the MGS spacecraft by Smith
et al. (2001), Yoder et al. (2003) and most recently by Balmino
et al. (2006); see also (Duron, 2007; and Marty et al., 2008) and
from MGS and Odyssey by Konopliv et al. (2006). The perturbation
of the orbit due to the time-variable gravity field is at the limit of
detectability and the reported coefficients (‘‘lumped’’ gravity
coefficients) contain the influence of higher-degree zonal coefficients, since they were obtained from the tracking data of a single
spacecraft or two spacecraft with similar orbits. Nevertheless, the
present-day time-variable gravity solution yields seasonal mass
variations in reasonable agreement with numerical (GCM) and
experimental (gamma ray spectroscopy) studies (Karatekin et al.,
2006a), but it does not yet have the desired accuracy to
discriminate among different models of the seasonal CO2 cycle.
Time-variable gravity solutions can be significantly improved by
considering the additional lander–orbiter radio link. Simulations
(Karatekin et al., 2006b) have shown that a large decrease of the
formal uncertainty of some of the low-degree gravity coefficients
(by a factor 10) can be expected if this additional link is
considered. The strategy foreseen is to determine both the gravity
coefficients and the LOD variations. These geophysical quantities
are both related to the CO2 sublimation and condensation
process but, while the seasonal gravity variations are related to
the mass transfer, the LOD variations also contain wind effects.
The observation of both therefore provides complementary
information.
8.2. Synergy with the UHF TMTC (at system level) and the relay
orbiter
The use of a lander–orbiter link in addition to an orbiter–Earth
radio link greatly helps the determination of the orbiter trajectory
and the parameters involved in the forces acting on the spacecraft,
as shown by simulations performed by Karatekin et al. (2005). The
joint use of an UHF link for this lander–orbiter link therefore
provides additional science return. The joint use of LaRa and the
UHF TMTC together with the orbiter–Earth radio link will further
increase the precision on all parameter determinations, and hence
will allow improvement of mission objectives. In particular, the
lander–orbiter link helps the determination of a precise orbit for
the spacecraft and therewith the determination of the orbitrelated geophysical parameters such as the gravity coefficients
and their time variations or the tidal Love number k2, as discussed
above.
8.2.1. Global atmosphere
CO2 in the Martian atmosphere condenses and sublimes on
seasonal time scales, resulting in large mass exchange between
the atmosphere and surface. Since this mass redistribution is on a
global scale, it mainly affects the long wavelength components of
the gravity field. The exchange involves about one-fourth of the
total mass of the atmosphere and induces relative gravity changes
on the order of 10�9, which can be compared with the secondorder gravity field coefficient J2 ¼ 0.00195545 (Lemoine et al.,
2001). This signature can be detected in the orbit parameters, and
the variations in the lowest-degree zonal gravity coefficients have
been determined (Smith et al., 2001; Yoder et al., 2003; Karatekin
et al., 2005; see also Balmino et al., 2006). The induced changes in
the orbit of a spacecraft are due to a linear combination of the odd
coefficients and a linear combination of the even coefficients,
8.2.2. Tidal Love number k2
Similarly, the addition of a lander link to the orbiter–Earth link
will greatly help to better determine the k2 tidal Love number and
hence better constrain the interior modeling of Mars.
MGS+O D.2007
IAG3 B.2005
O D.2007
MGS D.2007
IAG4 B.2005
IAG2 B.2005
IAG1 B.2005
OT6 K.2006
OT5 K.2006
OT4 K.2006
OT3 K.2006
OT1 K.2006
MGS S.2001
solid core
0.10
0.05
MGS+O MGS95J K.2006
O K.2006
k2
0.15
MGS+GCO+PF+Vi K.2006
MGS Y.2003
0.20
Fig. 10. Values of the k2 tidal Love number from different radio science data. The ‘‘K2006’’ values are those of Konopliv et al. (2006); we have used the nomenclature
introduced in that paper; for the ‘‘IAG1-4B2005’’, we have used the four values in the table of Balmino et al. (2006); for the MGS/O/MGS+OD2007, we have used the values
computed with MGS, Mars Odyssey, and the combination of both presented at AGU2007 (Duron et al., 2007). The theoretical value of about 0.07 corresponds to a solid core
and a value between 0.1 and 0.17 indicates a liquid core; the light grey area is for a warm mantle model and dark grey for a cold mantle model.
�ARTICLE IN PRESS
V. Dehant et al. / Planetary and Space Science 57 (2009) 1050–1067
The tidal Love number k2 value with associated uncertainties
has been obtained by using radio links between orbiters around
Mars and the Earth (see Fig. 10). The value of the tidal Love
number k2 from MEX alone is not reported in the figure as it has
too large error bars due to the discontinuity in the tracking of the
orbiter. Combinations of data from all spacecraft that have been or
are orbiting around Mars look very promising. It must be
mentioned, however, that the strategy of data treatment is of
great importance in this determination, as shown in the figure,
where the same data treated by different authors give different k2
values. A recent redetermination of the k2 Love number from the
same data as those used by Konopliv et al. (2006) indeed confirms
differences in k2 at the 10% level (Marty et al., 2008).
Continuous use of well-tracked orbiters will however further
increase the precision of this determination in conjunction with
improvements in the global gravity field and its time variations.
But a major improvement will be provided by the use of a radio
link between the lander and the orbiter (the UHF TMTC system
can be used for that link). The expected precision on the k2 value
will greatly help to determine the interior structure parameters,
since it can be used jointly with the moment of inertia derived
from the LaRa determination of precession.
The increased precision on the determination of the moment of
inertia from LaRa results in a reduced set of possible solutions for
the interior structure in terms of crust thickness and density, and
in terms of core composition and size. The tidal Love number k2
dependence on core size has been shown in Fig. 11. An increase in
the precision of k2 will further help to constrain the size of the
core. Fig. 11 shows core radius vs. the Love number k2 for the two
mantle mineralogies, different crust densities and thicknesses,
core sulfur weight fractions (the horizontally grouped points in
Fig. 11) and a hot (black in the figure) and cold (grey in the figure)
mantle. The results assume that the core is fully liquid. The
shaded area shows the reduced range of k2 values of Konopliv et
al. (2006), obtained by using the radio link between an orbiter and
the Earth (as discussed previously, this range of values is however
most probably underestimated). A further constraint on the k2
value (with associated lower uncertainties) is possible with a
lander–orbiter radio link (see also the paragraph on synergies
with the orbiter); it will significantly reduce the uncertainties
associated with the determination of the interior structure
parameters such as core radius. The knowledge of the k2 Love
number, even with large error bars, helps to constrain the size of
1800
hot mantle
cold mantle
rcmb [km]
the core, its composition in terms of sulfur weight fraction, and
the temperature of the mantle. The information provided by the k2
Love number will greatly help to increase our knowledge of the
interior of Mars in conjunction with the information provided by
the moment of inertia. The core size and composition can thus be
estimated with high confidence from both the tidal Love number
k2 and the moment of inertia together. To further constrain the
interior, e.g., mantle composition and thermal state, additional
data such as seismic velocities and electrical conductivity are
required.
9. Conclusions
In this paper, we have demonstrated that with a simple
radioscience experiment onboard a lander at the surface of Mars,
LaRa, it is possible to obtain information on the deep interior of
Mars and on the global seasonal variations of the atmosphere and
icecaps. In particular, in about one-third of a Martian year we will
be able to improve the precession constant from its value
determined by spacecraft around Mars by a factor of 4. For a
mission lifetime of one Martian year, it is possible to improve the
precession constant and consequently the global moment of
inertia of Mars by one order of magnitude. It will also be possible
to determine the nutation of Mars, which provides important
information on the state and size of the core. The use of the radio
link between the lander and the orbiter improves the scientific
results. In particular, the orbit of the orbiter can be improved,
which further improves the determination of the k2 tidal Love
number and the core size and composition. The joint use of LaRa
with seismic data, heat flow measurements, and electrical
conductivity profiles makes it possible to determine density,
composition and temperature profiles for Mars. This demonstrates
the high potential of future scientific return of the Humboldt
geophysical science payload of ExoMars.
Acknowledgements
This work was financially supported by the Belgian PRODEX
program managed by the European Space Agency in collaboration
with the Belgian Federal Science Policy Office. In particular, we
would like to thank Werner Verschueren (BELSPO) and Hilde
Schroeven-Deceuninck (ESA/PRODEX) for their constant support
and enthusiasm and their great help to the LaRa project. We are
thankful to the reviewers who helped improving our manuscript.
References
1700
1600
1500
1400
0.10
1065
0.12
0.14
k2
0.16
0.18
Fig. 11. Core radius rCMB as a function of the k2 tidal Love number for hot (black)
and cold (grey) mantles, for different crust densities and thicknesses, for different
core sulfur fractions, and for the two mantle mineralogies (the horizontally aligned
dots represents the values for the different possibilities). The horizontal dimension
of the grey shaded area corresponds to the uncertainty (probably underestimated)
on the k2 value of Konopliv et al. (2006). An increase of that precision as expected
with LaRa will further constrain the core radius.
Asmar, S.W., Armstrong, J.W., Iess, L., Tortora, P., 2005. Spacecraft Doppler tracking:
noise budget and accuracy achievable in precision radio science observations.
Radio Sci. 40, RS2001.
Balmino, G., Duron, J., Marty, J.C., Karatekin, Ö., 2006. Mars long wavelength gravity
field time variations. A new solution from MGS tracking data. In: Proceedings
of the IAG Symposium 2005 on ‘Dynamic planet’, vol. 125. Cairns, Australia, pp.
895–902.
Barriot, J.P., Dehant, V., Cerisier, J.-C., Folkner, W., Rhibes, A., Benoist, J., Van Hoolst,
T., Warnant, R., Preston, R.A., Romans, L., Wu, S., Wernik, A.W., 2001. NEIGE:
NetLander ionosphere and geodesy experiment. Adv. Space Res. 28 (8),
1237–1249.
Bertka, C.M., Fei, Y., 1998. Density profile of an SNC model Martian interior and the
moment-of-inertia factor of Mars. Earth Planet. Sci. Lett. 157 (1–2), 79–88.
Borderies, N., 1980. Theory of Mars rotation in Euler angles. Astron. Astrophys. 82
(1–2), 129–141.
Breuer, D., Spohn, T., 2003. Early plate tectonics versus single-plate tectonics on
Mars: evidence from magnetic field history and crust evolution. J. Geophys.
Res. (Planets) 108 (E7), 5072.
Breuer, D., Spohn, T., 2006. Viscosity of the Martian mantle and its initial
temperature: constraints from crust formation history and the evolution of the
magnetic field. Planet. Space Sci. 54 (2), 153–169.
�ARTICLE IN PRESS
1066
V. Dehant et al. / Planetary and Space Science 57 (2009) 1050–1067
Breuer, D., Yuen, D.A., Spohn, T., 1997. Phase transitions in the Martian mantle:
implications for partially layered convection. Earth Planet. Sci. Lett. 148 (3–4),
457–469.
Breuer, D., Hauck, S.A., Buske, M., Pauer, M., Spohn, T., 2007. Interior evolution of
mercury. Space Sci. Rev. 132 (2-4), 229–260.
Cazenave, A., Balmino, G., 1981. Meteorological effects on the seasonal variations of
the rotation of Mars. Geophys. Res. Lett. 8, 245–248.
Chao, B.F., Rubincam, D.P., 1990. Variations of Mars gravitational field and rotation
due to seasonal CO2 exchange. J. Geophys. Res. 95, 14755–14760.
Defraigne, P., de Viron, O., Dehant, V., Van Hoolst, T., Hourdin, F., 2000. Mars
rotation variations induced by atmospheric CO2 and winds. J. Geophys. Res.
(Planets) 105 (E10), 24563–24570.
Defraigne, P., Rivolidini, A., Van Hoolst, T., Dehant, V., 2003. Mars nutation
resonance due to free inner core nutation. J. Geophys. Res. 108 (E12), 5128.
Dehant, V., Defraigne, P., Van Hoolst, T., 2000a. Computation of Mars’ transfer
function for nutation tides and surface loading. Phys. Earth Planet. Interact. 117,
385–395.
Dehant, V., Van Hoolst, T., Defraigne, P., 2000b. Comparison between the nutations
of the planet Mars and the nutations of the Earth. Surv. Geophys. 21 (1),
89–110.
Dehant, V., Van Hoolst, T., de Viron, O., Greff-Lefftz, M., Legros, H., Defraigne, P.,
2003. Can a solid inner core of Mars be detected from observations of polar
motion and nutation of Mars? J. Geophys. Res. (Planets) 108 (E12).
Dehant, V., de Viron, O., Karatekin, Ö., Van Hoolst, T., 2006. Excitation of Mars polar
motion. Astron. Astrophys. 446 (1), 345–355.
Dehant, V., Lammer, H., Kulikov, Y., Grießmeier, J.M., Breuer, D., Verhoeven, O.,
Karatekin, Ö., Van Hoolst, T., Korablev, O., Lognonné, P., 2007. Planetary
magnetic dynamo effect on atmospheric protection of early Earth and Mars. In:
Fishbaugh, K., Lognonné, P., Raulin, F., Des Marais, D., Korablev, O. (Eds.),
Geology and Habitability of Terrestrial Planets. Springer, Dordrecht, The
Netherlands, pp. 279–300 (Space Science Series of ISSI, vol. 24, reprinted from
Space Science Reviews).
Dobrowolny, M., Iess, L., 1986. Interplanetary plasma turbulence and the Doppler
detection of a gravitational wave background. Astron. Astrophys. 157, 346–352.
Dreibus, G., Wänke, H., 1985. Mars, a volatile-rich planet. Meteoritics 20 (2),
367–381.
Dupeyrat, L., Sotin, C., Parmentier, E.M., 1996. Thermal and chemical convection in
planetary mantles. Geophys. Res. 100 (B1), 497–520.
Duron, J., 2007. De la dynamique d’un satellite en orbite autour de Mars;
application aux misions de radioscience Mars Global Surveyor. Mars Express et
NetLander, Ph.D. Thesis (in French).
Duron, J., Rosenblatt, P., Yseboodt, M., Karatekin, Ö., Dehant, V., Van Hoolst, T.,
Barriot, J.-P., 2003. Joint estimation of Martian C20 and rotation variations from
simultaneous geodetic measurements: numerical simulations of a network
science experiment. Geophys. Res. Lett. 30 (18), 1971.
Duron, J., Marty, J.C., Balmino, G., Rosenblatt, P., Le Maistre, S., Dehant, V., 2007.
Martian gravity field mean model and its time variations from mars global
surveyor and odyssey data. American Geophysical Union, Fall Meeting 2007,
abstract #P41A-0186.
Folkner, W.M., Yoder, C.F., Yuan, D.N., Standish, E.M., Preston, R.A., 1997. Interior
structure and seasonal mass redistribution of Mars from radio tracking of Mars
pathfinder. Science 278 (5344), 1749.
Forget, F., Hourdin, F., Talagrand, O., 1995. The sensitivity of the Martian surface
pressure and atmospheric mass budget to various parameters: a comparison
between numerical simulations and Viking observations. J. Geophys. Res. 100
(E3), 5501–5523.
Forget, F., Hourdin, F., Talagrand, O., 1998. CO2 snowfall on Mars: simulation with a
general circulation model. Icarus 131 (2), 302–316.
Garcia, D., Jehn, R., Sanchez, N., 2004. BepiColombo Mercury Cornerstone. Mission
analysis: radio science and guidance analysis. ESOC MAO Working Paper, No. 476.
Hugentobler, U., Sacher, S., Fridez, P. (Eds.), 2001. Bernese GPS Software Version 4.2.
Astronomical Institute, University of Berne, Switzerland.
Iess, L., Boscagli, G., 2001. Advanced radio science instrumentation for the mission
BepiColombo to Mercury. Planet. Space Sci. 49 (14–15), 1597–1608.
Iess, L., Palmerini, G., Tortora, P., Persi, P., Mercolin, M., 2003. Error Analysis for
BepiColombo Radio Science Experiment. Publ. of Università La Sapienza, Rome,
Italy (May 2003).
Karatekin, Ö., Duron, J., Rosenblatt, P., Dehant, V., Van Hoolst, T., Barriot, J.P., 2005.
Martian time-variable gravity and its determination; simulated geodesy
experiments. J. Geophys. Res. 110 (E6) (CiteID: E06001).
Karatekin, Ö., Dehant, V., Van Hoolst, T., 2006a. Martian global-scale CO2 exchange
from time-variable gravity measurements. J. Geophys. Res. 111 (CiteID:
E06003).
Karatekin, Ö., Van Hoolst, T., Tastet, J., de Viron, O., Dehant, V., 2006b. The effects of
seasonal mass redistribution and interior structure on length-of-day variations
of Mars. Adv. Space Res. 38 (4), 561–828 (JASR-D-04-01301R1).
Klobuchar, J.A., 1986. Design and characteristics of the GPS ionospheric time delay
algorithm for single frequency users. In: Proceedings of the IEEE Plans 1986
Position. Location and Navigation Symposium, Las Vegas.
Konopliv, A., Yoder, C., Standish, E.M., Yuan Dah-Ning, Sjogren, W.L., 2006. A global
solution for the Mars static and seasonal gravity, Mars orientation, Phobos and
Deimos masses, and Mars ephemeris. Icarus 182 (1), 23–50.
Laskar, J., Joutel, F., 1993. Orbital rotational and climate interactions. Celest. Mech.
57, 293–294.
Laskar, J., Robutel, P., 1993. The chaotic obliquity of the planets. Nature 361,
608–612.
Laskar, J., Joutel, F., Boudin, F., 1993a. Orbital, precessional, and insolation
quantities for the Earth from �20 MYR to +10 MYR. Astron. Astrophys. 270
(1–2), 522–533.
Laskar, J., Joutel, F., Robutel, P., 1993b. Stabilization of the Earth’s obliquity by the
moon. Nature 361 (6413), 615–617.
Laskar, J., Correia, A.C.M., Gastineau, M., Joutel, F., Levrard, B., Robutel, P., 2004.
Long term evolution and chaotic diffusion of the insolation quantities of Mars.
Icarus 170, 343–364.
Le Maistre, S., Rosenblatt, P., Marty, J.C., Dehant, V., 2008. Simulations of a radio
science experiment with a direct link from Mars to Earth, in preparation.
Lemoine, F.G., Smith, D.E., Rowlands, D.D., Zuber, M.T., Neumann, G.A., Chinn, D.S.,
Pavlis, D.E., 2001. An improved solution of the gravity field of Mars (GMM-2B)
from Mars global surveyor. J. Geophys. Res. 106 (E10), 23359–23376.
Longhi, J., Knittle, E., Holloway, J.R., Wänke, H., 1992. The bulk composition,
mineralogy and internal structure of Mars. In: Kieffer, H.H., Jakosky, B.M.,
Snyder, C.W., Matthews, M.S. (Eds.), Mars. University of Arizona Press, Tucson,
Arizona, pp. 184–207.
Marty, J.C., Balmino, G., Duron, J., Rosenblatt, P., Le Maistre, S., Rivoldini, A., Dehant,
V., Van Hoolst, T., 2008. Martian gravity field model and its time variations
from MGS and ODYSSEY data, submitted to Planet. Space Sci.
Montmessin, F., 2006. The orbital forcing of climate changes on Mars. Space Sci.
Rev. 125 (1–4), 457–472.
Morabito, D.D., Shambayati, S., Finley, S., Fort, D., 2003. The Cassini May 2000 solar
conjunction, antennas and propagation. IEEE Trans. 51 (2), 201–219.
Neukum, G., Jaumann, R., Hoffmann, H., Hauber, E., Head, J.W., Basilevsky, A.T.,
Ivanov, B.A., Werner, S.C., van Gasselt, S., Murray, J.B., McCord, T., The HRSC CoInvestigator Team, 2004. Recent and episodic volcanic and glacial activity on
Mars revealed by the high resolution stereo camera. Nature 432 (7020),
971–979.
Pätzold, M., Tellmann, S., Häusler, B., Hinson, D., Schaa, R., Tyler, G.L., 2005. A
sporadic third layer in the ionosphere of Mars. Science 310 (5749), 837–839.
Reasenberg, R.D., King, R.W., 1979. The rotation of Mars. J. Geophys. Res. 84,
6231–6240.
Rivoldini, A., 2008. The interior structure of terrestrial planets. An application to
Mars. Ph.D. Thesis, Universit Catholique de Louvain (in French).
Rivoldini, A., Verhoeven, O., Menvielle, M., Mocquet, A., Vacher, P., Choblet, G., Van
Hoolst, T., Dehant, V., 2008a. Planetary interiors structure inferred from
electromagnetic, geodetic and seismic network science II: Inverse problem, in
preparation.
Rivoldini, A., Verhoeven, O., Mocquet, A., Van Hoolst, T., 2008b. The interior
structure and mineralogical composition of Mars, in preparation.
Rivoldini, A., Van Hoolst, T., Dehant, V., 2008c. New nutation computation in the
frame of future missions to Mars, in preparation.
Roosbeek, F., 2000. Analytical developments of rigid Mars nutation and tide
generating potential series. Celest. Mech. Dyn. Astron. 75, 287–300.
Rosenblatt, P., Marty, J.C., Perosanz, F., Barriot, J.P., van Hoolst, T., Dehant, V., 2004.
Numerical simulations of a Mars geodesy network experiment: effect of orbiter
angular momentum desaturation on Mars’ rotation estimation. Planet. Space
Sci. 52.
Rosenblatt, P., Lainey, V., Le Maistre, S., Marty, J.C., Dehant, V., Pätzold, M., Van
Hoolst, T., Häusler, B., 2008a. Accurate Mars Express orbits to improve the
determination of the mass and ephemeris of the Martian moons. Planet. Space
Sci. 56.
Rosenblatt, P., Duron, J., Marty, J.C., Le Maistre, S., Balmino, G., Dehant, V., Pätzold,
M., 2008b. Seasonal gravity changes of Mars from Mars Global Surveyor. Mars
Odyssey, and Mars Express, in preparation.
Sanchez, B., Haberle, R., Schaeffer, J., 2004. Atmospheric rotational effects on Mars
based on the NASA Ames general circulation model: angular momentum
approach. J. Geophys. Res. 109 (E8) (CiteID: E08005).
Sanloup, C., Jambon, A., Gillet, P., 1999. A simple chondritic model of Mars. Phys.
Earth Planet. Interact. 112 (1–2), 43–54.
Sasao, T., Okubo, S., Saito, M., 1980. A simple theory on the dynamical effects of a
stratified fluid core upon nutational motion of the Earth. In: Nutation and the
Earth’s rotation. Proceedings of the IAU Symposium, May 23–28, 1977, Kiev,
Ukrainian SSR. D. Reidel Publishing Co., Dordrecht, pp. 165–183.
Schubert, G., Spohn, T., 1990. Thermal history of Mars and the sulfur content of its
core. J. Geophys. Res. 95, 14095–14104.
Schubert, G., Bercovici, D., Glatzmaier, G.A., 1990. Mantle dynamics in Mars and
Venus—influence of an immobile lithosphere on three-dimensional mantle
convection. J. Geophys. Res. 95, 14105–14129.
Schumacher, S., Breuer, D., 2006. Influence of a variable thermal conductivity on
the thermochemical evolution of Mars. J. Geophys. Res. 111 (E2) (CiteID:
E02006).
Smith, D.E., Zuber, M.T., Frey, H.V., Garvin, J.B., Head, J.W., Muhlerman, D.O.,
Pettengill, G.H., Phillips, R.J., Solomon, S.C., Zwally, H.J., Banerdt, W.B., Duxbury,
T.C., 1998. Topography of the northern hemisphere of Mars from the Mars
orbiter laser altimeter. Science 279 (5357), 1686.
Smith, D.E., Zuber, M.T., Neumann, G.A., 2001. Seasonal variations of snow depth on
Mars. Science 294 (5549), 2141–2146.
Sniffin, R., Slobin, S., Morabito, D., Bedrossian, A., Shin, D., Paul, L., 2000. DSMS
Telecommunications Link Design Handbook, CL 06-2686, Rev. E.
Sohl, F., Spohn, T., 1997. The interior structure of Mars: implications from SNC
meteorites. J. Geophys. Res. 102 (E1), 1613–1636.
Sohl, F., Schubert, G., Spohn, T., 2005. Geophysical constraints on the composition
and structure of the Martian interior. J. Geophys. Res. 110, E12008.
Spohn, T., Sohl, F., Breuer, D., 1998. Mars. Astron. Astrophys. Rev. 8 (3), 181–235.
�ARTICLE IN PRESS
V. Dehant et al. / Planetary and Space Science 57 (2009) 1050–1067
Spohn, T., Acuña, M.H., Breuer, D., Golombek, M., Greeley, R., Halliday, A., Hauber,
E., Jaumann, R., Sohl, F., 2001. Geophysical constraints on the evolution of Mars.
Space Sci. Rev. 96 (1/4), 231–262.
Stevenson, D.J., 2001. Mars’ core and magnetism. Nature 412, 214–219.
Trotignon, J.G., Parrot, M., Cerisier, J.C., Menvielle, M., Axford, W.I., Paëtzold, M.,
Warnant, Wernik, A.W., 2000. The plasma environment of Mars: from the
shocked solar wind down to the ionosphere. Planet. Space Sci. 48 (12–14),
1181–1191.
Tyler, G.L., Balmino, G., Hinson, D.P., Sjogren, W.L., Smith, D.E., Simpson, R.A.,
Asmar, S.W., Priest, P., Twicken, J.D., 2001. Radio science observations with
Mars global surveyor: orbit insertion through one Mars year in mapping orbit.
J. Geophys. Res. 106 (E10), 23327–23348.
Van den Acker, E., Van Hoolst, T., de Viron, O., Defraigne, P., Dehant, V., Forget, F.,
Hourdin, F., 2002. Influence of the winds and of the CO2 mass exchange
between the atmosphere and the polar ice caps on Mars’ orientation
parameters. J. Geophys. Res. 107 (E7), 91, 5055, doi:10.1029/2000JE001539.
Van Hoolst, T., Dehant, V., Defraigne, P., 2000a. Sensitivity of the free core nutation
and the Chandler wobble to changes in the interior structure of Mars. Phys.
Earth Planet. Interact. 117, 397–405.
Van Hoolst, T., Dehant, V., Defraigne, P., 2000b. Chandler Wobble and free core
nutation for Mars. Planet. Space Sci. 48 (12–14), 1145–1151.
Van Thienen, P., Rivoldini, A., Van Hoolst, T., Lognonné, P., 2006. A top-down origin
for Martian mantle plumes. Icarus 185 (1), 197–210.
Van Thienen, P., Benzerara, K., Breuer, D., Gillmann, C., Labrosse, S., Lognonné, P.,
Spohn, T., 2007. Water, life, and planetary geodynamical evolution. In: Herring,
T., Schubert, J. (Eds.), Treatise of Geophysics, vol. 129 (1–3). Elsevier Publ.,
Amsterdam, pp. 167–203 (invited paper).
1067
Verhoeven, O., Rivoldini, A., Vacher, P., Mocquet, A., Choblet, G., Menvielle, M., Dehant,
V., Van Hoolst, T., Sleewaegen, J., Barriot, J.-P., Lognonné, P., 2005. Interior structure
of terrestrial planets. I. Modeling Mars’ mantle and its electromagnetic, geodetic
and seismic properties. J. Geophys. Res. 110 (E4), E04009.
Verhoeven, O., Vacher, P., Mocquet, A., Rivoldini, A., Menvielle, M., Arrial, P.A.,
Choblet, G., Tarits, P., Dehant, V., Van Hoolst, T., 2008. Constraints on thermal
state and composition of the Earth’s lower mantle from electromagnetic
impedances and seismic data. J. Geophys. Res. (in preparation).
Ward, W.R., 1973. Large-scale variations in the obliquity of Mars. Science 181
(4096), 260–262.
Witasse, O., Dutuit, O., Lilensten, J., Thissen, R., Zabka, J., Alcaraz, C., Blelly, P.-L.,
Bougher, S.W., Engel, S., Andersen, L.H., Seiersen, K., 2002. Prediction of a CO2+
2
layer in the atmosphere of Mars. Geophys. Res. Lett.
Yoder, C.F., Standish, E.M., 1997. Martian moment of inertia from Viking lander
range data. J. Geophys. Res. 102 (E2), 4065–4080.
Yoder, C.F., Konopliv, A.S., Yuan, D.N., Standish, E.M., Folkner, W.M., 2003. Fluid core
size of Mars from detection of the solar tide. Science 300 (5617), 299–303.
Yseboodt, M., Barriot, J.P., Dehant, V., 2003. Analytical modeling of the Doppler
tracking between a lander and a Mars orbiter in term of rotational dynamics.
J. Geophys. Res. 108 (E7), 5076 (DOI:2003JE002045).
Zharkov, V.N., Gudkova, T.V., 2000. Interior structure models, Fe/Si ratio and
parameters of figure for Mars. Phys. Earth Planet. Interact. 117 (1), 407–420.
Zharkov, V.N., Molodensky, S.M., 1996. On the Chandler wobble of Mars. Planet.
Space Sci. 44, 1457–1462.
Zuber, M., Lemoine, F., Smith, D., Konopliv, A., Smrekar, S., Asmar, S., 2007. The mars
reconnaissance orbiter radio science gravity investigation. J. Geophys. Res. 112
(E5) (CiteID E05S07).
�
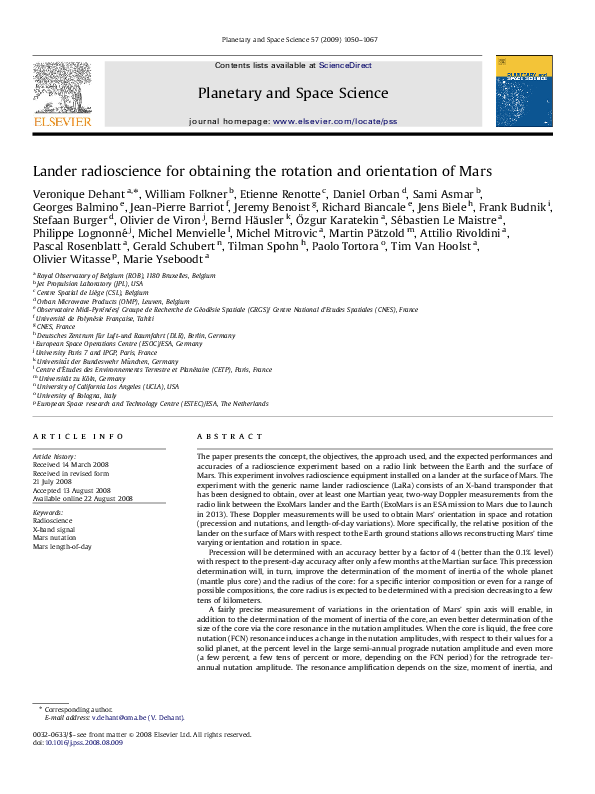
 T. Spohn