Improving pre-stack land data using smart supergrouping
Downloaded 07/09/17 to 82.167.252.134. Redistribution subject to SEG license or copyright; see Terms of Use at http://library.seg.org/
Pavel Golikov1, Maxim Dmitriev1, Andrey Bakulin1, Dmitry Neklyudov2 and Rienk Lakeman3
1
Geophysics Technology, EXPEC Advanced Research Center, Saudi Aramco
2
Institute of Petroleum Geology and Geophysics SB RAS
3
Geophysical Data Processing Division, Saudi Aramco
Summary
Method
3D land seismic data acquired in arid environments is often
challenging for data processing and interpretation, due to
low signal-to-noise ratio and the presence of various types
of noise. Traditionally, large source and receiver arrays
have been utilized for noise suppression and signal
enhancement. A trend in modern seismic data acquisition is
to reduce the size of the source and receiver arrays, aiming
to record broadband signals for imaging and inversion
purposes. For many processing steps and velocity model
building, achieving good pre-stack signal-to-noise ratio
may be more important. We propose a simple but effective
supergrouping technique that significantly enhances prestack data quality. We demonstrate our approach on two 3D
onshore datasets from Saudi Arabia.
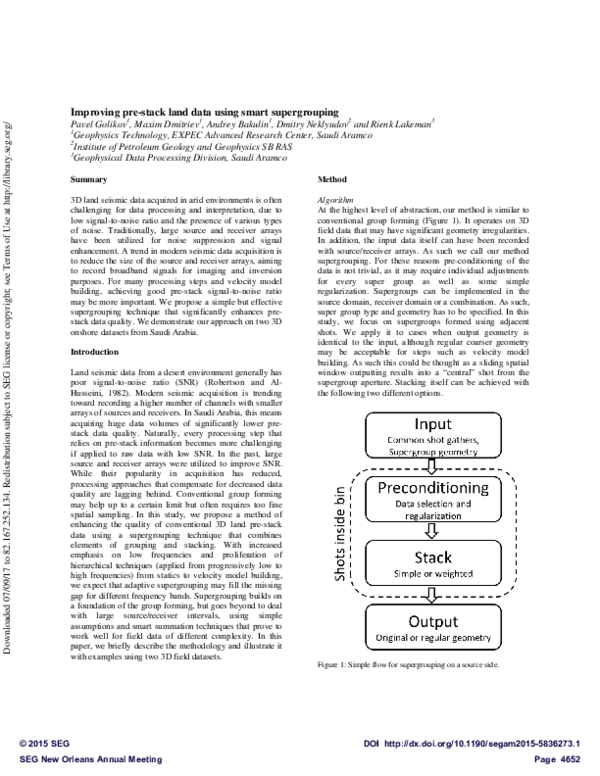
Algorithm
At the highest level of abstraction, our method is similar to
conventional group forming (Figure 1). It operates on 3D
field data that may have significant geometry irregularities.
In addition, the input data itself can have been recorded
with source/receiver arrays. As such we call our method
supergrouping. For these reasons pre-conditioning of the
data is not trivial, as it may require individual adjustments
for every super group as well as some simple
regularization. Supergroups can be implemented in the
source domain, receiver domain or a combination. As such,
super group type and geometry has to be specified. In this
study, we focus on supergroups formed using adjacent
shots. We apply it to cases when output geometry is
identical to the input, although regular coarser geometry
may be acceptable for steps such as velocity model
building. As such this could be thought as a sliding spatial
window outputting results into a “central” shot from the
supergroup aperture. Stacking itself can be achieved with
the following two different options.
Introduction
Land seismic data from a desert environment generally has
poor signal-to-noise ratio (SNR) (Robertson and AlHusseini, 1982). Modern seismic acquisition is trending
toward recording a higher number of channels with smaller
arrays of sources and receivers. In Saudi Arabia, this means
acquiring huge data volumes of significantly lower prestack data quality. Naturally, every processing step that
relies on pre-stack information becomes more challenging
if applied to raw data with low SNR. In the past, large
source and receiver arrays were utilized to improve SNR.
While their popularity in acquisition has reduced,
processing approaches that compensate for decreased data
quality are lagging behind. Conventional group forming
may help up to a certain limit but often requires too fine
spatial sampling. In this study, we propose a method of
enhancing the quality of conventional 3D land pre-stack
data using a supergrouping technique that combines
elements of grouping and stacking. With increased
emphasis on low frequencies and proliferation of
hierarchical techniques (applied from progressively low to
high frequencies) from statics to velocity model building,
we expect that adaptive supergrouping may fill the missing
gap for different frequency bands. Supergrouping builds on
a foundation of the group forming, but goes beyond to deal
with large source/receiver intervals, using simple
assumptions and smart summation techniques that prove to
work well for field data of different complexity. In this
paper, we briefly describe the methodology and illustrate it
with examples using two 3D field datasets.
Figure 1: Simple flow for supergrouping on a source side.
© 2015 SEG
SEG New Orleans Annual Meeting
DOI http://dx.doi.org/10.1190/segam2015-5836273.1
Page 4652
�Improving pre-stack land data using smart supergrouping
Downloaded 07/09/17 to 82.167.252.134. Redistribution subject to SEG license or copyright; see Terms of Use at http://library.seg.org/
Simple stack
For shot-based supergroup, a simple stack denotes
summing neighboring common shot gathers. The selection
and summation process may differ from conventional
group forming. In a typical case of orthogonal 3D land
shooting geometry, source sampling along the source line is
smaller than the distance between source lines. For this
reason, we first stack data in crossline direction (with finer
source sampling) forming traditional source group (works
well for groundroll suppression). In contrast, in the inline
direction (with coarser source sampling), we cannot use
direct summing and instead employ so called commonoffset stack with an appropriate trace selection beforehand.
While such an approach is robust and fast, it obviously
relies on the assumption of a 1D subsurface and as such
may blur shallow reflections at near offsets since time
shifts between traces due to near-surface lateral variations
are ignored.
3D Field Data Examples
We demonstrate benefits of the proposed approach on two
real 3D land datasets from Saudi Arabia acquired with
typical orthogonal acquisition geometry (Vermeer, 2005).
The first dataset is from a good data quality area. It has
been acquired using a nonlinear 2 to 90 Hz sweep. The
surface conditions in this area are relatively simple with
smooth low relief east-west topographic variations (Figure
2a). Therefore the source and receiver layouts are quite
regular. The inline and crossline sampling for receiver
groups is 50 and 250 meters, respectively. Shot groups are
spaced at 250 and 50 meters in inline and crossline
directions, respectively. Receiver group size consists of 5 x
5 geophones covering 50 x 50 m, whereas each source
group comprises three vibrators oriented in the crossline
direction with a 12.5 m interval. This data has relatively
good SNR (Figure 3a).
Weighted stack
To improve the alignment at higher frequencies, we
introduce a weighted stack with special amplitude and
phase corrections for each frequency component of
different common-shot gathers (CSG) in a super group. The
stack is applied in the frequency domain. We formulate the
stacking procedure as a frequency-domain beam-forming
problem. To estimate the optimal stacking weights, we
perform a discrete Fourier transform over time for each
CSG in the super group and construct 2D frequency panels
Fi , i 1,.., N shots . Simple stack of the panels provides us
some preliminary information about the signal. Each panel
is represented as a complex-valued 2D matrix. Then
eigenimage decomposition of the panels is computed using
SVD analysis (Trickett, 2003). We assume that desired
signal components are associated with the elder singular
values, whereas noise components correspond to the
smaller singular values. Using this decomposition, signal
covariance COV S and noise covariance COV N matrices
are estimated. Simple stacked panels for each frequency,
FStack , are also used to construct covariance matrixes to
constrain the weights.
The optimal stacking weights are elements of the first
eigenvector of the matrix: D [COVN1COVS ] , i.e.,
W Principal Component [ D ] (Monzingo and Miller, 1980;
Panea and Drijkoningen, 2008). After computing optimal
complex weights, we stack the original frequency panels
with the corresponding weights: Fw Wi Fi . Finally, we
shots
perform additional noise suppression in each stacked
frequency panel using a Karhunen–Loève filter. This
procedure delivers an enhanced single-frequency panel for
a shot supergroup that could be input to a frequencydomain full-waveform inversion, or an array of processed
frequency panels can be converted back to the time-domain
for further processing.
© 2015 SEG
SEG New Orleans Annual Meeting
Figure 2: Geometry layout and surface condition comparison for
first (top) and second (bottom) field datasets. Green and yellow
dots correspond to the source and receiver positions,
respectively. Top geometry is regular and topography smoothly
varying from west to east. Geometry of the second dataset is
irregular with many missing shots and crooked receiver lines.
Surface topography has rapid variations in some areas.
DOI http://dx.doi.org/10.1190/segam2015-5836273.1
Page 4653
�Downloaded 07/09/17 to 82.167.252.134. Redistribution subject to SEG license or copyright; see Terms of Use at http://library.seg.org/
The second dataset is an example of very challenging data
with extremely poor SNR and represents legacy data
acquired with a narrowband linear sweep of 8 to 80 Hz.
The source and receiver layouts are quite irregular due to
rapid topography variations (Figure 2b) and various surface
obstructions. Receiver groups comprise 6 x 12 geophones
over 55 x 55 m, every 60 meters in the inline direction and
240 meters in the crossline direction. Source groups are
every 60 m crossline and every 120 m inline. Due to the
complex surface and near-surface conditions this data has
very low SNR and has little visible signal on pre-stack
gathers (Figure 5a).
across all offsets including long ones (Figure 6b and 6c).
Weighted stack in this case seems to work better for
shallow reflections. It is interesting to compare a
conventionally processed second dataset (Figure 6a) with
supergrouping applied to raw data (Figure 5b and 5c). One
can observe that this simple procedure that requires little
input seems to produce pre-stack data of better quality
compared to more conventional preprocessing. While
supergrouped may result in some lateral smoothing, we
believe it is fit-for-purpose for early processing stages
where enhancing pre-stack signal is critical.
Conclusions
We apply source side supergrouping and utilize both simple
and weighted stack options for both raw and preprocessed
datasets. The results are shown in Figures 3 to 6. Each plot
has input data (right panel) and results of simple and
weighted stacks (central and right panels, respectively).
Red arrows on the plots mark the main reflections. AGC
was applied for all panels for display purposes.
The first dataset from a good area has visible reflections
(red arrows in Figure 3a) but their amplitude is almost at
the same level as noise especially for shallow (~1.25 s) and
deep (~2.5 s) part. Application of smart supergroup 5 x 5
with the supershot aperture of 250 x 1250 m, significantly
improves SNR and makes both shallow and deep
reflections more crisp (Figure 3b and 3c). As expected,
weighted stacking does better job at near offsets by
reducing blurring effect.
After applying conventional preprocessing the first dataset
shows improved quality with most of the linear noise
suppressed (Figure 4a). Simple stacking reinforces
reflections and weighted stack improve SNR even further
(Figure 4b and 4c). Similar to previous example weighted
stack slightly improves signal at near offsets.
We presented a supergrouping method designed to improve
pre-stack data quality for challenging 3D land datasets. It
can be of value for both raw as well as data preprocessed
for imaging. It goes beyond conventional group forming
and can be used with large source/receiver sampling that
conventional group forming cannot handle. It operates on
original group-formed 3D data and does not require regular
geometry. Such an approach can be of help for many
processing stages. For poor quality data, it can help
identifying obscured target reflections and create a signal
model. We have presented an example of a dataset where
few reflections can be identified without supergrouping. It
may also enhance SNR for first break picking and velocity
analysis or tomographic reconstructions. Supergrouping
with variable aperture also reduces data volume, while at
the same time improving pre-stack data quality. As a result
we can improve turnaround time and design more efficient
processing flows. Even for already preprocessed data, there
may be room for smart supergrouping with smaller
apertures for further improvement of SNR for imaging and
inversion.
The second dataset from a challenging area has such a poor
SNR that no reflections are visible on pre-stack gathers
(Figure 5a). As such it is quite difficult to come up with
any model of signal and noise for further processing. By
using a supergroup of 4 x 7 shots with an aperture of 420 x
840 m, we greatly improve S/N ratio making reflections
visible and ready for analysis (Figure 5b and 5c). In this
case simple stack does slightly better job because weighted
stack highlights similarity in data and is more sensitive to
the noise nature.
We outline two possible stacking options: simple stack and
smart weighted stack. Simple stack is a combination of
grouping and common-offset stacking that has an
advantage in speed and computation cost. It may blur nearoffset and shallow reflections and can be utilized when
higher frequencies and near offset information are not so
important. Smart weighted stack employs a similar
procedure but with data-driven complex weights that
enhance similarity between individual data panels.
Therefore it has a better chance to correct for intra-group
statics, align higher frequency data better and reduce
blurring effects.
The conventional processing flow aimed to suppress
various noises, has a hard time with such a data (Figure 6a)
while supergrouping substantially improves S/N ratio
We conclude that smart supergrouping shows a significant
improvement in data quality and will certainly help further
data processing and velocity analysis.
© 2015 SEG
SEG New Orleans Annual Meeting
DOI http://dx.doi.org/10.1190/segam2015-5836273.1
Page 4654
�Downloaded 07/09/17 to 82.167.252.134. Redistribution subject to SEG license or copyright; see Terms of Use at http://library.seg.org/
Improving pre-stack land data using smart supergrouping
Figure 3. Near cable shot gather comparison for raw first dataset. Both stack methods highlight main reflectors (shown by red
arrows), however weighted stack does slightly better job at near offsets for both shallow and deep reflections.
Figure 4. Near cable shot gather comparison for first dataset with conventional preprocessing. Similar to Figure 1 weighted stack
slightly improves reflection continuity at near offsets for both shallow and deep reflections.
Figure 5. Near cable shot gather comparison for raw second dataset. Note very poor S/N ratio. Main reflections (shown by red
arrows) are not visible at all on left panel while both stack methods bring them up. Weighted stack does slightly worse than
simple stack in this case due to high sensitivity to the noise type.
Figure 6. Near cable shot gather comparison for preprocessed processed second dataset. Signal is still almost invisible at input
data panel and became clearly visible after stack. In this case weighted stack result is noisier but shows better continuity at small
offsets.
© 2015 SEG
SEG New Orleans Annual Meeting
DOI http://dx.doi.org/10.1190/segam2015-5836273.1
Page 4655
�Downloaded 07/09/17 to 82.167.252.134. Redistribution subject to SEG license or copyright; see Terms of Use at http://library.seg.org/
EDITED REFERENCES
Note: This reference list is a copyedited version of the reference list submitted by the author. Reference lists for the 2015
SEG Technical Program Expanded Abstracts have been copyedited so that references provided with the online metadata for
each paper will achieve a high degree of linking to cited sources that appear on the Web.
REFERENCES
Monzingo, R. A., and T. W. Miller, 1980, Introduction to adaptive arrays: John Wiley and Sons, Inc.
Panea, I., and G. Drijkoningen, 2008, The spatial data-adaptive minimum-variance distortionless-response
beamformer on seismic single-sensor data: Geophysics, 73, no. 5, Q29–
Q42. http://dx.doi.org/10.1190/1.2969058.
Robinson, D., and M. Al-Husseini, 1982, Technique for reflection prospecting in the Rub’ Al-Khali:
Geophysics, 47, 1135–1152. http://dx.doi.org/10.1190/1.1441377.
Trickett, S. R., 2003, F-xy Eigen image noise suppression: Geophysics, 68, 751–
759. http://dx.doi.org/10.1190/1.1567245.
Vermeer, G., 2005, 3D seismic survey design: SEG.
© 2015 SEG
SEG New Orleans Annual Meeting
DOI http://dx.doi.org/10.1190/segam2015-5836273.1
Page 4656
�
 Andrey Bakulin