THE JOURNAL OF ECONOMIC HISTORY
VOLUME 77
December 2017
NUMBER 4
The (South) American Dream:
Mobility and Economic Outcomes of
First- and Second-Generation Immigrants
in Nineteenth-Century Argentina
SANTIAGO PÉREZ
I study the mobility and economic outcomes of European immigrants and their
children in nineteenth-century Argentina, the second largest destination country
during the Age of Mass Migration. I use new data linking males across censuses
and passenger lists of arrivals to Buenos Aires. First-generation immigrants
experienced faster occupational upgrading than natives. Occupational mobility
was substantial relative to Europe; immigrants holding unskilled occupations
upon arrival experienced high rates of occupational upgrading. Second-generation
immigrants outperformed the sons of natives in terms of literacy, occupational
status and access to property, and experienced higher rates of intergenerational
mobility out of unskilled occupations.
D
uring the Age of Mass Migration (1850–1913), 55 million Europeans
left their countries of origin and moved to the New World. After
the United States, Argentina was the second largest destination country
in the period, receiving 6.2 million immigrants. By 1914, 30 percent of
Argentina’s population was foreign-born.
The Journal of Economic History, Vol. 77, No. 4 (December 2017). © The Economic History
Association. All rights reserved. doi: 10.1017/S0022050717000808
Santiago Pérez is Assistant Professor, Department of Economics, University of California,
Davis, 1118 Social Sciences and Humanities, Davis, CA 95616. E-mail: seperez@ucdavis.edu.
I have bene¿ted from comments from Ran Abramitzky, Carolina Biernat, Arun Chandrasekhar,
Melanie Morten, Gavin Wright, and two anonymous referees, as well as several participants in
the Stanford Economic History seminar. I am also grateful to Enrique Pérez, Mercedes Pérez,
Fernanda Righi, Mariana Righi, Lisandro Vaccaro, and María Fabiana Vaccaro for helping me
with data collection and to Fiona Stewart for proofreading. This article bene¿ted from funding
from the Stanford University Economics Department; the Economic History Association through
the Exploratory Data and Travel Grant and the Dissertation Fellowship; the Graduate Student
Fellowships in International Development through a grant from the Stanford Center for International
Development; and the Leonard W. Ely and Shirley R. Ely Graduate Student Fund Fellowship.
971
�972
Pérez
The conventional view on this migration episode is that Argentina
constituted a “land of opportunity,” offering European immigrants a
good chance to experience upward economic mobility.1 Although this
view has been pervasive in the historical literature,2 there is little quantitative evidence to support it. Moreover, the quantitative evidence that
does exist is based on the published tabulations of the census. While
these tabulations provide useful information on the economic performance of immigrants at one point in time, they offer little insight into
how immigrants progressed as they spent time in the country. In addition, the published census data contain no information on parental place
of birth, which prevents a systematic study of second-generation immigrants’ economic performance.
I study the mobility and economic outcomes of European immigrants
and their children in nineteenth-century Argentina. To do so, I use newly
collected data linking males across the 1869 and 1895 national censuses
of population and passenger ship lists of immigrant arrivals to the city of
Buenos Aires (Pérez 2017). These data enable me to follow a large group
of immigrants and their children and to track their progress while in the
country. To the best of my knowledge, this article is the ¿rst to use longitudinal data following individuals over time and across places to provide
evidence on the economic performance of immigrants in late nineteenthcentury Argentina.
The ¿rst part of my analysis looks at the occupational mobility of ¿rstgeneration immigrants. I ask whether immigrants started in lower paying
occupations than natives but converged to them as they spent time in the
country. I ¿nd that, upon arrival, European immigrants held on average
slightly lower paying occupations than natives. Yet, consistent with
assimilation into the labor market of Argentina, my ¿ndings suggest that
immigrants from most of the major sending countries outpaced natives
in terms of occupational upgrading. These results contrast with recent
evidence on the Age of Mass Migration in the United States (Abramitzky,
Boustan, and Eriksson 2014), where immigrants appear to have experienced similar rates of occupational upgrading as natives.
Once I have characterized the occupational progress of immigrants
after their arrival to Argentina, I study the extent to which immigrants who
stayed in Argentina experienced progress relative to their pre-migration
1
For instance, Szuchman (1981) argues that “Argentines never rejected the belief that their
society represented an open system of economic opportunities proven by the upwardly mobile
population.”
2
See, for example, Baily (1983), Conde (1979), Diaz-Alejandro (1970), and Klein (1983)
among others.
�Mobility and Economic Outcomes of Immigrants
973
occupations. I ¿nd that immigrants were very likely to upgrade their
occupations: About 75 percent of those who declared an unskilled occupation upon arrival experienced occupational upgrading in less than 15
years. Moreover, relatively skilled immigrants experienced little occupational downgrading. Comparing my results to evidence from similarly
constructed data for the United States (Ferrie 1997), my ¿ndings suggest
that European immigrants in Argentina were better able to exploit their
pre-migration human capital than those migrating to the United States.
My data only enable me to characterize the occupational trajectories
of immigrants who migrated permanently to Argentina. These immigrants are of special interest from a historical point of view, since they
participated in the labor market of Argentina for many years and were
also likely to raise children in the country. However, in interpreting the
results described earlier, it is useful to bear in mind that the experience of
the average immigrant might have been different from the experience of
those who settled permanently.
The second part of my analysis focuses on the children of European
immigrants: the “second generation.” I ¿nd that the sons of European
immigrants experienced substantially better economic outcomes than the
sons of natives: They were more likely to be literate, held higher paying
occupations and were more likely to own property as adults. The relative advantage of the second generation was not con¿ned to any single
sending country. Rather, the sons of immigrants from every major sending
country outperformed the sons of natives. In explaining these results, I
provide suggestive evidence that the higher “ethnic capital” (Borjas
1992) of the children of European immigrants might have contributed to
their advantages in adulthood.
Finally, I contrast the intergenerational mobility of second-generation
immigrants to that of the children of natives. I ¿nd a relatively similar
persistence of occupational status among second-generation immigrants
compared to children of natives. On the one hand, the children of unskilled
European immigrants were more likely to exit those occupations than the
children of unskilled natives. However, the sons of white-collar immigrants were more likely to work in white-collar occupations in adulthood
than the sons of white-collar natives. As a result, occupational persistence was on average similar across the two groups.
A number of features make Argentina in the Age of Mass Migration
an interesting case study of the economic performance of international
immigrants. First, the magnitude of the migration Àow relative to the
native population was substantial by both historical and contemporary
standards. Second, in contrast to immigrants entering the United States
�974
Pérez
during this time period and to many immigrants today, immigrants
entering Argentina exhibited higher levels of human capital than natives
and came from countries that resembled Argentina in terms of average
living standards.3 Hence, this migration episode can shed light on what
immigrant assimilation might look like in a setting where immigrants had
high human capital and were a fairly numerous group relative to natives.
Finally, the opportunity to construct longitudinal data that follow a large
number of immigrants and their children enables me to deal with some of
the methodological challenges faced by researchers studying immigrant
assimilation (Borjas 1985; Abramitzky, Boustan, and Eriksson 2014).
HISTORICAL CONTEXT AND RELATED LITERATURE:
ARGENTINA IN THE AGE OF MASS MIGRATION
The 1853 Constitution made it a national priority to attract European
immigrants to help populate the vast and sparsely populated Argentine
territory. In the mind of the elites governing the country, immigrants
from Europe—especially those from the north of the continent—were
needed to provide a “civilizing inÀuence” that would enable Argentina to
grow as a prosperous and free nation (Alberdi 1852).4
From 1857 to 1930, Argentina received 6.2 million immigrants from
Europe, becoming the second largest receiving country in the period (after
the United States) and the largest in per-capita terms (Germani 1966).
Figure 1 shows the number of yearly arrivals of overseas immigrants to
Argentina. Until 1862, the number of yearly arrivals was below 10,000,
but started to increase rapidly thereafter. This increase coincided with the
uni¿cation of the different provincial governments into a single national
authority following the Battle of Pavón in 1861. By 1914, the year of the
third national census, Argentina’s population had grown from less than
two million in 1869 to more than eight million, of which 30 percent were
foreign born.
Despite the Argentine elites’ desire to attract immigrants from the
north of Europe, nearly half of the immigrants were of Italian origin. In
1895, Italian immigrants accounted for 11 percent of the population of
3
In 1869, the literacy rate among males over 18 years old was 26 percent for natives and 61
percent for immigrants. I estimated that the typical sending country had a per capita GDP that
ranged from 80 to 120 percent that of Argentina in the 1875–1890 period and about 60 percent in
the 1890–1914 period. In the United States, this ¿gure ranged from 40 to 60 percent in 1875–1890
and 40 to 50 percent in 1890–1914. Own elaboration based on Dirección General de Inmigración
(1925), Ferenczi (1929), and Maddison (2007).
4
See Devoto and Benencia (2003) for an overview of the history of immigration to Argentina.
See Taylor (1994) for a comparison between mass migration to Argentina and Australia.
�975
1st National Census
2nd National Census
0
50000
N
100000
150000
200000
Mobility and Economic Outcomes of Immigrants
1860
1870
1880
Year
1890
1900
FIGURE 1
NUMBER OF NEW IMMIGRANT ARRIVALS, 1857–1900
Source: Argentina, Anuario de la Dirección General de Estadística (1908).
Argentina. Spain was the second most numerous sending country, representing around a third of the total immigration. Although immigrants
from France were not as numerous overall, they accounted for a relatively large fraction of the early-arriving immigrants that are the main
focus of this article.
Conventional accounts of the period describe Argentina as a country
where “hard working” immigrants had an easy path to upward economic
mobility (Alsina 1898). Although this view is also popular among early
scholars (Diaz-Alejandro 1970; Conde 1979; Baily 1983), there is little
quantitative evidence supporting it. In a series of widely debated studies,
Gino Germani (1966) uses the published census tabulations to study the
extent of occupational mobility in nineteenth-century Argentina. His
study ¿nds that immigrants moved up the occupational ladder at a faster
pace than natives. However, a concern with inferring mobility from
aggregate data is that the pool of immigrants changes from census to
census, either because new immigrants arrive to the country or because
some return to their countries of origin. Hence, it is not possible to disentangle changes in the social standing of immigrants from changes in the
composition of the immigrant pool. In the case of Argentina, an added
dif¿culty is the lack of information on year of arrival to the country in the
nineteenth-century censuses.
A more recent study by María Liliana Da Orden (2005) also offers
some support for the optimistic view of immigrant social mobility. The
�976
Pérez
author studies the occupational mobility of Spanish immigrants in Mar
del Plata, a coastal city in the Province of Buenos Aires. By linking birth
and marriage records of the children of immigrants, she is able to observe
immigrants’ occupation at two different points in time. She documents
that, after an average of 26 years, 51 percent of the immigrants in her
sample had moved up in the occupational ladder.
Other studies present a more negative outlook on the possibilities for
social progress in nineteenth-century Argentina. Mark Szuchman (1981)
links census records from 1869 to 1895 for immigrants and natives
residing in the city of Córdoba. He ¿nds that upward mobility was rare
among immigrants, although the author is only able to follow individuals who had stayed in the city of Córdoba until 1895. Eugene F. Sofer
(1982) examines the occupational mobility of Eastern European Jewish
immigrants in the city of Buenos Aires at the late nineteenth-century.
The author links individuals from the 1895 census to the records of the
Chevrah Kedyscha Ashkenazi, the main Jewish association in Buenos
Aires. He documents little upward mobility, with most immigrants
remaining trapped in unskilled jobs or even experiencing downward
mobility.
Existing studies that use individual level data to assess the economic
mobility of immigrants suffer from two main limitations.5 First, these
studies focus on either speci¿c immigrant groups or on immigrants
living in speci¿c places within Argentina. Second, because economic
and geographical mobility are probably associated, limiting the analysis
to immigrants who did not change their place of residence is likely to
underestimate the economic mobility experienced by the typical immigrant. Later, I show that failing to track internal migrants indeed results
in lower estimated rates of occupational mobility among ¿rst-generation
immigrants.
From a methodological point of view, this article is closely related to
Joseph P. Ferrie (1997) and Ran Abramitzky, Leah Platt Boustan, and
Katherine Eriksson (2014). Ferrie (1997) links records of ship arrivals of
immigrants to U.S. censuses in the Antebellum period to look at the occupational mobility of immigrants relative to Europe. The author ¿nds that
immigrants, in particular those from Britain and Germany, experienced
relatively high rates of upward occupational mobility during this time
period. Abramitzky, Boustan, and Eriksson (2014) use linked census data
to study the labor market assimilation of immigrants in the United States
5
Other studies on speci¿c immigrant communities include Míguez’ (1993) on the Province of
Buenos Aires, Otero’s (1994) study on French immigrants in the city of Tandil, and Tolcachier’s
(1995) study on Israeli immigrants.
�Mobility and Economic Outcomes of Immigrants
977
at the early twentieth-century. The authors ¿nd that immigrants exhibited
similar rates of occupational upgrading as natives.
This article is also related to a growing body of literature in economic
history that uses linked data to study historical migration episodes. In
addition to the two articles described earlier, some other examples include
Abramitzky, Boustan, and Eriksson (2012, 2013), Boustan, Matthew E.
Kahn, and Paul W. Rhode (2012); William J. Collins and Marianne H.
Wanamaker (2014, 2015); Jason Long and Ferrie (2013), Long (2005),
Edward Kosack and Zachary Ward (2014), and Laura Salisbury (2014).
In contrast to this article, the focus of this literature has been to study
either internal migrations within the United States or the United Kingdom
or international migrations to the United States.
DATA
Linking the 1869 and 1895 Censuses
I constructed a new sample following natives and immigrants across
Argentina’s national censuses of 1869 and 1895. To do so, I took advantage of the fact that both censuses’ handwritten manuscripts are indexed
and can be searched through the genealogy website FamilySearch.org.6
The sample includes males—natives and immigrants—who were of
working-age in both census years and males—sons of natives and nativeborn sons of immigrants—who were observed in their childhood household in 1869 and as adults in 1895.
To construct this sample, I identi¿ed two groups of individuals in
the 1869 census full count: (1) males 18 to 35 years old, born in either
Argentina or one of the six largest European sending countries (England,
France, Germany, Italy, Spain, and Switzerland), and (2) males 0 to 17
years old, born in Argentina, with father present in the household and father
born in Argentina or one of the European countries listed earlier. These
six European countries were the only sending countries with more than
1,000 residents in the relevant age cohort in 1869 Argentina, accounting
for more than 95 percent of all European immigrants at that time.7 These
two groups included a total of 448,201 individuals, of which 58,755 were
6
These are the only two national censuses of Argentina for which individual records with
names are available. The next national census took place in 1914. Unfortunately, the individual
records of this census were lost, so it is not possible to extend the sample ahead in time.
7
Because the 1869 census lacks information on relationship to head of household, I used a
procedure similar to the one used by IPUMS to identify fathers and sons. See the Online Appendix
for further details.
�978
Pérez
born in one of the European sending countries included in the analysis and
22,932 were native-born sons of immigrants from these countries.
I then searched the 1895 census full count for a set of potential matches
for each of these individuals. Based on the similarity in reported names
and (estimated) years of birth, I calculated a linking score ranging from 0
to 1 for each pair of potential matches: Higher scores represented pairs of
records that were more similar to each other. Full details on the procedure
used to compute the linking scores are provided in the Online Appendix.
I used these linking scores to inform my decision rule on which records
to incorporate into the analysis. To be considered a unique match for
an individual in the 1869 census, a record in the 1895 census had to
satisfy three conditions: (1) be the record with the highest linking score
among all the potential matches for that individual, (2) have a linking
score earlier a minimum threshold (p1 > _p), and (3) have a linking score
p
suf¿ciently higher than the second-best linking score 1 > l . 8
p2
Because the linking is based on potentially noisy information, there
is a trade-off in choosing the cutoff values _p and l. On the one hand,
higher values of _p and l imply that a larger fraction of true matches will
be discarded from the analysis. In addition, individuals who report their
identifying information with high accuracy and have more uncommon
names—within their place and year of birth—are more likely to be
uniquely matched under a more stringent rule. On the other hand, lower
values of _p and l will lead to a larger sample but to a higher share of
incorrect matches. With this trade-off in mind, my baseline results are
based on a sample created using a relatively conservative choice of the
parameters _p and l. As a result, my matching rates are lower than those
typically found in recent economic history papers using U.S. census data.
The matching rate was 11.6 percent for sons of natives and 13.6
percent for sons of immigrants. I was able to uniquely link approximately
9.5 percent of working-age natives and 10 percent of working-age immigrants. Table A.1 in the Online Appendix shows the matching rates that
resulted from this linking process, disaggregated by country of origin
and by age group. I provide a detailed discussion on matching rates and
additional sources of match failure in Online Appendix Table A.2.9 Once
8
This decision rule is analogous to the one used by Mill and Stein (2012), Parman (2015), and
Feigenbaum (2016, 2017).
9
While immigrants are expected to have a lower matching rate because of return migration,
they also resided in areas of Argentina with relatively lower mortality levels. For instance, natives
born in Buenos Aires and aged 18 to 35 years old exhibited a 25 percent mortality rate from 1869
to 1895, whereas the average native exhibited a mortality rate above 40 percent during the same
time period. In addition, European immigrants had substantially higher literacy levels, implying
that their identifying information is likely to be reported with less error.
�Mobility and Economic Outcomes of Immigrants
979
I had completed the linking procedure, I manually digitized the economic
outcomes variables using the handwritten census manuscripts available
online at FamilySearch.org. In the case of working-age immigrants,
children of immigrants and children of natives, I digitized the economic
outcome variables for every individual in the linked sample. In the case
of working-age natives, I digitized the economic outcomes only for a
random sample of the linked individuals. The ¿nal sample includes about
6,000 working-age natives, 5,000 working-age immigrants, 18,000 sons
of natives and 2,500 native-born sons of immigrants.
Linking Passenger Lists to the 1895 Census
To assess the extent to which immigrants experienced occupational progress relative to Europe, I complement the earlier data with
a sample linking male immigrants arriving to the city of Buenos Aires
to the 1895 census. To construct this sample, I started with a sample of
54,036 working-age10 immigrants who appeared in ship arrival records
between 1882 and 1894.11 These records were originally collected by the
National Migration Of¿ce and have been digitized by CEMLA (Centro
de Estudios Migratorios Latinoamericanos), a research center in Buenos
Aires. Each record contains the name, occupation, date of arrival, port
of origin and entry, civil status, and age of each passenger on the ship.
In this time period, about 75 percent of immigrants entered Argentina
through the port of Buenos Aires (Dirección General de Inmigración
1925).
I then linked these immigrants to the 1895 census using a method analogous to the one described earlier. I was able to link 3,157 immigrants,
which represents approximately a 6 percent matching rate. Linking these
data is more challenging than linking the censuses because immigrants
typically declared their original ¿rst name upon arrival but adopted
a Spanish version of it while in Argentina.12 Table A.3 in the Online
Appendix shows the number of individuals and linked individuals in this
sample, by country of birth.
10
To be included in the sample, an individual had to be: (1) aged 18 to 60 years old upon arrival
and (2) 60 years old or less by 1895.
11
Passenger lists started to be systematically collected following the 1876 Immigration Law,
but all the individual records prior to1881 have been lost. Then, unlike Ferrie (1997), I am
unfortunately unable to observe an immigrant both in the 1869 and 1895 censuses and in the
passenger lists.
12
Because some of the name changes are predictable—for instance, Italian immigrants named
Giuseppe adopted the name José—I am able to partially address this issue by performing the
linking based on a Spanish version of the ¿rst name. Further details are provided in the Online
Data Appendix.
�980
Pérez
Comparing the Linked Samples to the Population
Given the absence of numerical identi¿ers in the data, names provide
the most important source of information in the linking procedure. The
dependence on names could lead to a biased sample if having a name that
is both uncommon and accurately recorded is correlated with social and
economic characteristics. In this subsection, I compare individuals in the
linked samples to individuals in the cross-sectional data. I provide further
details on this comparison in the Online Appendix.
The Online Appendix Tables A.4 to A.7 show the results of these
comparisons. In these tables, I compare natives and immigrants in the
linked sample to natives and immigrants in the 1869 and 1895 census
cross-sections, based on the nationally representative census samples
compiled by Jorge L. Somoza (1967). Overall, the evidence suggests
some degree of positive selection of individuals into the linked census
sample. First, the white-collar occupational category tends to be overrepresented in the linked sample, with the fraction of white-collar workers
being 2 percentage points higher than in the cross-section among nativeborn working-age individuals in the 1895 census. Second, individuals in
the linked sample were 10 percentage points more likely to own property
and 9 percentage points more likely be literate.
In Table A.8 in the Online Appendix, I compare immigrants in the
passenger lists who were matched to an observation in the 1895 census
to immigrants who were not, as well as immigrants in the linked sample
in 1895 to immigrants in the 1895 cross-section. The main difference
between the linked sample and the cross-section is that immigrants from
Spain are overrepresented in the linked sample. For instance, while only
20 percent of immigrants in the passenger lists were from Spain, 35
percent of immigrants in the linked sample were from this country. This
overrepresentation likely reÀects the fact that immigrants from Spain did
not change their names upon arrival to Argentina, making it easier to ¿nd
them in the 1895 census.
Occupations and Earnings Data
Similar to U.S. national censuses of the period, nineteenth-century
Argentine censuses lack information on individual-level earnings or
income. I dealt with this feature of the data using two standard approaches
in the literature. First, following Abramitzky, Boustan, and Eriksson
(2012, 2014) and Collins and Wanamaker (2014), I constructed a measure
�Mobility and Economic Outcomes of Immigrants
981
of typical earnings by occupation.13 Second, I classi¿ed the occupational
titles into occupational categories.
To create the occupational earnings measure, I employed information
from a variety of historical sources. First, I used information on daily
wages in blue-collar occupations in the city of Buenos Aires from William
I. Buchanan (1998). Second, I used the published census volumes to
construct estimates of earnings in the commercial and industrial sectors.
Third, I used the congressional reports of Antonio M. Correa and Emilio
Lahitte (1898) to estimate earnings in the farming sector. Table A.9 in the
Online Appendix shows the sources of income data used in the analysis.
Further details on the construction of this earnings measure, including
more information on the sources and assumptions are provided in the
Online Appendix.
It is worth emphasizing that constructing a measure of typical earnings
is challenging, especially for self-employed individuals. As a result, I
conducted a number of sensitivity checks to assess the robustness of the
results that rely on the occupational score. In particular, I paid special
attention to the issue of assigning earnings to farmers.
I also classi¿ed the more than 100 occupational titles in my sample
into broad occupational categories.14 To do so, I ¿rst assigned each
occupation a code from the Historical International Classi¿cation of
Occupations (HISCO). This classi¿cation is based on the International
Standard Classi¿cation of Occupations (ISCO) and has been adapted to
deal with historical data. I then mapped each HISCO code to an occupational category using the Historical International Social Class Scheme
(HISCLASS), developed by Ineke Maas, Andrew Miles and Marco
H.D. Van Leeuwen (2002). Finally, I collapsed the HISCLASS scheme
into four broad categories following Long and Ferrie (2013): whitecollar (HISCLASS 1–5), farmer (HISCLASS 8), skilled/semi-skilled
(HISCLASS 6–7, 9) and unskilled (HISCLASS 10–12). Table 1 shows
the ten most common occupations for working-age individuals in 1895
and their corresponding occupational category, reported separately for
natives and immigrants in the linked census sample.
13
Abramitzky, Boustan, and Eriksson (2014) use median wages by occupation constructed
from the 1950 U.S. census and mean wages from the Cost of Living Survey of 1901 to construct
occupational earnings in the 1900, 1910, and 1920 censuses. Collins and Wanamaker (2014)
construct occupational earnings by adjusting industry wages by demographic characteristics and
location.
14
This approach is followed by Ferrie (1997, 1999), Long and Ferrie (2013), Abramitzky,
Boustan, and Eriksson (2014), among other researchers.
�982
Pérez
TABLE 1
FREQUENT OCCUPATIONS, 1895 CENSUS
(a) Natives
Occupation
Frequency
Percent
Farmer
Laborer
Breeder
Storekeeper
Independent means
Carpenter
Carter
Public employee
Construction worker
Shepherd
2,943
1,249
536
330
238
166
156
115
110
97
38.73
16.44
7.05
4.34
3.13
2.18
2.05
1.51
1.45
1.28
Total top 10
Total
5,940
7,599
78.17
100
Occupational Group
Farmer
Unskilled
Farmer
White collar
White collar
Skilled/semi-skilled
Skilled/semi-skilled
White collar
Skilled/semi-skilled
Unskilled
(b) Immigrants
Occupation
Farmer
Storekeeper
Laborer
Independent means
Carpenter
Construction worker
Breeder
Shoemaker
Carter
Clerk
Total top 10
Total
Frequency
Percent
964
873
650
302
212
196
153
117
89
72
17.42
15.77
11.74
5.46
3.83
3.54
2.76
2.11
1.61
1.30
3,628
5,535
65.55
100
Occupational Group
Farmer
White collar
Unskilled
White collar
Skilled/semi-skilled
Skilled/semi-skilled
Farmer
Skilled/semi-skilled
Skilled/semi-skilled
White collar
Notes: This table shows the ten most frequent occupations in 1895 among working-age natives
and immigrants in the sample linking the 1869 and 1895 national censuses.
Sources: Linked sample created by following working-age individuals through the 1869 and 1895
population censuses of Argentina. The text and Online Appendix described sample construction
in detail.
There are three limitations associated with using occupations rather
than earnings to measure labor market assimilation. First, I am not able to
capture changes in an individual’s social standing that stem from changes
in their economic status within a given occupation. Second, the occupational earnings measure explicitly ¿xes the ranking of occupations in
its 1895 level. As a result, the measure is unable to capture changes in
economic status that occur due to changes in the distribution of income
�Mobility and Economic Outcomes of Immigrants
983
across occupations over time.15 Third, because the censuses lack a question on employment status, I cannot distinguish employed from unemployed individuals.
THE FIRST GENERATION
Occupational Mobility of Natives and Immigrants
Panel (a) in Table 2 shows a transition matrix for natives, while
Panel (b) shows this same matrix for immigrants. Each element of these
matrices represents the fraction (number) of individuals working in occupational category i in 1869 that worked in occupational category j in
1895. The last row in both matrices shows the distribution of individuals
across occupational categories in 1895.
The ¿rst noticeable difference is that immigrants and natives were
concentrated in different occupational groups. Farming was considerably
more prevalent among natives than among immigrants, both in 1869 and
in 1895. This difference is consistent with the different propensities of
natives and immigrants to locate in urban areas. In 1869, 63 percent of
the foreign-born resided in urban locations, whereas this proportion was
only 28 percent among natives.
In Panel (c) of Table 2, I present a number of summary measures
of mobility based on the transition matrices. The simplest measure of
mobility is the fraction of individuals who switched occupational categories across years; that is the fraction of individuals off the main diagonal
of the matrix. This statistic suggests that there was more occupational
mobility among immigrants than among natives, with 59 percent of
immigrants and 51 percent of natives switching occupational categories
from 1869 to 1895.
Immigrants also appear to exhibit more mobility out of the unskilled
category: 72 percent of those initially in unskilled occupations had moved
out of this category by 1895, compared to 64 percent among natives. The
typical path out of the unskilled category was different for the two groups.
Natives usually left the unskilled category by switching into farming,
whereas immigrants moved into more urban occupations such as whitecollar and skilled/semi-skilled jobs. While only 8 percent of natives in
unskilled occupations in 1869 worked in white-collar jobs by 1895, this
fraction is considerably higher (23 percent) among immigrants.
15
Butcher and DiNardo (2002) argue that, because immigrants and natives might exhibit
different skill levels, changes in the returns to skills will result in changes in immigrants’ relative
economic standing, even in the absence of “true” assimilation.
�984
Pérez
TABLE 2
OCCUPATIONAL MOBILITY OF NATIVES AND IMMIGRANTS,
1869 (ROWS) AND 1895 (COLUMNS)
(a) Natives
1869
White collar
Farmer
Skilled/semi-skilled
Unskilled
Column total
White Collar
Farmer
Skilled/
Semi-Skilled
Unskilled
Row Total
0.48
(406)
0.10
(239)
0.13
(140)
0.08
(160)
0.15
(945)
0.35
(298)
0.68
(1584)
0.37
(397)
0.46
(890)
0.51
(3,169)
0.07
(55)
0.06
(151)
0.35
(371)
0.10
(203)
0.13
(780)
0.10
(87)
0.15
(358)
0.15
(163)
0.36
(700)
0.21
(1,308)
100
(846)
100
(2,332)
100
(1,071)
100
(1,953)
100
(6,202)
(b) Immigrants
1869
White collar
Farmer
Skilled/semi-skilled
Unskilled
Column total
White Collar
Farmer
Skilled/
Semi-Skilled
Unskilled
Row Total
0.57
(613)
0.18
(196)
0.13
(138)
0.11
(120)
100
(1,067)
0.18
(78)
0.29
(474)
0.23
(338)
0.32
(1,503)
0.47
(204)
0.15
(247)
0.27
(404)
0.23
(1,051)
0.16
(68)
0.42
(691)
0.23
(342)
0.27
(1,239)
0.19
(81)
0.15
(245)
0.27
(411)
0.18
(857)
100
(431)
100
(1,657)
100
(1,495)
100
(4,650)
d(P,Q)
(4)
d(P,Q)i
(5)
6.64***
2.79*
(c) Summary Measures of Mobility
Natives (P)
Immigrants (Q)
M
(1)
d(P,J)
(2)
0.51
0.59
17.23***
d(Q,J)
(3)
13.01***
Notes: Panel (a) presents an occupational transition matrix for native-born males. Each cell in this
matrix shows the percentage and number (between brackets) of individuals in the linked sample in
each occupational category in 1869 (rows) and 1895 (columns). Panel (b) presents the same matrix for
foreign-born individuals. Occupations were classi¿ed based on the HISCLASS scheme. White-collar
(HISCLASS 1–5), farmer (HISCLASS 8), skilled/semi-skilled (HISCLASS 6–7, 9) and unskilled
(HISCLASS 10–12). Panel (c) reports summary measures of mobility. M (Column 1) corresponds to
the fraction of individuals oа the main diagonal of the matrix. d(P, J ) and d(Q, J ) (Columns 2 and
3) correspond to the distance between matrices P and Q and a matrix representing full independence,
respectively. d(P, Q) (Column 4) represents the distance between matrices P and Q and d(P, Q)i
(Column 5) represents this same distance after excluding the elements of the main diagonal from each
matrix. For each of these distances, I performed a test of the hypothesis that d(i, j) 0. Signi¿cance
levels are indicated by ***p < 0.01, **p < 0.05, *p < 0.1.
Sources: Data are from the sample of linked census records, as described in the text and Online
Appendix.
�Mobility and Economic Outcomes of Immigrants
985
As discussed in Long and Ferrie (2013), a key shortcoming of using
this simple measure to compare mobility across two matrices is that the
measure does not distinguish whether differences in mobility are due to:
(1) differences in the distribution of occupations across the two matrices or
(2) differences in the strength of the association of the rows and columns
in each of the two matrices. This distinction is important in this setting
because, as discussed earlier, the distribution of occupations among
natives differed markedly from the distribution among immigrants.
To establish whether the row-column association was stronger (i.e.,
there was less occupational mobility) among natives or among immigrants, I followed Long and Ferrie (2013) in completing the following
steps. First, I computed the Altham (1970) statistic d(P,Q), which
measures the difference in the strength of the row-column association in
matrices P—the mobility matrix of natives and Q—the mobility matrix
of immigrants.16 Higher values of d(P,Q) imply greater differences in this
association, but are not informative regarding which of the two matrices
exhibit more mobility. Next, I calculated d(P,J) and d(Q,J), which
measure this same difference but relative to a matrix J representing full
independence (a matrix of ones). Higher values of d(P,J) or d(Q,J) imply
greater departures from independence, or less mobility.
Panel (c) of Table 2 shows that d(P,Q) is signi¿cantly different from
zero, suggesting that the strength of the row-column association is
different in the two matrices. In addition, the departure from independence is larger for natives than for immigrants, d(P,J) > d(Q,J). Taken
together, these results suggest that there was higher occupational mobility
among immigrants than among natives.17
One key limitation of the existing studies of immigrant mobility in
Argentina is the inability to track internal migrants. Table B.1 in the
Online Appendix shows that this inability leads to lower rates of estimated occupational mobility among immigrants. In this table, I divide the
sample of immigrants into “movers” and “stayers.” Individuals are classi¿ed as “movers” if by 1895 they lived outside of their 1869 department
16
The Altham (1970) statistic is based on the relative odds of individuals in different occupations
in 1869 ¿nd a given a job in 1895. Under conditions of perfect mobility, the relative odds are one:
an occupation does not provide any relative advantage in obtaining a given occupation. More
generally, given two matrices P and Q, the Altham statistic d(P,Q) measures the difference in the
strength of their row-column association. Importantly, it is possible to perform a likelihood-ratio
test to assess whether this difference is signi¿cantly different from zero.
17
I also computed d(P,Q)i, which measures the row-column association in matrices P and Q
while excluding the elements in the main diagonal of the matrix. Using this alternative measure,
I also ¿nd higher mobility among immigrants than among natives, although the difference is now
less stark.
�986
Pérez
of residence. Panels (a) and (b) show an occupational mobility matrix
computed separately for stayers and movers, respectively. Panel (c) of
this table shows that stayers were less likely to switch occupational categories than movers (48 percent versus 65 percent). Similarly, the Altham
statistic described earlier indicates that the mobility matrix for stayers
exhibits a greater departure from independence that the mobility matrix
for movers.
Occupational Earnings Regressions
Next, I use the occupational earnings data to compare the rates at
which natives and immigrants moved into higher paying occupations. In
particular, I estimate the following model of occupational earnings:
log(Occupational Earningsit) = Go + G1Immigranti
+ G2Year1895t + G3Immigranti × Year1895t + LXit + Jit,
(1)
where Occupational Earningsit is the daily occupational earnings of individual i in year t, Immigranti is an indicator variable of whether the individual was foreign-born, Year1895t is an indicator of whether the observation belongs to the 1895 census Xit and is a vector of individual-level
characteristics. In the baseline speci¿cation, Xit is limited to a quartic in
age. I restrict the sample to working-age individuals, de¿ned as those
being at least 18 years old and at most 35 years old in 1869, and to those
with a reported occupation in both census years. Because matching rates
are not constant across sending countries, in the baseline speci¿cation
each observation is weighted to reÀect the country of birth distribution in
1895 Argentina.
There are two main coef¿cients of interest in equation (1): G1, which
captures baseline differences in the occupational earnings of natives and
immigrants, and G3, which captures differences in their occupational
earnings growth.
This speci¿cation differs from the standard in the immigrant assimilation literature, which uses years since migration as the independent variable of interest (Abramitzky, Boustan, and Eriksson 2014; Borjas 1985;
Chiswick 1978; Lubotsky 2007). It is not possible to estimate the standard speci¿cation in this context because the censuses lack information
on year of arrival to Argentina. This lack of information also prevents
me from following cohorts of immigrants over time, as in George J.
Borjas (1985) and Chris Minns (2000). Note, however, that estimating
this regression on the panel data enables me to keep the composition of
�Mobility and Economic Outcomes of Immigrants
987
the sample constant across census years. In doing so, I am able to disentangle changes in the social standing of immigrants from changes in the
composition of the immigrant pool.18
The ¿rst column of Table 3 presents the results of the baseline speci¿cation. This speci¿cation suggests that natives had relatively higher
occupational earnings in 1869, but that immigrants upgraded their occupations faster. In particular, the growth in occupational earnings among
immigrants was 6 percent faster than among natives. This evidence is
consistent with the ¿nding of immigrants’ higher rates of movements out
of the unskilled category documented in the previous subsection.
Explaining the Differences Between Immigrants and Natives
I explore two main alternative hypotheses; other than labor market
assimilation, that could explain the faster growth in occupational earnings
among immigrants. First, I test whether this ¿nding could be attributed
to the greater propensity of immigrants to locate in areas of Argentina
that were experiencing faster progress, particularly urban areas. Second, I
test whether the ¿nding is driven by an overall increase in returns to skill
that disproportionately bene¿ted immigrants, who had on average higher
human capital levels than natives.
To explore the ¿rst possibility, I perform two different exercises. First,
in Column 2 of Table 3, I restrict the sample to individuals who in 1869
resided in the provinces of Buenos Aires (including the city of Buenos
Aires), Entre Ríos and Santa Fe. These three provinces hosted more than
95 percent of the European immigrants in 1869. When restricted to this
set of provinces, I ¿nd that European immigrants performed worse than
natives in the baseline year, but still exhibited higher relative occupational earnings growth. Second, in Column 3, I include department of
residence ¿xed effects and an interaction between department of residence ¿xed effects and a 1895 census year indicator. That is, I compare
immigrants residing in the same departments and allow the department
of residence effects to differ based on the census year. The results are
similar to the ones that I obtain in the previous speci¿cation.19 Finally,
18
Since it is not possible to follow cohorts of immigrants over time, the composition bias in this
context also differs from the one that would arise when using U.S. data. In particular, a comparison
of my results with those estimated in the repeated cross-section would not be informative about the
selection of return migrants, but rather about the net change in the composition of the immigrant
pool from 1869 to 1895.
19
The results in this speci¿cation should be interpreted with caution, as place of residence is an
endogenous choice. Indeed, geographic mobility might be a strategy for occupational upgrading.
I note, however, that the results (not reported) are also similar if I instead interact the department
of residence ¿xed effects based on place of residence in 1869 with the 1895-year indicator.
�988
Pérez
TABLE 3
OCCUPATIONAL EARNINGS REGRESSIONS
Baseline
Geography
Literacy
Both
(1)
(2)
(3)
(4)
(5)
Immigrant
–0.0320***
(0.0081)
–0.103***
(0.0136)
–0.0786***
(0.0135)
–0.1000***
(0.0082)
–0.114***
(0.0127)
Immigrant X 1895
0.0585***
(0.0118)
0.0691***
(0.0199)
0.0529***
(0.0185)
0.0548***
(0.0121)
0.0420**
(0.0178)
21,462
12,458
21,462
20,350
20,350
Observations
Notes: ***p < 0.01, ** p < 0.05, *p < 0.1. Robust standard errors in parentheses. All the regressions
control for a fourth order polynomial on age and are weighted by the country of birth distribution
in 1895. See the Online Appendix for details on how the income measure was computed. Column
1 reports the baseline speci¿cation. In Column 2, I restrict the sample to individuals residing in
the provinces of Buenos Aires (including the city of Buenos Aires), Entre R´íos and Santa Fe in
1869. In Column 3, I include department of residence ¿xed effects and the interaction between
these ¿xed effects and a 1895 census year indicator. In Column 4, I control for literacy and an
interaction between literacy and a 1895 census year indicator. In Column 5, I control both for
department ¿xed effects and their interaction with the 1895 indicator, and for literacy and its
interaction with the 1895 indicator.
Sources: Data are from the sample of linked census records, as described in the text and Online
Appendix.
the results (not reported) are similar if I restrict the sample to: (1) individuals residing in urban locations in 1869 or (2) individuals residing in
urban locations both in 1869 and in 1895. Hence, the evidence suggests
that immigrants experienced faster growth in occupational earnings also
within urban areas.
As noted in the introduction, European immigrants had higher human
capital levels than natives, as captured by literacy rates. Accordingly, the
higher growth in occupational earnings among immigrants might reÀect
a general increase in the returns to skill from 1869 to 1895 rather than
assimilation. To test this possibility, in Column 4 of Table 3 I estimate
a version of equation (1) in which I include two additional controls: a
literacy indicator and an interaction between a literacy indicator and a
1895 census year indicator. Again, I ¿nd faster occupational earnings
growth among immigrants than among natives.
In the last column of Table 3, I test whether the earlier explanations
combined could account for immigrants’ relatively faster growth in
occupational earnings. To do so, I include both the interaction between
literacy and the 1895 census year indicator and the department of residence ¿xed effects interacted with the 1895 census indicator, as well as
the main effects of both groups of variables. The evidence still suggests
faster occupational upgrading among immigrants than among natives.
�Mobility and Economic Outcomes of Immigrants
989
Heterogeneity by Sending Country
Immigrants from different sending countries differed both in terms of
their human capital levels and in terms of their cultural and linguistic
similarity to natives. Hence, the assimilation experience of the average
immigrant might mask differences across sending countries. To explore
this possibility, I estimate a version of equation (1) in which I include
an indicator variable for each of the sending countries included in my
sample, as well as an interaction of each of these country indicators with
an 1895 census indicator. This speci¿cation captures differences both in
country-speci¿c baseline occupational earnings and in country-speci¿c
occupational earnings growth.
In Figure 2, I plot the coef¿cients corresponding to each of the countries
around a 95 percent con¿dence interval. Upon arrival, immigrants from
every major sending country (with the exception of Italy) appear to do
better than natives, although the difference with respect to natives is not
statistically signi¿cant for French immigrants. The evidence is broadly
consistent with immigrants from countries with higher levels of average
human capital doing better upon arrival. In particular, the ranking of countries based on average occupational earnings mostly matches the ranking
of countries based on the average literacy of immigrants in Argentina.
In addition, the evidence suggests that immigrants from every major
sending country (with the exception of Switzerland) experienced faster
occupational upgrading than natives. Note, however, that the interaction
between the country of origin indicator and the 1895 census indicator is
not statistically signi¿cant for the English or the German immigrants.
Alternative Speci¿cations and Robustness
In this subsection, I show that the ¿nding of immigrants’ higher occupational earnings growth relative to natives is robust to: (1) how earnings
are assigned to farmers, (2) using an alternative measure of occupational
status based on access to property as the dependent variable, and (3) the
procedure used to create the linked sample.
Assigning an earnings measure to farmers is challenging for a variety
of reasons. First, it is hard to distinguish in the census between owners
and operators of farms and farm employees. Although the 1895 census
contains a question on whether the person holds real estate property,
which could be useful for distinguishing the two, this question is not available in the 1869 census. In addition, the farming sector encompasses a
wide range of economic realities, ranging from small farms to large-scale
�990
-.1
0
.1
.2
Pérez
Germany
England
Switzerland
Country indicator
Spain
France
Italy
Country indicator X 1895 indicator
FIGURE 2
OCCUPATIONAL EARNINGS REGRESSION, BY COUNTRY OF ORIGIN
Notes: I estimate a version of equation (1) in which I replace the Immigrant indicator with separate
indicators for each of the countries included in my sample, as well as an interaction of each of
these country indicators with an 1895 census indicator. This ¿gure shows the estimated coef¿cient
around a 95 percent con¿dence interval corresponding to each country of origin indicator and the
coef¿cient corresponding to the interaction between the country of origin indicator and the 1895
census indicator. Omitted category are natives.
Sources: Data are from the sample of linked census records, as described in the text and Online
Appendix.
production. Hence, relying on typical earnings is more challenging than
in other occupations where within-occupation earnings dispersion is
likely to be less prominent. While my baseline measure of occupational
earnings introduces a distinction based on the reported occupational title
between small (who I estimate to be close to the median in terms of occupational earnings) and large farmers (who are at the top of the income
distribution) and also incorporates farm laborers as a separate category,
this distinction is most likely not suf¿ciently rich to capture the different
realities within the farming sector.
In Column 1 of Table 4, I exclude individuals who were employed as
farmers in either 1869 or 1895 from the sample. The table shows that
the ¿nding of higher occupational upgrading for immigrants remains
unchanged in this case. However, I now ¿nd that immigrants outperform
natives even upon arrival. Despite the challenges in measuring occupational earnings for farmers, excluding them could introduce biases if
immigrants and natives exhibit differential rates of movement into and
out of farming. In the context of Argentina, immigrants’ occupational
upgrading relative to natives is exaggerated once farmers are excluded,
�Mobility and Economic Outcomes of Immigrants
991
TABLE 4
OCCUPATIONAL EARNINGS REGRESSIONS, ROBUSTNESS
Excluding
Farmers
Occupational
Status
(Property)
(1)
(2)
(3)
(4)
(5)
(6)
0.0488***
(0.0108)
–0.151***
(0.0123)
–0.0378*
(0.0217)
–0.00827
(0.0075)
0.0187
(0.0134)
0.0466***
(0.0161)
Immigrant X 1895 0.102***
(0.0155)
0.132***
(0.0167)
0.0809*** 0.0618*** 0.0623*** 0.0809***
(0.0233)
(0.0112)
(0.0191)
(0.0231)
Immigrant
Observations
11,170
20,642
Linking
20,074
21,462
14,492
13,996
Notes: ***p < 0.01, ** p < 0.05, *p < 0.1. Robust standard errors in parentheses. All the regressions
control for a fourth order polynomial on age and are weighted by the country of birth distribution
in 1895 (with exception of Columns 3 and 4). In Column 1, I exclude individuals employed as
farmers in either 1869 or 1895 from the sample. In Column 2, I report the results of estimating the
baseline equation using an alternative dependent variable based on access to property. In Column
3, I reweight the sample to account for differences in observable characteristics between the linked
sample and the population. In Column 4, I report the results without reweighting the sample by the
country of birth distribution in 1895. In column 5, I exclude immigrants with common ¿rst names
(frequency higher than median within country of birth) from the sample. In Column 6, I drop all the
immigrants from the sample who are not perfect matches.
Sources: Data are from the sample of linked census records, as described in the text and Online
Appendix.
as moving into farming was a more frequent avenue for upward mobility
for natives than for immigrants, as shown earlier.
Another concern with the ¿nding of faster occupational earnings
growth among immigrants is that it might be sensitive to how the earnings measure was constructed. If my measure systematically overestimated earnings in occupations to which immigrants were more likely
to transition, I would ¿nd that immigrants exhibited faster occupational
upgrading than natives. As an alternative approach, I computed a measure
of occupational status based on access to property. The 1895 census
includes the question “¿Posee propiedad raíz?” (“Do you own real estate
property?).”20 I used this information to compute an alternative measure
of occupational status: the fraction of individuals within a given occupation that owned real estate property in 1895. For instance, this measure
takes a value of 0.2 for jornaleros (day laborers) and a value of 0.7 for
comerciantes (storekeepers), which means that 20 percent of jornaleros
and 70 percent of comerciantes in my sample held real estate property in
1895.21 Column 2 in Table 4 shows that the ¿nding of faster occupational
20
As the 1869 census lacks a question on access to property, I cannot directly use the property
variable as the outcome.
21
The correlation between this measure and my measure of occupational earnings is of about
0.7 in the data.
�992
Pérez
upgrading among immigrants is robust to using the log of this measure as
the dependent variable.
Finally, I assess the robustness of the results to the linking procedure
used to create the sample. There are two main concerns related to the
linking procedure. First, the linked samples are not fully representative
of the population. Second, the fraction of false positives might be higher
among immigrants than among natives.
To alleviate the ¿rst concern, in Column 3 of Table 4 I show that my
results are similar when I reweight the sample to account for differences
in observable characteristics (in addition to country of birth) with respect
to the census cross-section.22 This evidence suggests that selection into
the linked sample, at least based on observable characteristics, is unlikely
to drive the results. In addition, Column 4 shows that the results are also
similar when I do not reweight the sample to account for differences in
matching rates across sending countries.
The second concern is that the fraction of false positives in the linked
sample might be higher among immigrants than among natives. If that
were the case, relying on a linked sample would mechanically overestimate the extent of mobility among immigrants; although not necessarily
the extent of upward mobility. While this possibility cannot be fully
ruled out, I can replicate my analysis in a sample where this issue is likely
to be less prevalent: immigrants with infrequent names. In particular, I
re-estimate equation 1using immigrants with whose names fall later the
median in the ¿rst name frequency distribution within their country of
birth, while keeping the full sample of natives. Column 5 shows that the
¿nding of faster occupational upgrading is robust to excluding this group
of immigrants from the sample.
Finally, in Column 6 I replicate the analysis but focusing on the sample
of immigrants whose identifying information matches perfectly, while
again keeping the full sample of natives.23 Overall, this evidence suggests
that the result of faster occupational upgrading is unlikely to be driven
by features of the linking procedure.24 Note, however, that restricting the
22
To compute the sample weights, I pool the 1895 census cross-section and the linked sample
and estimate a probit model of the probability of being an observation in the linked sample. I then
reweight my sample by the inverse of this linkage probability.
23
I de¿ne a perfect match as one in which both the ¿rst name and the last name agree perfectly,
but I allow the year of birth to differ by at most one year. Because the two censuses took place
in different times of the year, the difference in estimated year of birth could be one even if an
individual accurately reported his age in both censuses.
24
The results are also similar if I (1) keep only natives with infrequent names and keep all the
immigrants, (2) keep only natives who are perfect matches and keep all the immigrants, (3) drop
both immigrants and natives with common names, and (4) drop both immigrants and natives who
are not exact matches (results not reported).
�Mobility and Economic Outcomes of Immigrants
993
sample to immigrants with uncommon names (which likely exacerbates
positive selection of immigrants into the linked sample) causes immigrants to perform better than natives in the baseline year.
Occupational Mobility from Arrival to 1895
In the previous subsection, I documented the extent to which immigrants moved up in the occupational ladder as they spent time in
Argentina. Yet, another question is whether immigrants were able to
progress relative to their pre-migration occupations. To answer this question, I use the sample following immigrants from their arrival to the city
of Buenos Aires to the 1895 census. In this sample, I observe an individual’s occupation in Europe as declared upon arrival and his occupation in
1895.25
Table 5 shows a transition matrix in which rows represent occupations in Europe and columns represent occupations in the 1895 census.
Overall, about 80 percent of immigrants who entered Argentina from
1882 to 1894 switched their occupational category by 1895. Yet, the data
strongly reject independence between an occupation upon arrival and an
occupation in 1895 (p-value< 0.01).
Given the absence of a comparable full ranking of occupations in
Argentina and each of the sending countries, it is not possible to assess
the fraction of immigrants that downgraded or upgraded their occupations relative to Europe. However, under the assumption that the
unskilled category is the least desirable, the data show that occupational
upgrading occurred for a large fraction of those who had held unskilled
occupations in Europe; less than 25 percent of those who entered the
country as unskilled workers were still in those occupations by 1895. The
fraction of immigrants moving out of unskilled occupations is substantially higher than documented by Ferrie (1997) in the Antebellum United
States. Ferrie (1997) ¿nds that about half of the immigrants arriving to
the United States in the 1840–1850 period were still working as unskilled
workers by 1860. Indeed, even when excluding Irish immigrants, who
had the worst outcomes among all immigrant groups, from the U.S. data,
25
A limitation of these data is that the accuracy of the occupation declared upon arrival has been
questioned. The main issue is that immigrants might have answered their intended occupation
in Argentina rather than their last occupation in Europe. According to Devoto and Benencia
(2003), the most likely bias is that immigrants declared occupations that they deemed would be
perceived as desirable by the Argentine authorities. If immigrants indeed exaggerated the quality
of their occupations in Europe upon arrival, then the rates of upward occupational mobility that I
document would likely be a lower bound.
�994
Pérez
TABLE 5
OCCUPATIONAL MOBILITY OF IMMIGRANTS,
DECLARED UPON ARRIVAL (ROWS) AND
IN 1895 CENSUS (COLUMNS)
Argentina, 1895
White Collar
Farmer
Skilled/
Semi-Skilled
Unskilled
Row Total
White collar
0.59
(166)
0.06
(17)
0.24
(68)
0.11
(31)
100
(282)
Farmer
0.28
(230)
0.21
(172)
0.28
(225)
0.23
(185)
100
(812)
Skilled/semi-skilled
0.23
(115)
0.12
(60)
0.52
(260)
0.14
(69)
100
(504)
Unskilled
0.27
(175)
0.18
(117)
0.33
(217)
0.23
(151)
100
(420)
Column total
0.30
(686)
0.16
(366)
0.34
(770)
0.19
(436)
100
(2,258)
Declared upon Arrival
Notes: Each cell in the table shows the percentage and the number (between brackets) of
individuals in the linked sample in each occupational category upon arrival to Argentina (rows)
and in 1895 (columns). Occupations were classi¿ed based on the HISCLASS scheme. Whitecollar (HISCLASS 1–5), farmer (HISCLASS 8), skilled/semi-skilled (HISCLASS 6–7, 9) and
unskilled (HISCLASS10–12).
Sources: Data are from the sample of linked census records, as described in the text and Online
Appendix.
the evidence suggests higher rates of upward occupational mobility in
Argentina.26
Another contrast relative to the ¿ndings of Ferrie (1997) is that immigrants who declared skilled/semi-skilled occupations were quite unlikely
to experience occupational downgrading; only 14 percent of those initially
in the skilled/semi-skilled category were working in unskilled occupations in 1895. In the U.S. case, the fraction experiencing downgrading
was considerably higher; as high as 30 percent among skilled workers.
Overall, this evidence suggests that immigrants entering Argentina bene¿ted from relatively better opportunities for occupational upgrading than
those entering the United States.27
Similar to Ferrie (1997) and consistent with historical accounts of the
period (Germani 1966), I ¿nd that those who declared farming occupations upon arrival were fairly unlikely to work as farmers in Argentina,
26
For instance, the fraction of British and German immigrants moving out of unskilled
occupations was about 60 percent in the United States (Ferrie 1997).
27
In Table B.2 in the Online Appendix, I show that this pattern was similar for Italian and
Spanish immigrants, the two largest sending countries. The sample size does not allow me to
perform a similar comparison for the other sending countries.
�Mobility and Economic Outcomes of Immigrants
995
at least in the short run. Indeed, about 66 percent of these immigrants
resided in urban locations by 1895 (35 percent in the city of Buenos
Aires) compared to 72 percent and 40 percent among all immigrants in
the sample. This ¿nding con¿rms that, for many European immigrants,
the Transatlantic move was accompanied by a shift from rural to urban
occupations (Sánchez-Alonso 2007).
THE SECOND GENERATION
Intergenerational Occupational Mobility
In this section, I compare the intergenerational occupational mobility
of the native-born sons of immigrants—the “second generation”—and
the sons of natives. Panels (a) and (b) of Table 6 show an intergenerational mobility matrix for sons of natives and for sons of immigrants,
respectively. Rows in each of these matrices represent a father’s occupation in 1869 and columns show the occupation of his son in 1895. Each
element of these matrices represents the fraction (number) of fathers in
occupational category i in 1869 whose sons worked in occupational category j in 1895.
The ¿rst noticeable difference between the two groups is that movements out of unskilled occupations were considerably more frequent
among the children of immigrants. About half of the sons of natives
whose father worked in unskilled occupations themselves worked in
these occupations, compared to only 25 percent among the children of
immigrants. The opposite pattern occurs in the white-collar category,
where persistence was much prominent among sons of immigrants than
among sons of natives.
In Panel (c) of Table 6, I follow Collins and Wanamaker (2017) in
reporting a counterfactual exercise simulating the distribution of sons of
natives across occupational categories had they been exposed to the transition matrix of the sons of immigrants. This exercise reveals two main
¿ndings. First, the fraction of sons of natives in unskilled occupations
would have been substantially lower under this counterfactual: 17 percent
versus 28 percent. Second, the fraction in white-collar occupations would
have been almost twice as high: 33 percent versus 17 percent.28 Taken
together, these results suggest that the children of European immigrants
28
I observe a similar pattern when I restrict the sample to individuals initially residing in the
Provinces of Buenos Aires, Entre Ríos, and Santa Fe, where most European immigrants and their
children resided. See Table B.3 in the Online Appendix.
�996
Pérez
TABLE 6
INTERGENERATIONAL MOBILITY OF CHILDREN OF NATIVES AND IMMIGRANTS,
FATHERS IN 1869 (ROWS) AND SONS IN 1895 (COLUMNS)
(a) Sons of Natives
Fathers, 1869
White Collar
Farmer
Skilled/
Semi-Skilled
Unskilled
Row Total
White collar
0.44
(888)
0.27
(548)
0.12
(251)
0.17
(337)
100
(2,024)
Farmer
0.12
(1159)
0.49
(4709)
0.11
(1019)
0.28
(2631)
100
(9,518)
Skilled/semi-skilled
0.16
(419)
0.33
(879)
0.26
(701)
0.25
(655)
100
(2,654)
Unskilled
0.10
(366)
0.31
(1116)
0.13
(481)
0.45
(1629)
100
(3,592)
0.16
(2,832)
0.41
(7,252)
0.14
(2,452)
0.3
(5,252)
100
(17,788)
Column total
(b) Sons of Immigrants
Fathers, 1869
White Collar
Farmer
Skilled/
Semi-Skilled
Unskilled
Row Total
White collar
0.69
(562)
0.11
(92)
0.11
(89)
0.09
(70)
100
(813)
Farmer
0.19
(87)
0.51
(232)
0.12
(52)
0.18
(81)
100
(452)
Skilled/semi-skilled
0.48
(398)
0.10
(86)
0.29
(243)
0.12
(98)
100
(825)
Unskilled
0.36
(151)
0.18
(77)
0.20
(83)
0.26
(109)
100
(420)
0.48
(1,198)
0.19
(487)
0.19
(467)
0.14
(358)
100
(2,510)
Column total
(c) Counterfactual Distribution: Sons of Natives
White Collar
Farmer
Skilled/
Semi-Skilled
Unskilled
Row Total
0.33
0.34
0.16
0.18
100
(d) Summary Measures of Mobility
Sons of natives (P)
Sons of immigrants (Q)
M
(1)
d(P,J)
(2)
0.55
0.54
12.41***
d(Q,J)
(3)
d(P,Q)
(4)
d(P,Q)i
(5)
8.21***
4.56*
15.07***
Notes: Panel (a) presents a transition matrix for sons of natives. Each cell in this matrix shows the percentage
and the number (between brackets) of fathers in occupation i in 1869 with sons in occupation j in 1895.
Panel (b) presents the same matrix for native-born sons of immigrants. Panel (c) presents the counterfactual
occupational distribution for sons of natives had they been exposed to the transition matrix of sons of
immigrants. Occupations were classi¿ed based on the HISCLASS scheme. White-collar (HISCLASS 1–5),
farmer (HISCLASS 8), skilled/semi-skilled (HISCLASS 6–7, 9) and unskilled (HISCLASS 10–12). Panel (d)
reports summary measures of mobility. M (Column 1) corresponds to the fraction of individuals oа the main
diagonal of the matrix. d(P, J ) and d(Q, J) (Columns 2 and 3) correspond to the distance between matrices P
and Q and a matrix representing full independence, respectively. d(P,Q) (Column 4) represents the distance
between matrices P and Q and d(P, Q)i (Column 5) represents this same distance after excluding the elements
of the main diagonal from each matrix. For each of these distances, I performed a test of the hypothesis that
d(i, j) = 0. Signi¿cance levels are indicated by ***p < 0.01, ** p < 0.05, *p < 0.1.
Sources: Data are from the sample of linked census records, as described in the text and Online Appendix.
�Mobility and Economic Outcomes of Immigrants
997
faced better prospects for mobility out of unskilled jobs than the children
of natives.29
Panel (d) of Table 6 provides summary measures of mobility analogous to the ones presented earlier. The table shows that the fraction of
sons switching occupational categories is almost identical in both groups:
About 55 percent of sons are in a different occupational category relative
to their father. Yet, using the Altham measure of mobility reveals slightly
higher mobility among sons of natives than among sons of immigrants.
The Economic Performance of the Second Generation
Next, I compare the economic outcomes of the native-born sons of
immigrants and the sons of natives. I begin by estimating the following
model:
Son Outcomei = Go + G1Second Generationi + LXi + Ji,
(2)
where Son Outcomei is an economic outcome of the son in father-son pair
i, Second Generationi is an indicator variable that takes a value of one for
native-born individuals whose father was an immigrant, Xi is a vector of
household characteristics (limited to a quartic in son’s and father’s age in
the baseline speci¿cation), and Ji is an error term, clustered at the level of
the father to account for the presence of siblings in the data.
The key dif¿culty in estimating the earlier equation is that the censuses
do not include a question on parental place of birth. I therefore infer this
information by linking males from the 1895 census to their childhood
household in 1869, where they were observed living with their parents.
The sample is restricted to native-born males 26 to 44 years old in the
1895 census, that is, those who had already been born and that were
young enough to still be living in their childhood household in 1869.
I ¿rst compare the literacy rate of second-generation immigrants to that
of the children of natives. A son is de¿ned as being literate if in 1895 he
answered af¿rmatively to the question: “Do you know how to read and
write?” The question does not specify whether the individual was literate
in Spanish or in another language. In Column 1 of Table 7, Xi includes
only a quartic in father’s and son’s age. This speci¿cation shows that the
sons of immigrants were substantially more likely to be literate as adults
than the sons of natives, an advantage above 35 percentage points relative
to a mean literacy rate of about 50 percent among natives.
29
Feigenbaum (forthcoming) documents a similar pattern of higher mobility of the grandchildren
of immigrants relative to the grandchildren of natives in early twentieth-century Iowa.
�998
TABLE 7
ECONOMIC OUTCOMES OF THE SECOND GENERATION
Literacy
Occupational Earnings
Access to Property
(2)
(3)
(4)
(5)
(6)
(7)
(8)
(9)
0.363***
(0.0064)
0.234***
(0.0072)
0.151***
(0.0098)
0.201***
(0.0075)
0.127***
(0.0081)
0.124***
(0.0117)
0.00737
(0.0082)
–0.0169*
(0.0088)
0.0329***
(0.0117)
Household characteristics
No
Yes
Yes
No
Yes
Yes
No
Yes
Yes
Enumeration district FE
No
No
Yes
No
No
Yes
No
No
Yes
23,802
23,509
23,509
22,528
22,248
22,248
24,584
24,277
24,277
Second generation
Observations
Notes: ***p < 0.01, ** p < 0.05, *p < 0.1. Robust standard errors clustered at the level of the father in parentheses. This table shows the estimated coef¿cients in
a regression comparing the children of immigrants and the children of natives in the 1895 census. The dependent variable is an indicator for literacy in Columns
1 to 3, log occupational earnings in Columns 4 to 6 and an indicator of access to property in Columns 7 to 9. Parental place of birth is inferred by linking
individuals from the 1895 census to their childhood households in 1869. All regressions control for a quartic in son’s and father’s age. Household characteristics
include the literacy of the father and a full set of dummies corresponding to occupational classes of the father. Enumeration district ¿xed effects are based on a
family place of residence in 1869.
Sources: Data are from the sample of linked census records, as described in the text and Online Appendix.
Pérez
(1)
�Mobility and Economic Outcomes of Immigrants
999
As ¿rst-generation immigrants themselves were more likely to be
literate than natives, one simple explanation for the earlier ¿nding is
the transmission of human capital from parents to their children. I test
this hypothesis in Column 2, where I control for parental literacy and
also include indicators corresponding to the occupational category of
the father in 1869.30 The point estimate goes down by about a third,
suggesting that differences in parental background—beyond place of
birth—play a role in explaining the advantage of the second generation.
However, the difference remains large (about 23 percentage points) and
statistically signi¿cant.
An alternative explanation for the observed difference in literacy rates
is that, as discussed earlier, immigrants were more likely to reside in
urban locations than natives. If, for instance, urban locations were better
served by schools, then the children of immigrants would have been
more likely to acquire formal education and thus be literate as adults.
Moreover, the children of immigrants were disproportionately located
in the relatively more prosperous areas of Argentina, the Littoral region.
To explore this possibility, I estimate equation (2) adding a full set of
enumeration district ¿xed effects, based on the family place of residence
in 1869. In addition to controlling for the urban/rural status of the family’s place of residence, these ¿xed effects control for other observable
and unobservable factors that vary at the enumeration district level and
that might have inÀuenced literacy rates in adulthood.31 The results in
Column 3 again show that second-generation immigrants did better in
terms of literacy, an advantage of about 15 percentage points, even when
compared to sons of natives who grew up in similar locations.
Columns 4 to 6 in Table 7 repeat the earlier analysis using the log of
occupational earnings as the outcome variable. The evidence also suggests
a substantial advantage of the children of immigrants relative to the sons
of natives. This difference is robust to controlling for father’s literacy and
occupational status in 1869 (in Column 5), as well as for observable and
unobservable enumeration district characteristics (in Column 6).
In Columns 7 to 9, the dependent variable is an indicator that takes a
value of one if the individual held real estate property in 1895. Interestingly,
I do not observe an advantage of the sons of immigrants in terms of
access to property as adults in the baseline speci¿cation (Column 7) or
when controlling for father’s literacy and occupational category (Column
30
The results are similar if instead of occupational category indicators I include occupational
earnings as a control variable.
31
There were 3,045 different enumerators in the 1869 census, each covering about 600
individuals.
�1000
Pérez
8). However, second-generation immigrants also do better in terms of
access to property, an advantage of 3.2 percentage points relative to a
mean of 33 percent among sons of natives, when I include enumeration
district ¿xed effects (Column 9). This pattern is consistent with the fact
that property was more dif¿cult to access in the relatively more urban
and prosperous locations where European immigrant families resided in
Argentina.
I next explore how the children of immigrants from different sending
countries fared as adults. Figure 3 shows the results of estimating equation (2), now using separate country of origin indicators instead of
a single second-generation indicator. In each of the ¿gures, I plot the
coef¿cient corresponding to each of the countries around a 95 percent
con¿dence interval. Panel (a) shows the results for literacy, Panel (b) for
log occupational earnings, and Panel (c) for access to property. In the
three cases, I control for father’s literacy and occupational category in
1869, as well as for enumeration district ¿xed effects as determined by
the family place of residence in 1869. The ¿gures show that the children
of immigrants from every major sending country fared on average better
as adults than the children of natives. The differences relative to the sons
of natives are especially prominent with respect to literacy and occupational earnings. Overall, these results suggest that the advantage of
second-generation immigrants was not con¿ned to any particular sending
country.
How can we account for the advantages of second-generation immigrants? One possible interpretation is that the children of immigrants
bene¿ted from higher “ethnic capital” than the children of natives (Borjas
1992). According to the “ethnic capital” hypothesis, the human capital of
a child is inÀuenced not only by the human capital of her own parents,
but also by the average human capital of the ethnic group to which the
child belongs. As immigrants had on average higher human capital than
natives, their children might have been able to take advantage of the
higher human capital within their ethnic network. In Table B.4 in the
Online Appendix, I formally test this possibility by re-estimating equation (2) including the average literacy rate of a child’s father’s country
of birth, as measured among immigrants from that country in Argentina
in 1869—as an additional variable. The table shows that, conditional
on father’s background characteristics, there is a positive association
between the average literacy of the ethnic group in the father’s generation
and literacy rates and occupational earnings of the second-generation.
Note that this evidence should be interpreted as only suggestive because
of the well-known “reÀection problem” (Manski 1993) in measuring
social interactions.
�Mobility and Economic Outcomes of Immigrants 1001
.05
.1
.15
.2
.25
(a) Literacy
France
England
Italy
Spain
Switzerland Germany
0
.1
.2
.3
.4
(b) Occupational Earnings
England
Germany
France
Spain
Italy
Switzerland
-.1
0
.1
.2
c) Access to Property
Switzerland
Italy
England
Germany
Spain
France
FIGURE 3
ECONOMIC OUTCOMES OF THE SECOND GENERATION, BY FATHER’S COUNTRY
OF ORIGIN
Notes: I estimate a version of equation (2) in the main text in which I replace the Second Generation
indicator with separate indicator variables for each of the countries included my sample. The
¿gure shows the estimated coef¿cient around a 95 percent con¿dence interval corresponding
to each country of origin indicator. The dependent variable in Panel (a) is a literacy indicator,
Panel (b) is the log of occupational earnings, and Panel (c) is an indicator of access to real estate
property. Omitted category are sons of natives.
Sources: Data are from the sample of linked census records, as described in the text and Online
Appendix.
�1002
Pérez
CONCLUSIONS
I provided evidence on the mobility and economic outcomes of
European immigrants and their children in nineteenth-century Argentina.
To do so, I constructed longitudinal data linking males across the two
national censuses of population of the period and passenger ship lists of
immigrant arrivals to the city of Buenos Aires.
I ¿rst looked at the labor market assimilation of ¿rst-generation immigrants. I found that immigrants exhibited faster occupational upgrading
than natives. This ¿nding does not seem to be driven by immigrants from
any particular origin. Rather, I documented that immigrants from most
of the main European sending countries outpaced natives in terms of
occupational upgrading. Immigrants also appear to have in many cases
upgraded their pre-migration occupations: Most of those entering the
country as unskilled workers upgraded their occupation after a relatively
short period of time. A comparison with similarly constructed U.S. data
suggests that European immigrants in Argentina experienced relatively
higher rates of upward occupational mobility.
Focusing on second-generation immigrants, I documented that the sons
of European immigrants from every major sending country outperformed
the sons of natives along a number of important economic outcomes. In
addition, the majority of the sons of unskilled immigrant workers were
able to upgrade their occupations, in many cases to white-collar jobs.
Overall, my ¿ndings give further support to an optimistic view of the
economic performance of European immigrants in nineteenth-century
Argentina. Furthermore, I showed that this optimism also largely extends
to the second generation. These ¿ndings provide an economic rationale of why some Europeans chose to migrate to Argentina instead of
to the United States. While real wages were likely lower in Argentina
(Williamson 1995), the prospects for upward economic mobility might
have been better.
In comparing the experiences of Italians in Argentina and in the United
States, Herbert S. Klein (1983) argues that “The sharp differences in the
Italian immigrant experience within Argentina and the United States
were fully perceived by both the immigrants themselves and virtually
all contemporary observers.” But why did these differences exist? My
article cannot offer a de¿nite answer to this question. One plausible interpretation points to differences in the social structure of the two countries
at the onset of Mass Migration. When the Age of Mass Migration started,
Argentina had a relatively small population and no signi¿cant skilled
�Mobility and Economic Outcomes of Immigrants 1003
working class. In contrast, the United States featured a larger and more
skilled workforce (Baily 1983). Hence, immigrants moving to Argentina
were in a better position to become a dominant force of the economy than
those going to the United States.
REFERENCES
Abramitzky, Ran, Leah Platt Boustan, and Katherine Eriksson. “Europe’s Tired, Poor,
Huddled Masses: Self-Selection and Economic Outcomes in the Age of Mass
Migration.” American Economic Review 102, no. 5 (2012): 1832–56.
———. “Have the Poor Always Been Less Likely to Migrate? Evidence from
Inheritance Practices During the Age of Mass Migration.” Journal of Development
Economics 102 (2013): 2–14.
———. “A Nation of Immigrants: Assimilation and Economic Outcomes in the Age of
Mass Migration.” Journal of Political Economy 122, no. 3 (2014): 467–506.
Alberdi, Juan Bautista. Bases Y Puntos de Partida Para La Organización Política de La
República Argentina, 1852.
Alsina, Juan A. “La Inmigración Europea En La República Argentina” Imprenta Calle
México, 1898.
Altham, Patricia M.E. “The Measurement of Association of Rows and Columns for
an r x s Contingency Table.” Journal of the Royal Statistical Society. Series B
(Methodological) 32, no. 1 (1970): 63–73.
Argentina. Dirección General de Estadística. Anuario de la Dirección General de
Estadística. Compañía sud-americana de billetes de banco, 1908.
Álvarez, Beatriz, and Esteban Alberto Nicolini. “Income Inequality in the NorthWest of Argentina During the First Globalization. Methodology and Preliminary
Results.” Ponencia Presentada En II Encuentro Anual de La Asociación Española
de Historia Económica. Madrid 8, (2010).
Baily, Samuel L. “The Adjustment of Italian Immigrants in Buenos Aires and New
York, 1870–1914.” American Historical Review 88, no. 2 (1983): 281–305.
Borjas, George J. “Assimilation, Changes in Cohort Quality, and the Earnings of
Immigrants.” Journal of Labor Economics 3, no. 4 (1985): 463–89.
———. “Ethnic Capital and Intergenerational Mobility.” Quarterly Journal of
Economics 107, no. 1 (1992): 123–50.
Boustan, Leah Platt, Matthew E. Kahn, and Paul W. Rhode. “Moving to Higher
Ground: Migration Response to Natural Disasters in the Early Twentieth Century.”
American Economic Review 102, no. 3 (2012): 238–44.
Buchanan, William I. “La Moneda Y La Vida En La República Argentina.” Cuadernos
Del CISH 3, no. 4 (1998): 239–256.
Butcher, Kristin F., and John DiNardo. “The Immigrant and Native-Born Wage
Distributions: Evidence from United States Censuses.” Industrial and Labor
Relations Review 56, no. 1 (2002): 97–121.
Chiswick, Barry R. “The Effect of Americanization on the Earnings of Foreign-Born
Men.” Journal of Political Economy 86, no. 5 (1978): 897–921.
�1004
Pérez
Collins, William J., and Marianne H. Wanamaker. “Selection and Economic Gains
in the Great Migration of African Americans: New Evidence from Linked
Census Data.” American Economic Journal: Applied Economics 6, no. 1 (2014):
220–52.
———. “The Great Migration in Black and White: New Evidence on the Selection
and Sorting of Southern Migrants.” Journal of Economic History 75, no. 4 (2015):
947–92.
———. “Up from Slavery? Intergenerational Mobility in the Shadow of Jim Crow.”
NBER Working Paper No. w23395, Cambridge, MA, 2017.
Conde, Roberto Cortés. El Progreso Argentino: 1880–1914. Buenos Aires: Editorial
Sudamericana, 1979.
Correa, Antonio M., and Emilio Lahitte. “Investigación Parlamentaria Sobre Agricultura,
Ganadería, Industrias Derivadas Y Colonización.” Anexo B, Buenos Aires. (1898).
Da Orden, María Liliana. Inmigración Española, Familia Y Movilidad Social En La
Argentina Moderna: Una Mirada Desde Mar Del Plata (1890–1930). Colección
La Argentina Plural. Buenos Aires: Biblos, 2005.
Devoto, Fernando, and Roberto Benencia. Historia de La Inmigración En La Argentina.
Buenos Aires: Sudamericana, 2003.
Diaz-Alejandro, Carlos F. Essays on the Economic History of the Argentine Republic.
New Haven: Yale University Press, 1970.
Dirección General de Inmigración. Resumen Estadístico Del Movimiento Migratorio
En La República Argentina: Años 1857–1924. Talleres Grá¿cos del Ministerio de
Agricultura de la Nación, 1925.
Feigenbaum, James J. “Multiple Measures of Historical Intergenerational Mobility:
Iowa 1915 to 1940.” Economic Journal, forthcoming.
———. “Intergenerational Mobility during the Great Depression.” Mimeo, 2016.
———. “Automated Census Record Linking: A Machine Learning Approach.” Mimeo,
2017.
Ferenczi, Imre. “International Migration Statistics.” In International Migrations,
Volume I: Statistics, 47–76. Cambridge, MA: NBER, 1929.
Ferrie, Joseph P. “The Entry into the U.S Labor Market of Antebellum European
Immigrants, 1840–1860.” Explorations in Economic History 34, no. 3 (1997):
295–330.
———. Yankeys Now: Immigrants in the Antebellum United States 1840–1860. New
York: Oxford University Press, 1999.
Fuente, Diego Gregorio de la. Segundo Censo de La República Argentina, Mayo 10 de
1895. Vol. 3. Taller tip. de la Penitenciaria nacional, 1898.
Germani, Gino. “Mass Immigration and Modernization in Argentina.” Studies in
Comparative International Development (SCID) 2, no. 11 (1966): 165–82.
Klein, Herbert S. 1983. “The Integration of Italian Immigrants into the United States
and Argentina: A Comparative Analysis.” The American Historical Review 88, no.
2 (1983): 306–29.
Kosack, Edward, and Zachary Ward. “Who Crossed the Border? Self-Selection of
Mexican Migrants in the Early Twentieth Century.” Journal of Economic History
74, no. 4 (2014): 1015–44.
Long, Jason. “Rural-Urban Migration and Socioeconomic Mobility in Victorian
Britain.” Journal of Economic History 65, no. 1 (2005): 1–35.
�Mobility and Economic Outcomes of Immigrants 1005
Long, Jason, and Joseph Ferrie. “Intergenerational Occupational Mobility in Great
Britain and the United States Since 1850.” American Economic Review 103, no. 4
(2013): 1109–37.
Lubotsky, Darren. “Chutes or Ladders? A Longitudinal Analysis of Immigrant
Earnings.” Journal of Political Economy 115, no. 5 (2007): 820–67.
Maas, Ineke, Andrew Miles, and Marco H.D. Van Leeuwen. HISCO: Historical
International Standard Classi¿cation of Occupations. Leuven, Belgium: Leuven
University Press, 2002.
Maddison, Angus. The World Economy Volume 1: A Millennial Perspective, Volume 2:
Historical Statistics. New Delhi: Academic Foundation, 2007.
Manski, Charles F. “Identi¿cation of Endogenous Social Effects: The ReÀection
Problem.” Review of Economic Studies 60, no. 3 (1993): 531–42.
Mill, Roy, and Luke CD Stein. “Race, Skin Color, and Economic Outcomes in Early
Twentieth-Century America.” Working Paper, Stanford University, Stanford, CA,
30 December 2012.
Minns, Chris. “Income, Cohort Effects, and Occupational Mobility: A New Look at
Immigration to the United States at the Turn of the 20th Century.” Explorations in
Economic History 37, no. 4 (2000): 326–50.
Míguez, Eduardo José. 1993. “La Movilidad Social de Nativos E Inmigrantes En La
Frontera Bonaerense En El Siglo Xix: Datos, Problemas, Perspectivas.” Estudios
Migratorios Latinoamericanos 8, no. 24 (1993): 139–70.
Otero, Hernán. “Redes Sociales Primarias, Movilidad Espacial E Inserción Social de
Los Inmigrantes En La Argentina. Los Franceses de Tandil, 1850–1914.” Estudios
Migratorios Latinoamericanos 9, no. 28 (1994): 521–48.
Parman, John. “Childhood Health and Sibling Outcomes: Nurture Reinforcing Nature
during the 1918 InÀuenza Pandemic.” Explorations in Economic History 58, issue
C (2015): 22–43.
Pérez, Santiago. “The (South) American Dream: Mobility and Economic Outcomes of
First- and Second-Generation Immigrants in 19th-Century Argentina.” Ann Arbor,
MI: Inter-university Consortium for Political and Social Research [distributor],
2017. Available at http://doi.org/10.3886/E100880V2.
Salisbury, Laura. “Selective Migration, Wages, and Occupational Mobility in Nineteenth
Century America.” Explorations in Economic History 53, issue C (2014): 40–63.
Sánchez-Alonso, Blanca. “The Other Europeans: Immigration into Latin America and
the International Labour Market (1870–1930).” Revista de Historia Económica/
Journal of Iberian and Latin American Economic History (Second Series) 25, no.
3 (2007): 395–426.
Sofer, Eugene F. From Pale to Pampa: A Social History of the Jews of Buenos Aires.
New York: Holmes and Meier, 1982.
Somoza, Jorge L. Muestras de Los Dos Primeros Censos Nacionales de Población, 1869
Y 1895. 46. Buenos Aries: Instituto Torcuato Di Tella, Centro de Investigaciones
Sociales, 1967.
Szuchman, Mark. Mobility and Integration in Urban Argentina: Córdoba in the Liberal
Era. Austin, TX: University of Texas Press, 1981.
Taylor, Alan M. “Mass Migration to Distant Southern Shores.” In Migration and
the International Labor Market, 1850–1939, edited by Tim Hatton and Jeffrey
Williamson, 91–115. London, UK: Psychology Press, 1994.
�1006
Pérez
Tolcachier, Fabiana Sabina. “Movilidad Socio-Ocupacional de Los Israelitas En El
Partido de Villarino, 1905–1950.” Estudios Migratorios Latinoamericanos 10, no.
31 (1995): 633–72.
Williamson, Jeffrey G. “The Evolution of Global Labor Markets Since 1830:
Background Evidence and Hypotheses.” Explorations in Economic History 32, no.
2 (1995): 141–96.
�
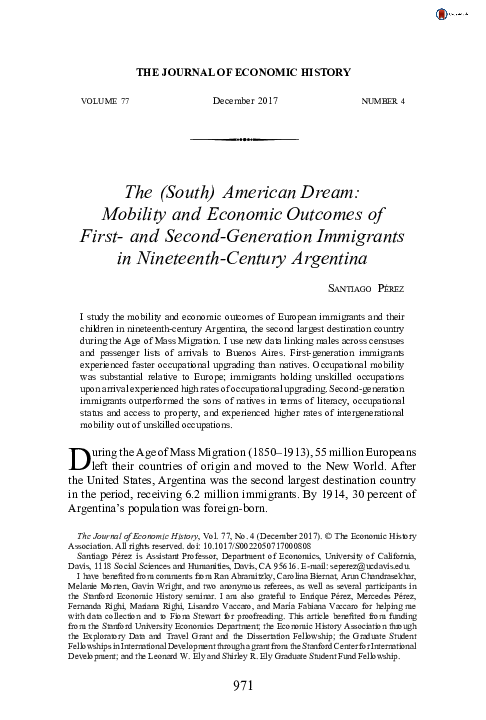
 santiago Ramírez Pérez