See discussions, stats, and author profiles for this publication at: https://www.researchgate.net/publication/51056526
Structural basis for the high-affinity
inhibition of mammalian membranous
adenylyl cyclase by...
Article in Molecular pharmacology · July 2011
DOI: 10.1124/mol.111.071894 · Source: PubMed
CITATIONS
READS
10
56
10 authors, including:
Anshuman Dixit
69 PUBLICATIONS 661 CITATIONS
SEE PROFILE
Gerald Lushington
University of Kansas
200 PUBLICATIONS 2,729 CITATIONS
SEE PROFILE
Andreas Gille
Burkhard König
50 PUBLICATIONS 1,662 CITATIONS
555 PUBLICATIONS 7,652 CITATIONS
CSL Limited
SEE PROFILE
Universität Regensburg
SEE PROFILE
All content following this page was uploaded by Gerald Lushington on 04 January 2017.
The user has requested enhancement of the downloaded file. All in-text references underlined in blue are added to the original document
and are linked to publications on ResearchGate, letting you access and read them immediately.
0026-895X/11/8001-87–96$25.00
MOLECULAR PHARMACOLOGY
Copyright © 2011 The American Society for Pharmacology and Experimental Therapeutics
Mol Pharmacol 80:87–96, 2011
Vol. 80, No. 1
71894/3697781
Printed in U.S.A.
Structural Basis for the High-Affinity Inhibition of Mammalian
Membranous Adenylyl Cyclase by 2⬘,3⬘-O-(N-Methylanthraniloyl)Inosine 5⬘-Triphosphate□S
Melanie Hübner, Anshuman Dixit, Tung-Chung Mou, Gerald H. Lushington, Cibele Pinto,
Andreas Gille, Jens Geduhn, Burkhard König, Stephen R. Sprang, and Roland Seifert
Department of Pharmacology and Toxicology, University of Regensburg, Regensburg, Germany (M.H.); Molecular Modeling
and Graphics Laboratory, University of Kansas, Lawrence, Kansas (A.D., G.H.L.); Center for Biomolecular Structure and
Dynamics, University of Montana, Missoula, Montana (T.-C.M., S.R.S.); Department of Pharmacology and Toxicology,
University of Kansas, Lawrence, Kansas (C.P., A.G.); Institute of Organic Chemistry, University of Regensburg, Regensburg,
Germany (J.G., B.K.); and Institute of Pharmacology, Medical School of Hannover, Hannover, Germany (R.S.)
Received February 20, 2011; accepted April 14, 2011
ABSTRACT
2⬘,3⬘-O-(N-Methylanthraniloyl)-ITP (MANT-ITP) is the most potent inhibitor of mammalian membranous adenylyl cyclase
(mAC) 5 (AC5, Ki, 1 nM) yet discovered and surpasses the
potency of MANT-GTP by 55-fold (J Pharmacol Exp Ther 329:
1156 –1165, 2009). AC5 inhibitors may be valuable drugs for
treatment of heart failure. The aim of this study was to elucidate
the structural basis for the high-affinity inhibition of mAC by
MANT-ITP. MANT-ITP was a considerably more potent inhibitor
of the purified catalytic domains VC1 and IIC2 of mAC than
MANT-GTP (Ki, 0.7 versus 18 nM). Moreover, there was considerably more efficient fluorescence resonance energy transfer
between Trp1020 of IIC2 and the MANT group of MANT-ITP
compared with MANT-GTP, indicating optimal interaction of
the MANT group of MANT-ITP with the hydrophobic pocket.
Introduction
Mammals express nine membranous AC isoforms (ACs
1–9) that play an important role in transmembrane signal
transduction (Sunahara et al., 1996; Tang and Hurley, 1998).
ACs are activated by the G-protein Gs via numerous receptors for hormones and neurotransmitters and catalyze the
This work was supported by the National Institutes of Health National
Institute of Diabetes and Digestive and Kidney Diseases [Grant DK46371] (to
S.R.S); the Deutsche Forschungsgemeinschaft [Grant Se 529/5–2] (to R.S.);
and the Elite Network of Bavaria (graduate research scholarship to M.H.).
Article, publication date, and citation information can be found at
http://molpharm.aspetjournals.org.
doi:10.1124/mol.111.071894.
□
S The online version of this article (available at http://molpharm.
aspetjournals.org) contains supplemental material.
The crystal structure of MANT-ITP in complex with the Gs␣and forskolin-activated catalytic domains VC1:IIC2 compared
with the existing MANT-GTP crystal structure revealed only
subtle differences in binding mode. The higher affinity of
MANT-ITP to mAC compared with MANT-GTP is probably due
to fewer stereochemical constraints upon the nucleotide base
in the purine binding pocket, allowing a stronger interaction
with the hydrophobic regions of IIC2 domain, as assessed
by fluorescence spectroscopy. Stronger interaction is also
achieved in the phosphate-binding site. The triphosphate group
of MANT-ITP exhibits better metal coordination than the
triphosphate group of MANT-GTP, as confirmed by molecular
dynamics simulations. Collectively, the subtle differences in
ligand structure have profound effects on affinity for mAC.
production of the second-messenger cAMP. Studies with
AC5(⫺/⫺) mice indicate that potent and selective AC5 inhibitors may be valuable drugs for the treatment of heart failure, aging, bone loss, anxiety, and acute and chronic pain
(Chester and Watts, 2007; Rottlaender et al., 2007; Kim et
al., 2008; Okumura et al., 2009).
Previous studies from our group showed that 2⬘,3⬘-O-(Nmethylanthraniloyl) (MANT)-substituted purine nucleotides
are competitive AC inhibitors and inhibit AC isoforms differentially (Gille and Seifert, 2003; Gille et al., 2004). Moreover,
MANT nucleotides are fluorescence probes of conformational
changes in the catalytic site of AC. Crystal structures of the
purified catalytic subunits of Gs␣-bound mammalian AC [C1
subunit of AC5 (VC1) and C2 subunit of AC2 (IIC2) in complex with MANT-GTP and MANT-ATP] were resolved (Mou
ABBREVIATIONS: AC, adenylyl cyclase; MANT, 2⬘,3⬘-O-(N-methylanthraniloyl); FS, forskolin; GTP␥S, guanosine 5⬘-[␥-thio]triphosphate; MES,
2-(N-morpholino)ethanesulfonic acid; PDB, Protein Data Bank; GBSA, Generalized Born, augmented by solvent-accessible surface; FRET,
fluorescence resonance energy transfer; ex, excitation wavelength; em, emission wavelength; mAC, mammalian membranous adenylyl cyclase;
VCI and IIC2, the N- and C-terminal catalytic domains, respectively, from canine AC5 and rat AC2 expressed as soluble proteins.
87
88
Hübner et al.
et al., 2005, 2006). Those studies revealed a tripartite binding
pocket for MANT nucleotides in the catalytic core consisting
of sites for the base, the MANT-substituted ribosyl group,
and the polyphosphate chain. The combined analysis of enzymatic, fluorescence spectroscopy, crystallographic, and molecular modeling data revealed that the MANT group contributes most to the AC binding energy, whereas the base
makes the smallest contribution. This is reflected by the fact
that MANT nucleotides exhibit up to 17,000-fold higher affinity for AC than their nonsubstituted parent nucleotides
and that purine and pyrimidine nucleotides exhibit similar
affinity for AC (Gille et al., 2004, 2005). On the basis of those
data, we proposed that ACs exhibit a high degree of conformational flexibility, allowing the catalytic site to accommodate structurally diverse bases (Mou et al., 2006; Wang et al.,
2007).
During the course of our subsequent systematic studies on
2⬘,3⬘-O-ribosyl-substituted nucleotides as mAC inhibitors
(Göttle et al., 2009; Suryanarayana et al., 2009), we serendipitously identified MANT-ITP as the most potent mAC
inhibitor known so far. Specifically, MANT-ITP inhibits AC5
with a Ki value of 1 nM and mouse heart AC (predominantly
representing AC5) with a Ki value of 4 nM. Compared with
MANT-GTP, MANT-ITP possesses a 55-fold higher affinity
for recombinant AC5. The base hypoxanthine differs chemically from the base guanine by the absence of an NH2 group
at C2 of the purine ring (Fig. 1). Accordingly, hypoxanthine
cannot to form a hydrogen bond with the backbone oxygen of
Ile1019 (Mou et al., 2005). On the basis of analogous studies
with GTP, ITP, and XTP on GTP-binding proteins (Seifert et
al., 1999; Gille et al., 2003; Gille and Seifert, 2004), one would
also expect that the missing hydrogen bond should actually
reduce affinity of mAC for MANT-ITP. This notion is further
supported by the fact that MANT-XTP, bearing a keto group
at C2 of the purine ring (Fig. 1), binds to mAC with much
lower affinity than MANT-GTP because of electrostatic repulsion of the keto group of the xanthine group by the backbone oxygen of Ile1019 (Mou et al., 2005).
Therefore, the aim of our present study was to elucidate
the structural basis for the high-affinity interaction of mAC
with MANT-ITP, using the VC1:IIC2 heterodimer as an established model of the mAC catalytic domain. First, we determined the affinities of VC1:IIC2 for MANT-GTP, MANTITP, and MANT-XTP in enzyme activity assays (Gille et al.,
2004). Second, we performed fluorescence studies with the
three MANT nucleotides (Mou et al., 2006). Third, we analyzed the crystal structure of VC1:IIC2 in complex with
MANT-ITP and compared this structure with the known
VC1:IIC2 structure in complex with MANT-GTP (Mou et al.,
2005). Last, we conducted molecular dynamics simulations to
further evaluate the structural requirements for the highaffinity interaction of MANT-ITP with AC5 in comparison to
MANT-GTP (Wang et al., 2007). Here, we show that even
subtle differences in ligand structure have profound effects
for interaction with mAC.
Materials and Methods
Materials. MANT-ITP was synthesized according to Hiratsuka
(1983) with the modifications described by Taha et al. (2009).
MANT-GTP and MANT-XTP were obtained from Jena Bioscience
(Jena, Germany). [␣-32P]ATP (800 Ci/mmol) was purchased from
PerkinElmer Life and Analytical Sciences (Boston, MA). Aluminum oxide 90 active, neutral (activity 1, particle size 0.06–0.2 mm)
was purchased from Merck (Darmstadt, Germany). Bovine serum
albumin, fraction V, highest quality, was from Sigma-Aldrich (St.
Louis, MO). MnCl 2 tetrahydrate (highest quality) was from
Merck. FS was from LC Laboratories (Woburn, MA).
AC Activity Assay. AC activity was determined essentially as
described in the literature (Mou et al., 2005). In brief, reaction
mixtures contained 100 M ATP/Mn2⫹, 10 mM MnCl2, and MANT
Fig. 1. Structure of MANT nucleoside 5⬘-triphosphates
(NTPs). Represented are MANT-ITP, MANT-GTP, and
MANT-XTP, the MANT nucleotides used for enzymatic
studies, fluorescence spectroscopy, crystallography, and
structure activity evaluation. The MANT group isomerizes between the 2⬘ and 3⬘-O-ribosyl function. Note the
different substitution of the C2 carbon atom of the
purine ring in the various nucleotides.
Crystal Structure of Adenylyl Cyclase with MANT-ITP
nucleotides at concentrations from 0.1 nM to 1 mM as appropriate to
obtain saturated inhibition curves. In addition, assay tubes contained VC1 (8 nM) and IIC2 (40 nM). For experiments with Gs␣GTP␥S, tubes contained VCI (3 nM), IIC2 (15 nM) and Gs␣-GTP␥S
(51 nM). Reactions were conducted in the presence of 100 M FS.
After a 2-min preincubation at 30°C, reactions were initiated by
adding 20 l of reaction mixture containing (final) 1.0 Ci/tube
[␣-32P]ATP, 0.1 mM cAMP, and 100 mM KCl in 25 mM HEPES/
NaOH, pH 7.4. Reactions were conducted for 10–20 min at 30°C
and were terminated by the addition of 20 l of 2.2 N HCl. Denatured
protein was precipitated by a 1-min centrifugation at 25°C and
15,000g. Sixty-five microliters of the supernatant fluid were applied
onto disposable columns filled with 1.3 g of neutral alumina.
[32P]cAMP was separated from [␣-32P]ATP by elution of [32P]cAMP
with 4 ml of 0.1 M ammonium acetate, pH 7.0. Recovery of
[32P]cAMP was ⬃80% as assessed with [3H]cAMP as standard.
[32P]cAMP was determined by liquid scintillation counting using
Ecolume scintillation cocktail (Thermo Fisher Scientific, Waltham,
MA). Competition isotherms were analyzed by nonlinear regression
using the Prism 4.0 software (GraphPad Software, San Diego, CA).
Fluorescence Spectroscopy. All experiments were conducted
using a Cary Eclipse fluorescence spectrophotometer equipped with
a Peltier-thermostated multicell holder at 25°C (Varian, Palo Alto,
CA). Measurements were performed in a quartz fluorescence microcuvette (Hellma, Plainview, NY). The final assay volume was 150 l.
Reaction mixtures contained a buffer consisting of 100 mM KCl, 10
mM MnCl2, and 25 mM HEPES/NaOH, pH 7.4. Steady-state emission spectra were recorded at low speed with ex ⫽ 350 nm (em ⫽
370–500 nm) and ex ⫽ 280 nm (em ⫽ 300–500 nm) with various
MANT nucleotides (1 M each) in the absence and presence of 5 M
VC1 plus 25 M IIC2 without and with 100 M FS. Fluorescence
recordings were analyzed with the spectrum package of the Cary
Eclipse software (Varian, Walnut Creek, CA). Baseline fluorescence
(buffer alone) was subtracted. Figure 2 shows superimposed original
fluorescence recordings representative for two to three independent
experiments with at least two different batches of VC1:IIC2.
Preparation of Proteins. The catalytic subunits VC1, IIC2, and
GTP␥S-activated Gs␣ were expressed in Escherichia coli BL21(DE3)
cells containing pREP4 plasmid. The plasmids encode the wild-type
C1a domain of canine AC 5 (residues 364–580), the C2a domain of rat
AC 2 (residues 874-1018), and bovine Gs␣ (residues 1–396). VC1 and
Gs␣ constructs were expressed with a hexahistidine tag at their Nand C-termini, respectively. They were purified and stored as described previously (Tesmer et al., 2002). Gs␣ was further activated by
incubation with 500 M GTP␥S and 2 mM MgCl2 at 30°C for 2 h, and
digestion of the complex with trypsin was necessary for crystallization work. The smaller fragment, containing residues 39–387 was
further purified using a nickel-nitrilotriacetic acid-NTA column followed by MonoQ anion exchange chromatography.
Complex Formation and Crystallization with MANT-ITP.
To form a stable heterotrimeric complex, the recombinant proteins
were mixed in the following order VC1-IIC2–Gs␣–GTP␥S in a molar
ratio 1.5:1:1. Thereafter, forskolin (200 M) was added to further
stabilize the complex. The protein mixture was incubated on ice for
at least 30 min and then applied to tandem-arranged Superdex 75
and 200 gel filtration columns (GE Healthcare, Chalfont St. Giles,
Buckinghamshire, UK). Only the fractions containing the complex
were collected and concentrated to ⬃9.5 mg/ml in a buffer of 20 mM
HEPES, pH 8.0, 1 mM EDTA, 2 mM MgCl2, 5 mM dithiothreitol, 100
mM NaCl, 200 M 7-acetyl-7-[O-(N-methylpiperazino)-␥-butyryl)]forskolin, and 500 M GTP␥S. The concentrated protein solution was
used to grow crystals via the sitting-drop method with a reservoir
solution of 7.2% (m/v) polyethylene glycol 8000, 0.5 M NaCl, and 0.1
M MES, pH 5.4, at 16°C for 3 to 4 weeks. Large crystals were soaked
with 2 mM MANT-ITP and 3 mM MnCl2 for at least 2 h at room
temperature and then harvested in a cryoprotectant consisting of 9%
(m/v) polyethylene glycol 8000, 30% (m/v) polyethylene glycol 400,
0.1 M MES, pH 5.4, 0.5 M NaCl, 20 mM HEPES, pH 8.0, 1 mM
89
EDTA, 2 mM dithiothreitol, 200 M 7-acetyl-7-[O-(N-methyl-piperazino)-␥-butyryl)]-forskolin, 100 M GTP␥S, 2 mM MANT-ITP, and
3 mM MnCl2. The cryoprotected crystals were mounted in 0.1- to
0.2-mm loops and stored in liquid nitrogen.
Structure Determination and Model Refinement. Diffraction
data sets were collected at the Stanford Synchrotron Radiation
Lightsource SSRL-SMB-MC 9-1 beamline (Stanford, CA) by the oscillation method (1°/frame, 60 s/frame). The incident beam wavelength was 0.9795 Å. The images were processed using the HKL2000
package (Otwinowski and Minor, 1997). Because of anisotropy of the
plate-type crystal, data with l index ⬎21 were excluded from the data
set. Structures were determined by molecular replacement using the
structure of the Gs␣-GTP␥S:VC1:IIC2 complex [Protein Data Bank
(PDB) code 1AZS] as the initial phasing model (Tesmer et al., 1997).
Atomic positions and thermal parameters of the mAC structure were
refined by Refmac5.5 using the CCP4 program suite (Collaborative
Computational Project Number 4, 1994). MANT-ITP and metal ions
in the structure were located in the weighted |Fo|⫺|Fc| omit map
computed with phases from the refined model. The model was iteratively improved by manual refitting into weighted 2|Fo|⫺|Fc|map
using the computer graphics program Coot (Emsley and Cowtan,
2004) and subsequent refinement cycles with CCP4. The refined
crystal structure was visualized with PyMOL (DeLano, 2002). Coordinates for the MANT-ITP:Mn2⫹ structure were deposited in the
Protein Data Bank with the code PDB 3G82.
Molecular Dynamics Simulations. Atomic coordinates of protein-ligand complexes for MANT-ITP and MANT-GTP interacting
with VC1:IIC2 were extracted from structures PDB 3G82 and PDB
1TL7. Ligand parametrization for FS, MANT-GTP, and MANT-ITP
was performed by extracting the relevant ligands from the crystal
structures and editing them via SYBYL (Tripos Inc., St. Louis, MO)
to ensure proper representation of valence and bond types. Thereafter, the antechamber (Wang et al., 2001) module of AMBER10
(http://www.ambermd.org) was used to assign Austin model 1-bond
charge correction (AM1-BCC) charges to the ligands and calculate
force field parameters for them. To avoid excessively large computational expense, only the VC1:IIC2 portion of each crystal structure
(plus ligand and cofactor) was retained; bound Gs␣-GTP␥S was removed. The tleap module of AMBER10 was used for the preparation
of topology and coordinate files for the protein-ligand complexes
using the ff99SB force field parameters for protein and the antechamber-calculated parameters for ligands. The parameters for
Mn2⫹ were obtained from Bradbrook et al. (1998). The structures
PDB 3G82 and PDB 1TL7 were separately solvated in water boxes
with buffering distance of 10 Å. Assuming normal charge states of
ionizable groups corresponding to pH 7.0, Na⫹ ions were added to
achieve charge neutrality and to mimic the biological environment
more closely.
Our primary simulation engine for probing the differences in the
dynamic nature of the two complexes was NAMD (Phillips et al.,
2005; http://www.ks.uiuc.edu/Research/namd/), which was chosen
because of its excellent parallel scalability, which enabled us to
perform the simulations in an expeditious manner on 32 nodes of a
large Linux cluster. To relieve severe steric contacts and instances of
higher energy conformations that might destabilize the molecular
dynamics integrator at later stages, the system was subjected to
initial minimization of 2 ⫻ 104 steps wherein the protein backbone
was held fixed (to relax surrounding water molecules and computationally specified hydrogen positions), followed by 2 ⫻ 104 steps of
minimization without positional constraints (i.e., to allow the system
to relax freely). The resulting low-energy (⬃0 K) model was then
equilibrated to room temperature (⬃300 K) by gradually increasing
the system temperature in increments of 20 K up to a target temperature of 300 K. At each of the 15 temperature increments, 1.5 ⫻
104 dynamics steps (30 ps) were run while employing a restraint of
10 kcal 䡠 mol⫺1 䡠 Å⫺2 on protein ␣ carbons (C␣) to avoid any prospect
of unrealistic denaturation behavior. Thereafter, the system was
equilibrated for 15 ⫻ 104 steps (300 ps) at 310 K (approximate
90
Hübner et al.
physiological temperature) under conditions of constant volume and
temperature, and then for a further 15 ⫻ 104 steps (300 ps) at 310 K
using a Langevin piston (constant pressure and temperature) to
achieve uniform pressure of 1 bar. Finally the restraints were removed and the system was equilibrated for 5 ⫻ 106 steps (1 ns) to
prepare the system for final analysis. For the latter, a constant
pressure and temperature simulation was run on the equilibrated
structure for 9.6 ns, keeping the temperature at 310 K and pressure
at 1 bar using Langevin piston coupling algorithm. The integration
time step of the simulations was set to 2.0 fs, the SHAKE algorithm
was used to constrain the lengths of all chemical bonds involving
hydrogen atoms at their equilibrium values, and the geometry was
restrained rigidly via the SETTLE algorithm. Nonbonded van der
Waals interactions were treated via a switching function at 10 Å and
reaching zero influence at a distance of 12 Å, and the Mn2⫹ cofactors
were subjected to a soft harmonic constraint (1 kcal/mol) to encourage adherence to equilibrium approach distances relative to the
ligand phosphate oxygens as determined from an earlier simulation.
The particle-mesh Ewald algorithm as implied in NAMD was used to
handle long-range electrostatic forces.
To probe relative contributions to the total free energy of the
complexes, we employed the GBSA (Generalized Born, augmented by
solvent-accessible surface) method (Weiser et al., 1999; Bashford and
Case, 2000; Onufriev et al., 2000). For this, the trajectory obtained
from the molecular dynamics run was converted into individual
coordinate files at 100-ps intervals excluding the initial 1.0 ns of the
simulation. Thus, 86 frames were used in GBSA calculation for each
complex. AMBER parameters (using bonding radii for GBSA calculation) were then generated from the resulting structures using tleap
and were subsequently applied in GBSA calculation. The radii for
300
A
λex =280 nm
100
Intensity (a.u)
λex = 350 nm
D
λex = 350 nm
F
λex = 350 nm
250
80
200
60
150
40
100
20
50
0
0
300
λex = 280 nm
C
100
250
80
200
60
150
40
100
20
50
0
0
300
100
B
E
λex = 280 nm
250
80
200
60
150
40
100
20
50
0
300
0
350
400
450
Wavelength (nm)
500
400
450
Wavelength (nm)
500
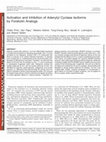
Fig. 2. Fluorescence emission spectra of MANT-GTP,
MANT-ITP and MANT-XTP. Emission at ex ⫽ 280 nm
(em ⫽ 300 –500 nm) and at ex ⫽ 350 nm (em ⫽ 370 –500
nm) are represented. Experiments were conducted at 25°C.
Addition of MANT nucleotides (1 M), blue lines; subsequent addition of VC1 (5 M) and IIC2 (25 M), green
lines; subsequent addition of FS (100 M), red lines.
Dashed lines in A to C represent endogenous tyrosine/
tryptophan fluorescence of VC1:IIC2. Reaction mixtures
contained a buffer of 100 mM KCl, 10 mM MnCl2, and 25
mM HEPES/NaOH, pH 7.4. Three independent experiments with at least two different batches of VC1:IIC2 were
performed. A and B, MANT-GTP; C and D, MANT-ITP; E
and F, MANT-XTP. Fluorescence intensities are shown in
arbitrary units (a.u.). For FRET (A, C, and E, ex ⫽ 280
nm), the fluorescence observed with VC1:IIC2 was set to
100%. In direct fluorescence experiments (B, D, and
F, ex ⫽ 350 nm), the fluorescence observed with MANT
nucleotides alone was set to 100%.
Crystal Structure of Adenylyl Cyclase with MANT-ITP
Mn2⫹ was specified as being the same as Mg2⫹, because GBSA
parameters for Mn2⫹ are unavailable in AMBER. The change of
conformational entropy was not considered. Apart from a number of
settings chosen specifically for this analysis, default GBSA parameters were employed [implicit Generalized Born (IGB) ⫽ 2 to specify
the Onufriev, Bashford and Case (OBC) model, GBSA ⫽ 1 to choose
the linear combination of pairwise overlaps (LCPO) method for
solvent-accessible surface area calculation, external dielectric
(EXTDIEL) ⫽ 78.50 to set the solvent dielectric for roomtemperature water, internal dielectric (INTDIEL) ⫽ 1.0 to specify
a solute dielectric for the system, and surface tension
(SURFTEN) ⫽ 0.0072 to describe the water surface tension].
Results
Enzymatic Studies. Table 1 lists the Ki values of MANTGTP, MANT-ITP, and MANT-XTP for inhibition of VC1:IIC2
under maximally stimulatory conditions (i.e., in the presence
of Gs␣-GTP␥S) as well as under submaximally stimulatory
conditions (i.e., in the absence of Gs␣-GTP␥S). The latter
reflects the assay conditions for the fluorescence spectroscopy
studies. In accordance with the data for AC5 and mouse
heart AC (Göttle et al., 2009), under maximally stimulatory
conditions, MANT-ITP was a considerably more potent inhibitor of VC1:IIC2 than MANT-GTP, which, in turn, was
much more potent than MANT-XTP. The omission of Gs␣GTP␥S reduced the overall MANT nucleotide potencies by 4to 10-fold, but the rank order of affinity of nucleotides was
preserved. Collectively, the enzyme inhibition studies with
purified catalytic subunits of mAC confirmed the exceptionally high affinity of MANT-ITP for the catalytic site previously reported for AC5 and mouse heart AC (Göttle et al.,
2009).
Fluorescence Spectroscopy Studies. To elucidate further differences in the interaction of MANT nucleotides with
VC1:IIC2, we exploited the fluorescence properties of these
nucleotides (Jameson and Eccleston, 1997) and the ability of
the MANT group to bind to a hydrophobic pocket in the
interface of VC1:IIC2 (Mou et al., 2005, 2006). The emission
spectra of nucleotides at ex ⫽ 350 nm for direct excitation of
the MANT group (Jameson and Eccleston, 1997), and at
ex ⫽ 280 nm for analysis of FRET between Trp1020 in IIC2
and the MANT group were determined (Mou et al., 2005).
Fluorescence studies were performed in the presence of a
5-fold excess of VC1 relative to MANT nucleotides to ensure
quantitative ligand binding to the catalytic site.
TABLE 1
Inhibitory potencies of MANT-NTPs on the catalytic activity of VC1:
IIC2
Catalytic activities of VC1:IIC2 were determined as described under Materials and
Methods. Reactions were conducted in the presence of 10 mM MnCl2 and 100 M FS
in the absence or presence of Gs␣-GTP␥S. Data were analyzed by nonlinear regression to calculate Ki values. The catalytic activity of C1/C2 in the presence of Mn2⫹ ⫹
FS ⫹ Gs␣-GTP␥S with 100 M ATP as substrate was 2700 ⫾ 350 nmol 䡠 mg⫺1 䡠 min⫺1
and in the presence of Mn2⫹ ⫹ FS, the activity was 300 ⫾ 110 nmol 䡠 mg⫺1 䡠 min⫺1.
The Km values for VC1:IIC2 were reported previously (Mou et al., 2005) for each
experimental condition (430 and 620 M, respectively) and were used to calculate Ki
values from IC50 values. Data are the mean values ⫾ S.D. of two to four independent
experiments performed in duplicates with at least two different batches of protein.
MANT-Nucleotide
Ki VC1:IIC2 Mn2⫹
⫹ FS
⫹ FS ⫹ Gs␣-GTP␥S
nM
MANT-GTP
MANT-ITP
MANT-XTP
18 ⫾ 6.0
0.7 ⫾ 0.1
1,200 ⫾ 370
130 ⫾ 20
7.0 ⫾ 3.2
4,600 ⫾ 510
91
At ex ⫽ 280 nm, MANT nucleotides were only minimally
excited, whereas at ex ⫽ 350 nm, they showed substantial
intrinsic fluorescence signals with an emission peak at ⬃450
nm (Fig. 2, blue tracings). The dashed black lines indicate the
endogenous tryptophan fluorescence of VC1:IIC2 at ex ⫽
280 nm (i.e., the fluorescence in the absence of MANT nucleotide). After the addition of VC1:IIC2, at ex ⫽ 280 nm,
MANT-ITP exhibited a much higher basal FRET signal, as
revealed by a second emission peak at em ⫽ 420 nm, than
MANT-GTP (Fig. 2, A and C, green tracings). At ex ⫽ 350
nm, the interaction of MANT-ITP with VC1:IIC2 resulted in
considerably higher increases in fluorescence compared with
MANT-GTP (Fig. 2, B and D, green tracings). The blue shift
of the fluorescence emission (Mou et al., 2005) was similar for
MANT-ITP and MANT-GTP. FS (100 M) increased basal
FRET and direct fluorescence with MANT-GTP more effectively than with MANT-ITP, but the absolute FRET with
MANT-ITP was still considerably larger than with MANTGTP. These data suggest that the MANT group of MANT-ITP
binds to the hydrophobic pocket in mAC more effectively
than MANT-GTP. Compared with MANT-GTP and MANTITP, MANT-XTP exhibited only minimal FRET and direct
fluorescence (Fig. 2, E and F), reflecting suboptimal binding
of the xanthine ring to mAC and suboptimal insertion of the
MANT group into the hydrophobic pocket (Mou et al., 2005).
Crystallographic Studies. To better understand the
high inhibitory potency of MANT-ITP at ACs 1, 2, and 5
(Göttle et al., 2009), as well as at the catalytic domains
VC1:IIC2 (Table 1), crystallographic studies were conducted.
Crystals of FS-VC1:IIC2-Gs␣-GTP␥S were soaked with 2 mM
MANT-ITP and 3 mM MnCl2. The structure of the MANTITP:Mn2⫹ complex was determined at a resolution of 3.1 Å by
molecular replacement using the structure of the Gs␣GTP␥S:VC1:IIC2 complex as the initial phasing model (Tesmer et al., 1997) (PDB code 1AZS). Crystallographic data
collection and refinement statistics are summarized in Table 2.
Interactions between Gs␣-GTP␥S and the pseudosymmetric
VC1 and IIC2 catalytic domains center largely on IIC2, as
described previously (Tesmer et al., 1997). The two domains
form a very large interface, facilitating the binding of MANTITP at the catalytic site, and FS at the pseudo–dyad-related
site. The structure was very similar to the corresponding
complex with MANT-GTP (Fig. 1) (Mou et al., 2005) (PDB
code 1TL7). Superimposing the two structures revealed that
the overall placement of VC1 and IIC2 did not differ greatly
from each other with the root-mean-square deviation less
than 0.5 Å (Fig. 3C).
MANT-ITP was modeled into the continuous |Fo|-|Fc|
map in the binding pocket. The electron density was more
consistent with 3⬘-O-MANT-ITP than the 2⬘-O-MANT isomer
(Fig. 3A). Our previous crystallographic studies with MANTGTP and MANT-ATP gave similar results (Mou et al., 2005;
200). Difference electron density peaks corresponding to the
two Mn2⫹ ions are observed; wherein the A site exhibits
lower occupancy than the B site, suggesting that the Mn2⫹
ion is bound more tightly at the B site, as observed in other
mAC crystal structures (Mou et al., 2005, 2006).
The overall conformation of MANT-ITP bound to VC1:IIC2
is similar to that observed for MANT-GTP. The ligands are
similar with respect to interactions with protein residues and
metal ion coordination (Fig. 3, B and D). The |Fo|-|Fc|
electron density for MANT-ITP is well defined and similar to
92
Hübner et al.
that observed for MANT-GTP, indicating no obvious difference in the conformation of the two ligands. One noticeable
difference is that the hypoxanthine ring of MANT-ITP lacks
an amino group at the C2 position (Fig. 1) that could form a
hydrogen bond with the side chain of Ile1019 of IIC2 domain
(MANT-GTP 2.6 Å; Fig. 3D). Despite the absence of this
interaction, MANT-ITP binds with higher affinity to VC1:
IIC2 than MANT-GTP, as indicated above (Table 1). The
absence of the C2-amino group allows a higher degree of
mobility of the purine moiety than in the case of MANTGTP (Fig. 3D). The purine ring of MANT-ITP is somewhat
more deeply inserted in the mAC binding site than that of
MANT-GTP.
In the crystal structure, the MANT group of MANT-ITP
and MANT-GTP form similar interactions at the ␣4⬘-␣1 domain interface. The aryl function of MANT engages in hydrophobic interactions with Ala409, Leu412, Val413,
Val1024, Val1026, and Trp1020 (Fig. 4). The increase in the
fluorescence signal for MANT-ITP may be due to changes of
the relative positions of Trp1020 and the MANT group (Fig.
2). However, electron density is weak for the MANT moiety,
suggesting that it is poorly ordered within the binding site
(Fig. 3A). The oxygen of the carbonyl group of MANT-ITP is
closer to Asn1025 than that of MANT-GTP (Fig. 4). However,
in this orientation, the side chain of Asn1025 does not form
an H-bond with the carbonyl group of MANT-ITP.
A stronger interaction of MANT-ITP with the phosphate
binding site is supported by two observations. The side chain
Lys1065 of IIC2 interacts with the - and ␥-phosphates of
MANT-ITP, whereas the amino group of Lys1065 in the
MANT-GTP structure is oriented only toward the ␥-phosphate (Fig. 3C). The amino group of Lys1065 is also closer to
the oxygen of the -phosphate of MANT-ITP (2.9 Å) compared
with the oxygen of the ␥-phosphate of MANT-GTP (3.1 Å).
TABLE 2
Summary of crystallography data collection and refinement statistics
Parameters
Cell constants (Å)
a
b
c
No. of crystals
Dmin (Å)
Average redundancy
Rsym (%)b
Completeness (%)
⬍I⬎/⬍⬎
Resolution range for refinement (Å)c
Total reflections used
No. of protein atoms
No. water molecules
No. ligand atoms
rmsd bond length (Å)
rmsd bond angle (°)
Rwork (%)d
Rfree (%)e
Average B-factor (Å2)
MANT-ITP:Mn2⫹
117.6
133.4
70.6
1
3.1
3.0 (1.8)a
17.9 (34.5)
81.4 (55.1)
4.5 (1.7)
15–3.1
15824
5645
5
106
0.007
1.21
24.1
29.4
45.2
rmsd, root mean square deviation.
a
Numbers in parentheses correspond to the statistical data from the highest
resolution shell.
b
Rsym ⫽ 兺h兺i | I(h) - I(h)i| / 兺h兺i I(h)i , where I(h) is the mean intensity after
rejections.
c
Because of anisotropy, data with an l index greater than 21 were omitted from
refinement.
d
Rwork ⫽ 兺h ||Fo(h)|-|Fc(h)||/兺h |Fo (h)|, Fo (h) and Fc (h) are the observed and
calculated structure factors, respectively.
e
5.1% of the complete data set was excluded from refinement to calculate Rfree.
Of particular interest are the differences between the
MANT-ITP and MANT-GTP complexes with respect to coordination of the Mn2⫹ ions by the nucleotide  and ␥ phosphates and the side chain of Asp396. The carboxylate group
of Asp396 coordinates the two metal ions, together with the
nucleotide phosphates and Ile397 and Asp440 of VC1 (Fig.
3B). Diffuse electron density in the region of the -phosphate
is consistent with conformational heterogeneity of the ligand
and, consequently, its ligation of the Mn2⫹ ions at the A and
B sites (Fig. 3A). This may account in part for differences in
metal coordination for MANT-ITP and MANT-GTP. The
Mn2⫹ ions in the MANT-ITP structure form close contacts
with the ␣- and ␥-phosphates, whereas in the MANT-GTP
structure, the Mn2⫹ ions interact predominantly with the
-phosphate. The -phosphate group of MANT-ITP also
seems to be more tightly coordinated, because of the shorter
(2.8 Å) contact with the carbonyl group of Ile397, than is the
case for MANT-GTP (3.4 Å). The phosphate site plays a
crucial role for binding affinity because phosphate group
removal dramatically reduces inhibitor potency (Gille et al.,
2004).
Molecular Dynamics Simulations. Our molecular dynamics simulations corroborate the finding that MANT-ITP
has affinity for VC1:IIC2 higher than that of MANT-GTP.
Specifically, the GBSA free energy analysis determined a
total free energy for the MANT-ITP/VC1:IIC2 system of
⫺99.71 ⫾ 10.29 kcal/mol (mean ⫾ S.D., as derived from
sampling 86 time steps), whereas the MANT-GTP/VC1:IIC2
system complex had a free energy of only ⫺69.60 ⫾ 8.94
kcal/mol. Nearly all of this difference can be accounted for in
terms of two factors: the NT-ITP complex was predicted
to derive a substantial advantage from electrostatics
(⫺951.66 ⫾ 36.75 versus ⫺847.41 ⫾ 38.66 kcal/mol for
MANT-GTP) but to incur a penalty in terms of a less favorable solvation profile (890.24 ⫾ 30.79 versus 819.68 ⫾ 34.53
kcal/mol). To ascertain the source of these interaction differences, we performed distance analysis over a set of ⬃9600
sample conformers (taken from each 1000 time steps in the
9.6-ns simulation) to identify any specific receptor-ligand
interatomic distances that differed significantly from one
ligand to the other. The most important distinction was
found not in comparing the hypoxanthine and guanine rings
(the only true chemical difference between the two ligands),
but rather in the interactions between the Mn2⫹ ions of the
receptor and an oxygen on the -phosphate group of the
ligand triphosphate moiety. Specifically, although both ligands orient one ␣-, one -, and one ␥-phosphate oxygen in
close association to one or more of the metal ions, the dynamic conformation of MANT-ITP enables a second  oxygen
to remain significantly closer to a Mn2⫹ ion (2.36 ⫾ 0.08 Å)
than is the case for MANT-GTP (3.29 ⫾ 0.65 Å). The substantially shorter mean distance between the MANT-ITP 
oxygen and the nearest Mn2⫹ suggests a significantly stronger electrostatic interaction (Fig. 5). Specifically, a twist in
the orientation of the nucleobase propagates through the
ribosyl moiety (in ways that do not substantially affect the
interactions of these groups) to the triphosphate chain.
The triphosphate group is pulled approximately 0.7 Å closer
to the nucleobase, which has the important effect of positioning both  oxygens of MANT-ITP (rather than just one for
MANT-GTP) in an orientation that permits interaction with
Mn2⫹ ions. It is noteworthy that the much greater S.D.
Crystal Structure of Adenylyl Cyclase with MANT-ITP
observed for the  oxygen to Mn2⫹ interaction in MANT-GTP
complex suggests that the manganese ion can interact more
readily with solvent in the latter case, which is a plausible
cause for the more favorable solvation energy for the MANTGTP complex. Supplemental Fig. 1 and Supplemental Tables
1 to 3 provide further details on the differences in interactions of MANT-GTP and MANT-IP with VC1:IIC2.
Discussion
We developed a tripartite pharmacophore model for mAC
with a binding site for the base, the (substituted) ribosyl
group, and the polyphosphate chain (Mou et al., 2005, 2006).
In a previous study, we reported that MANT-GTP␥S and
93
MANT-inosine 5⬘-[␥-thio]triphosphate are similarly potent
inhibitors of various mACs (Gille et al., 2004). Omission of
the MANT group reduces inhibitor affinity by several orders
of magnitude, highlighting the importance of the MANTbinding site for high inhibitor affinity (Gille et al., 2004). It is
noteworthy that unsubstituted inosine 5⬘-[␥-thio]triphosphate is a more potent mAC inhibitor than GTP␥S, whereas
GTP and ITP exhibit similar affinity (Gille et al., 2005). In
contrast, MANT-ITP is a considerably more potent mAC
inhibitor than MANT-GTP (Göttle et al., 2009). These data
indicate that subtle structural changes in nucleotide inhibitors (exchange guanine and hypoxanthine; exchange ␥-phosphate and ␥-thiophosphate) substantially change the relative
contributions of the three binding subsites in mAC for inhib-
Fig. 3. Binding mode of MANT-ITP and two Mn2⫹ ions in the catalytic site. MANT-ITP and two metal ions are bound in the cleft between the soluble C1a
and C2a domains. VC1 and IIC2 are colored wheat and light pink, respectively. MANT-ITP is shown as stick model, carbon atoms are cyan, nitrogen atoms
are dark blue, oxygen atoms are red, and phosphorus atoms are green. The two Mn2⫹ ions are shown as orange spheres. A, difference electron density for
3⬘-O-MANT-ITP and Mn2⫹. The lime green wire represents the |Fo|-|Fc| electron density for MANT-ITP contoured at 2.5 . The blue wire corresponds to
the |Fo|-|Fc| electron density for the two Mn2⫹ ions contoured at 5 . The coordinates for the ligands were omitted from the phasing model. The secondary
structure elements of the complex are labeled as defined previously (Tesmer et al., 1997). B, detailed view of substrate binding site of VC1:IIC2 with
MANT-ITP:Mn2⫹. The catalytic site of VC1:IIC2 shows MANT-ITP, A- and B- site of two Mn2⫹ ions and the protein residues that are responsible for ligand
interaction. The interaction among protein residues and MANT-ITP, Mn2⫹ are shown as dashed gray lines. C, superimposed crystal structures of
3⬘-O-MANT-ITP and 3⬘-O-MANT-GTP. The derived MANT-ITP crystal structure was superimposed and compared with the crystal structure of MANT-GTP,
shown as a transparent yellow stick model (Protein Data Bank code 1TL7) (Mou et al., 2005). The protein residues are in almost identical conformation, and
the inhibitors are situated in the substrate binding pocket in a similar fashion. D, superimposed purine binding site of 3⬘-O-MANT-ITP and 3⬘-O-MANTGTP. The interaction of the hypoxanthine ring and guanine ring of MANT-ITP and MANT-GTP are shown as dashed black and olive green lines,
respectively. The distances of hydrogen bond between the hypoxanthine ring and surrounding protein residues of MANT-ITP are indicated in
Ångstroms. The hydrogen bond between Ile1019 and the amino group of MANT-GTP is missing in the MANT-ITP structure. Lys938 and the
oxygen of the hypoxanthine ring are further apart. The hypoxanthine ring has less binding constraint in the purine binding pocket in comparison
to the guanine ring of MANT-GTP.
94
Hübner et al.
itor affinity. The main goal of the present study was to
elucidate the structural basis for the exceptionally high affinity of mAC for MANT-ITP (Göttle et al., 2009).
Our data suggest that a balance of binding energies among
the three pharmacophores in the mAC binding site (Mou et
al., 2006) considerably affects the affinity of mAC for MANTITP versus MANT-GTP. The MANT-ITP structure shares the
common features with previously published mAC structures
in complex with 2⬘,3⬘-substituted purine and pyrimidine nu-
Fig. 4. MANT-binding site. A detailed view of the MANT-binding site is
depicted. MANT-ITP is shown as a stick model; carbon atoms are cyan,
nitrogen atoms are dark blue, oxygen atoms are red and one phosphorus
atom is displayed in green. VC1 and IIC2 are colored wheat and light
pink, respectively. MANT-GTP is shown as a transparent yellow stick
model. The carbonyl group of MANT-ITP is in closer contact to Asn1025
but does not interact with the side chain of Asn1025 in this orientation.
Apart from this, no conformational differences between MANT-ITP and
MANT-GTP are detected. However, MANT-ITP might exert stronger
hydrophobic interactions due to changes of the relative positions of
Trp1020 and the MANT group.
Fig. 5. Comparison of the binding of MANT-ITP and MANT-GTP by
molecular dynamics simulations. Overlaid graphical representations of
the terminal (t ⫽ 9.6 ns) time steps for the MANT-GTP (CPK-colored
sticks with green carbons and orange phosphorus atoms) and MANT-ITP
(CPK-colored sticks with cyan carbons and tan phosphorus atoms) interacting with the VC1:IIC2 receptor (pale green ribbons) and its cofactor
Mn2⫹ ions (magenta spheres for MANT-GTP simulation and purple for
MANT-ITP). Additional details on differences in the interactions of
MANT-GTP and MANT-ITP with VC1:IIC2 are provided in Supplemental Fig. 1 and Supplemental Tables 1 to 3.
cleotide inhibitors, where the base, triphosphate, and 2⬘,3⬘ribose substituents reside in three distinct grooves of the
substrate binding site (Mou et al., 2005, 2006). The overall
conformations of MANT-ITP and MANT-GTP show only minimal differences. This result is not surprising. The crystal
structures were derived with a racemic mixture of 2⬘-O- and
3⬘-O-MANT-ITP. Both structures favor the 3⬘-O-MANT isomer for binding to the catalytic center as shown with the
MANT-GTP and MANT-ATP crystals (Mou et al., 2005,
2006).
A very intriguing finding was the subtle difference in binding mode of MANT-ITP versus MANT-GTP at the purinebinding site in comparison with the exceptionally high inhibitory potency of the nucleotide. Usually, high inhibitory
potency is accomplished through strong binding of the inhibitor to the active site of the enzyme. In this case, there were
actually fewer protein-ligand interactions because of a missing hydrogen bond in hypoxanthine compared with guanine
(Figs. 1 and 3D). However, a gain in affinity is related not
only to the number of hydrogen bonds but also to hydrophobic
interactions, residual mobility of the ligand, and partial solvation of the binding pocket (Gohlke and Klebe, 2002). The
loss of hydrogen bonds does not necessarily lead to a decrease
in binding affinity of a ligand to a protein as assessed by
molecular thermodynamic and crystallographic studies of
thermolysin inhibitors (Morgan et al., 1991). Binding of those
inhibitors is dependent not only on hydrogen bonding but
also on metal coordination and higher ligand basicity (Grobelny et al., 1989). For binding of MANT-ITP, the absence of
the C(2) amino group eliminates a potential hydrogen bond
but at the same time reduces spatial constraints at the purine binding site, thereby allowing other protein-nucleotide
interactions to be optimized. Our crystallographic studies
and molecular dynamics simulations clearly show that positioning of the -oxygen of the triphosphate chain of MANTITP allows for more favorable interactions with Mn2⫹ than
the triphosphate chain of MANT-GTP, providing a straightforward explanation for the observed difference in affinity
(Figs. 3 and 5).
Direct fluorescence experiments and FRET studies detected stronger hydrophobic interaction of the MANT group
of MANT-ITP with the hydrophobic pocket compared with
that of MANT-GTP (Fig. 2). In contrast, binding of MANTXTP does not result in an increase in direct fluorescence or
FRET. Compared with MANT-ITP and MANT-GTP, MANTXTP is at least 60-fold less potent at VC1:IIC2 (Table 1).
MANT-XTP bears an oxygen at the C2-position of the purine
ring (Fig. 1) that interacts unfavorably with Asp1018 in the
base-binding pocket. This may move the MANT group away
from the hydrophobic pocket, leading to a strong decrease in
inhibitory potency and fluorescence emission. As suggested
for metal-phosphate interactions, alleviation of binding constraints at the purine-binding pocket may allow MANT-ITP
to form more favorable nonpolar interactions with the MANT
binding site than is possible for MANT-GTP, resulting in
larger fluorescence signals.
MANT-ITP is the most potent competitive inhibitor of
membranous ACs known so far (Table 1) (Göttle et al., 2009).
MANT-ITP is most useful as fluorescence probe for biophysical (Fig. 2) and crystallographic studies (Figs. 3 and 4) to
obtain detailed molecular information on ligand/receptor interactions. Another application of MANT-ITP is to use this
Crystal Structure of Adenylyl Cyclase with MANT-ITP
ligand in screening programs for the development of AC
inhibitors, avoiding the use of the classic radioactive AC
assay with [␣-32P]ATP as substrate. Specifically, upon binding to the substrate-binding site, nonfluorescent inhibitors
would quench the large basal or FS-stimulated direct fluorescence or FRET signals. This assay is even feasible to
obtain information on relative inhibitor affinity through the
analysis of cumulative concentration/quench curves in a single cuvette (Geduhn et al., 2011). Fluorescence assays with
MANT-ITP could also be useful to identify allosteric AC
inhibitors.
However, the usefulness of MANT-ITP per se as starting
point for the development of AC isoform-specific inhibitors,
particularly AC5 inhibitors for the treatment of heart failure,
aging, bone loss, anxiety, and acute and chronic pain (Chester and Watts, 2007; Rottlaender et al., 2007; Kim et al.,
2008; Okumura et al., 2009) is limited for several reasons.
First, MANT-ITP per se is membrane-impermeant and
would have to be delivered as a prodrug (Laux et al., 2004;
Hübner et al., 2011). Second, the selectivity of MANT-ITP for
AC5 relative to other AC isoforms is only very moderate
(Göttle et al., 2009), because the catalytic site of the membranous AC isoforms is highly conserved (Mou et al., 2005).
Third, one should also keep in mind that hypoxanthine-based
nucleotides bind not only to mACs but also to other signaltransducing proteins, including soluble guanylyl cyclase and
G-proteins (Seifert et al., 1999; Gille et al., 2003, 2004, 2005;
Hübner et al., 2011). Accordingly, pleiotropic effects unrelated to direct mAC inhibition could arise (Hübner et al.,
2011). Despite these reservations regarding MANT-ITP, the
long-term goal of obtaining isoform-specific AC inhibitors is
not elusive. Specifically, we have shown that certain bisMANT-substituted nucleotides are very potent inhibitors of
the Bordetella pertussis AC toxin CyaA (Geduhn et al., 2011),
with high selectivity relative to mammalian ACs. The identification of Bis-MANT nucleotides as potent and selective
CyaA inhibitors resulted from a relatively small medicinal
chemistry program and not from an extensive high-throughput screening effort. Unfortunately, Bis-MANT nucleotides
are not very potent inhibitors of mACs because the catalytic
site of these ACs is not spacious enough.
In conclusion, our data confirm the three-site pharmacophore model already postulated in previous studies (Mou et
al., 2005, 2006). Our data also show that small differences in
ligand structure can have a profound impact on interactions
with mAC. The one missing opportunity for hydrogen bonding in MANT-ITP relative to MANT-GTP enhances mobility
of the ligand in the catalytic site, thereby facilitating hydrophobic interactions of the MANT group with surrounding
amino acids and optimal positioning of the triphosphate
chain to divalent cations. Together, these factors result in
exceptionally high-affinity binding of MANT-ITP for mAC.
Acknowledgments
We thank the staff at the Stanford Synchrotron Radiation Lightsource SMB-MC 9-1 beamline (Stanford, CA) for their assistance
with data collection. Thanks are also due to the reviewers for a
helpful critique that stimulated us to resolve the mAC:MANT-ITP
crystal structure and to conduct molecular dynamics simulations.
95
Authorship Contributions
Participated in research design: Hübner, Dixit, Mou, Lushington,
Pinto, Gille, Geduhn, König, Sprang, and Seifert.
Conducted experiments: Hübner, Mou, Pinto, Gille, and Seifert.
Contributed new reagents or analytic tools: Geduhn and König.
Performed data analysis: Hübner, Dixit, Mou, Lushington, Pinto,
Gille, Geduhn, Sprang, and Seifert.
Wrote or contributed to the writing of the manuscript: Hübner,
Dixit, Mou, Lushington, Pinto, Gille, Geduhn, König, Sprang, and
Seifert.
References
Bashford D and Case DA (2000) Generalized Born models of macromolecular solvation effects. Annu Rev Phys Chem 51:129 –152.
Bradbrook GM, Gleichmann T, Harrop SJ, Habash J, Raftery J, Kalb J, Yariv J,
Hillier IH, and Helliwell JR (1998) X-ray and molecular dynamics studies of
concanavalin-A glucoside and mannoside complexes relating structure to thermodynamics of binding. J Chem Soc Faraday Trans 94:1603–1611.
Chester JA and Watts VJ (2007) Adenylyl cyclase 5: a new clue in the search for the
“fountain of youth”? Sci STKE 413:pe64.
Collaborative Computational Project Number 4 (1994) The CCP4 suite: programs for
protein crystallography. Acta Crystallogr D Biol Crystallogr 50:760 –763.
DeLano WL (2002) The PyMOL Molecular Graphics System, DeLano Scientific, San
Carlos, CA.
Emsley P and Cowtan K (2004) Coot: model-building tools for molecular graphics.
Acta Crystallogr D Biol Crystallogr 60:2126 –2132.
Geduhn J, Dove S, Shen Y, Tang WJ, König B, and Seifert R (2011) Bis-halogenanthraniloyl-substituted nucleoside 5⬘-triphosphates as potent and selective inhibitors of Bordetella pertussis adenylyl cyclase toxin. J Pharmacol Exp Ther
336:104 –115.
Gille A, Wenzel-Seifert K, Doughty MB, and Seifert R (2003) GDP affinity and order
state of the catalytic site are critical for function of xanthine nucleotide-selective
G␣s proteins. J Biol Chem 278:7822–7828.
Gille A, Lushington GH, Mou TC, Doughty MB, Johnson RA, and Seifert R (2004)
Differential inhibition of adenylyl cyclase isoforms and soluble guanylyl cyclase by
purine and pyrimidine nucleotides. J Biol Chem 279:19955–19969.
Gille A, Guo J, Mou TC, Doughty MB, Lushington GH, and Seifert R (2005) Differential interactions of G-proteins and adenylyl cyclase with nucleoside 5⬘triphosphates, nucleoside 5⬘-[ ␥ -thio]triphosphates and nucleoside 5⬘-[  , ␥ imido]triphosphates. Biochem Pharmacol 71:89 –97.
Gille A and Seifert R (2003) 2⬘(3⬘)-O-(N-methylanthraniloyl)-substituted GTP analogs: a novel class of potent competitive adenylyl cyclase inhibitors. J Biol Chem
278:12672–12679.
Gille A and Seifert R (2004) Xanthine nucleotide-specific G-protein ␣-subunits: a
novel approach for the analysis of G-protein-mediated signal transduction. Naunyn Schmiedebergs Arch Pharmacol 369:141–150.
Göttle M, Geduhn J, König B, Gille A, Höcherl K, and Seifert R (2009) Characterization of mouse heart adenylyl cyclase. J Pharmacol Exp Ther 329:1156 –1165.
Gohlke H and Klebe G (2002) Approaches to the description and prediction of the
binding affinity of small-molecule ligands to macromolecular receptors. Angew
Chem Int Ed Engl 41:2644 –2676.
Grobelny D, Goli UB, and Galardy RE (1989) Binding energetics of phosphoruscontaining inhibitors of thermolysin. Biochemistry 28:4948 – 4951.
Hiratsuka T (1983) New ribose-modified fluorescent analogs of adenine and guanine
nucleotides available as substrates for various enzymes. Biochim Biophys Acta
742:496 –508.
Hübner M, Dizayee S, Matthes J, Seifert R, and Herzig S (2011) Effect of MANTnucleotides on L-type calcium currents in murine cardiomyocytes. Naunyn
Schmiedebergs Arch Pharmacol. doi:10.1007/s00210-011-0626-x.
Jameson DM and Eccleston JF (1997) Fluorescent nucleotide analogs: synthesis and
applications. Methods Enzymol 278:363–390.
Kim KS, Lee KW, Baek IS, Lim CM, Krishnan V, Lee JK, Nestler EJ, and Han PL
(2008) Adenylyl cyclase-5 activity in the nucleus accumbens regulates anxietyrelated behavior. J Neurochem 107:105–115.
Laux WH, Pande P, Shoshani I, Gao J, Boudou-Vivet V, Gosselin G, and Johnson RA
(2004) Pro-nucleotide inhibitors of adenylyl cyclases in intact cells. J Biol Chem
279:13317–13332.
Morgan BP, Scholtz JM, Ballinger MD, Zipkin ID, and Bartlett PA (1991) Differential binding energy: a detailed evaluation of the influence of hydrogen-bonding and
hydrophobic groups on the inhibition of thermolysin by phosphorus-containing
inhibitors. J Am Chem Soc 113:297–307.
Mou TC, Gille A, Fancy DA, Seifert R, and Sprang SR (2005) Structural basis for the
inhibition of mammalian membrane adenylyl cyclase by 2⬘(3⬘)-O-(N-methylanthraniloyl)-guanosine 5⬘-triphosphate. J Biol Chem 280:7253–7261.
Mou TC, Gille A, Suryanarayana S, Richter M, Seifert R, and Sprang SR (2006)
Broad specificity of mammalian adenylyl cyclase for interaction with 2⬘,3⬘substituted purine- and pyrimidine nucleotide inhibitors. Mol Pharmacol 70:878 –
886.
Okumura S, Suzuki S, and Ishikawa Y (2009) New aspects for the treatment of
cardiac diseases based on the diversity of functional controls on cardiac muscles:
effects of targeted disruption of the type 5 adenylyl cyclase gene. J Pharmacol Sci
109:354 –359.
Onufriev A, Bashford D, and Case DA (2000) A modification of the generalized Born
model suitable for macromolecules. J Phys Chem B 104:3712–3720.
Otwinowski Z and Minor W (1997) Processing of X-ray diffraction data collected in
oscillation mode. Methods Enzymol 276:307–326.
96
Hübner et al.
Phillips JC, Braun R, Wang W, Gumbart J, Tajkhorshid E, Villa E, Chipot C, Skeel
RD, Kalé L, and Schulten K (2005) Scalable molecular dynamics with NAMD.
J Comput Chem 26:1781–1802.
Rottlaender D, Matthes J, Vatner SF, Seifert R, and Herzig S (2007) Functional
adenylyl cyclase inhibition in murine cardiomyocytes by 2⬘(3⬘)-O-(N-methylanthraniloyl)-guanosine 5⬘-[␥-thio]triphosphate. J Pharmacol Exp Ther 321:608 –
615.
Seifert R, Gether U, Wenzel-Seifert K, and Kobilka BK (1999) Effects of guanine,
inosine, and xanthine nucleotides on 2-adrenergic receptor/Gs interactions: evidence for multiple receptor conformations. Mol Pharmacol 56:348 –358.
Sunahara RK, Dessauer CW, and Gilman AG (1996) Complexity and diversity of
mammalian adenylyl cyclases. Annu Rev Pharmacol Toxicol 36:461– 480.
Suryanarayana S, Göttle M, Hübner M, Gille A, Mou TC, Sprang SR, Richter M, and
Seifert R (2009) Differential inhibition of various adenylyl cyclase isoforms and
soluble guanylyl cyclase by 2⬘,3⬘-O-(2,4,6-trinitrophenyl)-substituted nucleoside
5⬘-triphosphates. J Pharmacol Exp Ther 330:687– 695.
Taha HM, Schmidt J, Göttle M, Suryanarayana S, Shen Y, Tang WJ, Gille A,
Geduhn J, König B, Dove S, et al. (2009) Molecular analysis of the interaction of
anthrax adenylyl cyclase toxin, edema factor, with 2⬘(3⬘)-O-(N-methyl)anthraniloyl)-substituted purine and pyrimidine nucleotides. Mol Pharmacol 75:693–
703.
View publication stats
Tang WJ and Hurley JH (1998) Catalytic mechanism and regulation of mammalian
adenylyl cyclases. Mol Pharmacol 54:231–240.
Tesmer JJ, Sunahara RK, Fancy DA, Gilman AG, and Sprang SR (2002) Crystallization of complex between soluble domains of adenylyl cyclase and activated Gs␣.
Methods Enzymol 345:198 –206.
Tesmer JJ, Sunahara RK, Gilman AG, and Sprang SR (1997) Crystal structure of the
catalytic domains of adenylyl cyclase in a complex with Gs␣.GTP␥S. Science
278:1907–1916.
Wang JL, Guo JX, Zhang QY, Wu JJ, Seifert R, and Lushington GH (2007) A
conformational transition in the adenylyl cyclase catalytic site yields different
binding modes for ribosyl-modified and unmodified nucleotide inhibitors. Bioorg
Med Chem 15:2993–3002.
Wang JM, Wang W, and Kollman PA (2001) ANTECHAMBER: an accessory software package for molecular mechanical calculations. J Mol Graph 8:52–56.
Weiser J, Shenkin PS, and Still WC (1999) Approximate atomic surfaces from linear
combinations of pairwise overlaps (LCPO). J Comp Chem 20:217–230.
Address correspondence to: Dr. Roland Seifert, Institute for Pharmacology,
Medical School of Hannover, Carl-Neuberg-Strasse 1, D-30625 Hannover,
Germany. E-mail: seifert.roland@mh-hannover.de
Academia.edu no longer supports Internet Explorer.
To browse Academia.edu and the wider internet faster and more securely, please take a few seconds to upgrade your browser.
Structural Basis for the High-Affinity Inhibition of Mammalian Membranous Adenylyl Cyclase by 2′, 3′-O-(N-Methylanthraniloyl)-Inosine 5′-Triphosphate
Molecular …, 2011
...Read more
Related Papers
Biochemical Pharmacology, 2011
Download

Drug Metabolism and Disposition, 2007
Download

Journal of Pharmacology and Experimental Therapeutics, 2011
Download

Trends in Pharmacological Sciences, 2012
Download

Journal of Biological Chemistry, 2004
Download

Journal of Pharmacology and Experimental Therapeutics, 2009
Download
Molecular Pharmacology, 2009
Download

Molecular …, 2009
Download

Biochemical Pharmacology, 2005
Download

Naunyn-Schmiedeberg's Archives of Pharmacology, 2011
Download

Biochimica et Biophysica Acta (BBA) - Proteins and Proteomics, 2004
Download

Biochemistry Usa, 2010
Download

Bioorganic & Medicinal Chemistry, 2007
Download

Journal of Pharmacology and Experimental Therapeutics, 2008
Download
Naunyn-Schmiedeberg's Archives of Pharmacology, 2012
Download
