ADULT UROLOGY
PROSPECTIVE EVALUATION OF PROSTATE-SPECIFIC
ANTIGEN DENSITY AND SYSTEMATIC
BIOPSIES FOR EARLY DETECTION OF
PROSTATIC CARCINOMA
MICHEL BAZINET, M.D.
ALAA W. MESHREE M.D.
CLAUDE TRUDEL, M.D.
SAMUEL ARONSON, M.D.
FRANCOIS Pt~LOQUIN, M.D.
MAHMOUD NACHABE, M.D.
LOUIS R. BI~GtN, M.D.
MOSTAFA M. ELHILALI, M.D.
From the Departments of Urology and Pathology,
McGill University, Montreal, Quebec, Canada
ABSTRACT--Significant controversies persist in regard to the need for systematic biopsies in patients with serum prostate-specific antigen (PSA) levels above 4 ng/mL
(Hybritech assay), especially if they show no signs of prostatic cancer on digital rectal examination (DRE) or transrectal ultrasonography (TRUS). We evaluated 565 consecutive
patients referred to us for prostatism, suspicious lesions on DRE, or an elevated serum
PSA level. These patients do not represent a purely screened population. A detection
rate of 38.4 percent was achieved by performing directed biopsies of suspicious lesions
on DRE and/or TRUS, and systematic biopsies of all patients with serum PSA levels above
4 ng/mL. Among 142 patients with serum PSA between 4.1 and 10 ng/mL, but without
suspicion for cancer on DRE and TRUS (DRE- TRUS-), a large number of patients (6.2)
were subjected to systematic biopsies to detect one cancer. A receiver-operating characteristic curve for PSA density (PSAD) applied to this population confirmed that the best
cut-off point for biopsies was a PSAD of 0.15, below which only two of twenty-three cancers would have been missed, sparing biopsies in 77 of 142 patients. A similar approach
was applied to DRE- TRUS- patients with serum PSA levels above 10 ng/mL. The number of cancers in those with serum PSA between 10.1 and 14 ng/mL was too low to establish a PSAD cut-off point. In patients with serum PSA above 14 ng/mL, the best PSAD
cut-off point for biopsies was 0.3, below which two of thirteen cancers would have been
missed, sparing biopsies in 19 of 39 patients. We conclude that PSAD can safely reduce
the number of patients subjected to systematic biopsies without significantly compromising cancer detection.
The usefulness of mass screening for prostatic
carcinoma by any method is an issue of debate
and controversy. Improved prostate cancer detection among men who seek medical care is possible
by the rational use of digital rectal examination
(DRE) and prostate-specific antigen (PSA) measurement with transrectal ultrasonography of the
prostate (TRUS) used in selected cases. 1
Serum PSA is superior to DRE in its ability
to detect the possible presence of prostatic canSubmitted: April 28, 1993, accepted (with revisions): July 21,
1993
44
cer. 1,2 Since serum PSA levels can be increased by
benign prostatic hyperplasia, 3 researchers described the use of PSA density (PSAD = serum
PSA/prostate volume) as a potentially better predictor of prostate cancer. 4
Hodge et al. 5 reported that six systematic biopsies of the prostate, using transrectal ultrasound
guidance, could increase the detection rate of prostatic cancer, provide better estimation of tumor
volume and location, and allow more accurate
representation of the average Gleason grade of the
cancer. Theoretically, however, systematic biopsies
may detect clinically insignificant cancers, can still
UROLOGY / JANUARY1994 / VOLUME43, NUMBER1
�miss larger cancers and apply mainly to peripheral and central zone cancers. 5
Apparently, none of the presently used tests is a
perfect diagnostic procedure on its own. After
studying 2,634 patients, Cooner 6 constructed an
algorithm to serve as a practical guide for prostate
cancer detection in patients seeking urologic care.
He recommended performing six systematic biopsies in patients with serum PSA levels between 4.1
and 10 ng/mL only if their PSAD was _>0.15. Catalona, 7 however, recently suggested that all patients with s e r u m PSA levels above 4.0 n g / m L
should be subjected to systematic biopsies. To resolve this controversy, we prospectively performed
six systematic biopsies on 491 consecutive patients referred to us with serum PSA levels above
4 ng/mL,
MATERIAL AND METHODS
Between April 21 and November 9, 1992, we
examined 565 consecutive patients aged forty-one
to eighty-four years, by DRE, TRUS, and serum
PSA determination by the Hybritech assay (normal range 0-4 ng/mL). All patients were referred
to our center by their urologists for TRUS as part
of their clinical evaluation. The reasons for referral were prostatic symptoms, suspicious DRE, or
elevated PSA. It should be emphasized that these
patients entered via a urologic practice and do not
represent a purely screened population. Patients
previously d i a g n o s e d to have prostatic cancer
were excluded from the stud3a
Serum PSA was k n o w n before performing the
TRUS in all cases. DRE was systematically performed by the attending urologist just prior to
TRUS with the patient in the left lateral decubitus
position. The results were classified as either normal or suspicious. The prostate was considered to
be suspicious if it was diffusely hard, contained a
discrete firm to hard area, showed irregular contours or prominent lobe asymmetry.
All patients were prepared by Fleet enema a few
hours prior to TRUS. In addition, each of them
r e c e i v e d 400 m g n o r f l o x a c i n or 500 m g
ciprofloxacin twelve hours and one h o u r before
examination. Those who underwent biopsies continued the antibiotic for two additional days. All
TRUS examinations were performed in real time,
using a Bruel and Kjaer model 1846 scanner with
a 8551 m u l t i p l a n e probe (7 MHz transducer).
Each gland was examined in both axial and sagittal projections. Patients with palpable abnormalities were carefully examined by TRUS for corresponding lesions. Prostate volume was calculated
as follows: volume equals 0.52 x (length x width
UROLOGY / JANUARY1994
/ VOLUME 43, NUMBER 1
x height), with length being measured in the long i t u d i n a l view, a n d w i d t h a n d h e i g h t in the
transaxial view.
PSAD, a term suggested by Benson e t al., 4 was
c a l c u l a t e d by d i v i d i n g PSA ( m o n o c l o n a l , expressed in ng/mL) by prostate volume (expressed
in cubic centimeters). Final TRUS impressions
were classified as benign or suspicious for cancer.
The findings were considered to be suspicious if a
hypoechoic lesion 8 seen in the prostate could not
be explained by other factors (such as n o r m a l
anatomic areas, vascular structures, cysts, or artifacts). 1
Biopsies were taken with the Bard spring-driven
Biopty gun, using 18-gauge "Tru-cut" type biopsy
needles. All biopsies were performed under ultras o u n d guidance via the transrectal route on an
outpatient basis. In patients with serum PSA levels < 4 ng/mL, ultrasound-guided biopsies were
directed toward suspicious areas on the ultrasound image, or toward suspicious areas detected
by DRE by geographic c o o r d i n a t i o n (directed
biopsies). Systematic biopsies were not done in
this group of patients.
Any patient with a s e r u m PSA level above 4
ng/mL was subjected to six systematic biopsies,
with or without directed biopsies. The biopsies
were equidistant, three for each lobe: at the apex,
middle, and base of the prostate. With respect to
the coronal plane, the biopsy sites were oriented
in the center of each lobe, equidistant from the
midline of the prostate and the lateral border of
the lobe. The six cores were promptly placed in
separate bottles containing 10% buffered formalin
and were labeled accordingly to denote the six different sites. If a suspicious lesion was seen on
DRE and/or TRUS, one to three directed biopsies
were taken from the lesion, and the core(s) were
i n s e r t e d in the b o t t l e of the c o r r e s p o n d i n g
a n a t o m i c region. The cores were stained with
h e m a t o x y l i n and eosin. The same p a t h o l o g i s t
(L.R.B.) examined all slides. Each biopsy speci~
men was categorized histologically (normal tissue,
atrophic changes, acute or chronic inflammation,
prostatic intraepithelial neoplasia, or cancer), and
all cancers were graded according to the Gleason
scheme as a histologic score on a scale from 2 to
10. The percentage of cancer present in each core
was estimated within a 5 percent range,
The unpaired Student's t test was used (calculating 2-tail p values) to compare two means. The
sensitivity and specificity of the diagnostic tests
were calculated as described elsewhere. 9 The cutoff points were considered to be arbitrary values
separating positive from negative test results. The
45
�....... PSAD (0.813)
~
PSA (0.728)
TABLE I.
I
I
lOO
No. of
patients
No. of
patients
bit+psied
DRE/'RUS -
_<4
4.1 - 10
> 10
3i
142
89
0
142
89
23
20
(16.2)
(22.5)
6.2
4.5
DRE +
I"RUS -
-< 4
4.1 - 10
> 10
14
35
25
14
35
~5
1
12
15
(7.1)
(34,3)
(60,0)
14.0
2.9
1.7
DREI'RUS +
~4
4.1 - 10
> 10
8
33
36
8
33
36
1
10
19
(12.5)
(313.3)
(52.8)
8.0
3.3
1.9
ORE +
rRUS +
4
4.1 - I0
> 10
21
54
77
21
54
77
6
38
72
(28.6)
(70.4)
(93.5)
3.5
1,4
1.1
70.
g
so
,m
.>50,
4o.
¢/1
3020100
,i
0
.....
10
i,,,'/'l,,,',i,,,il
20
....
'i",i
,,
i,
, ,', i . . . .
30 40 50 60 70 80
False Positive Fraction (%)
I
90
(%)
No. of patients
biopsied to detect 1
with cancer
....
100
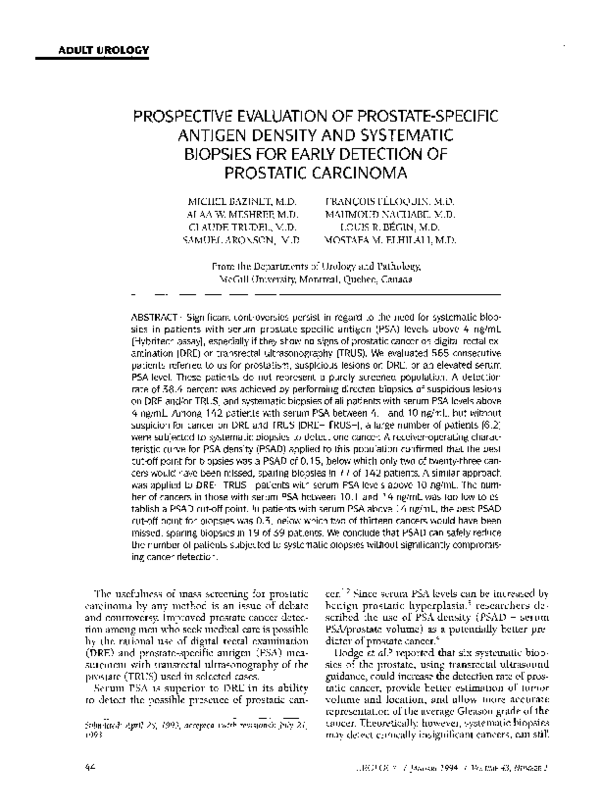
FIGURE 1.
ROC curve comparing PSAD and serum
PSA in all patients studied. Area under the curve is
given in parentheses with a perfect test having an area
of 1.0.
receiver-operator characteristic (ROC) curve is a
graphic plot of "sensitivity (%)" (true positive
fraction) on the Y axis versus "1 - specificity (%)"
(false-positive fraction) on the X axis at various
cut-off points. The better a test is, the closer is its
ROC curve to the upper left-hand corner of the
graph, where the true-positive rate is 1 and the
false-positive rate is 0. 9 To compare the Usefulness
of two different diagnostic tests for the same target disorder, the area u n d e r the corresponding
ROC curves is calculated and eomparedP We used
the Wilcoxon statistic as described by Hanley and
McNeil 1° to estimate the area u n d e r the ROC
curve together with its standard error, and we assessed whether the difference in areas under two
curves is random or real by calculating a Critical
ratio z. u Since the prevalence of prostatic cancer
in this population was not known, it was extrapolated from the biopsy results.
RESULTS
Of the 565 patients examined, biopsies were
performed in 534 subjects, with a biopsy rate of
94.5 percent. However, all 491 patients with a
serum PSA level above 4 ng/mL were subjected to
six systematic biopsies (with or without directed
biopsies) for a biopsy rate of 100 percent. Carcb
noma was found in 217 cases, yielding a detection
rate of 38.4 percent, and a positive biopsy rate of
40,6 percent.
46
No. of
cancers detected
PSA
(ng/ml)
9o.
80.
Overall results
I
A ROC curve was produced from the raw data
on all patients, for both PSA and PSAD (Fig. 1).
The areas under both curves were calculated, 1°
being 72.8 percent for serum PSA and 81.3 percent for PSAD, with a statistically significant difference between both areas (p < 0.0001).
The patients were divided into four main
groups: the first group without suspected cancer
on both DRE and TRUS (DRE- TRUS-); the second group with suspected cancer on DRE but
w i t h o u t suspicious findings on TRUS (DRE+
TRUS-); the third group without suspected cancer
on DRE b u t w i t h s u s p e c t e d c a n c e r on TRUS
(DRE- TRUS+); and the last group with suspected
cancer on both DRE and TRUS (DRE+ TRUS+).
Each group was further divided into three subgroups according to their serum PSA level: the
first with serum PSA ___4 ng/mL; the second with
serum PSA between 4.1 and 10 ng/mL; and the
last subgroup with serum PSA > 10 ng/mL. The
overall results are summarized in Table I,
DRE- TRUS-
This group was comprised of 262 patients, of
w h o m 31 had a serum PSA level N 4 ng/mL and
were not subjected to biopsies, The others underwent systematic biopsies: twenty-three cancers
were detected in 142 patients with serum PSA between 4.1 and i0 ng/mL, and twenty cancers were
found in 89 subjects with serum PSA above 10
ng/mL. ROC curves were produced from the raw
data on patientg with serum PSA levels between
4.1 and 10 ng/r~L (Fig. 2), above 10 ng/mL (Fig.
3), and above 14 ng/mL (Fig. 4). The curves illustrate the performance of various PSAD ratios in
these three different PSA ranges. As the number
UROLOGY / jANUARY1994 / VoLuME43, NUMBER1
�ioo
o15,,~
10o
o,o,j
902
o
90-
0.2
80i
80-
70:
70-
60-
60-
•~" 5o-:
.~ 50-
0.15
032 ,,~,~__j
0.46,~
( : ~
0.4
4o.
Ul
~" 40u~
ao2
30-
39 patients
20-
20-
10-
142 patients
10-
0
0
,,,i,
0
, , ~i,,,,i,,,,i,,,,I,,=,i,,,,i'~,,,
10
20
|, , ,, i,,,
30 40 50 60 70 80
False Positive Fraction (%)
90
100
ROC curve of PSAD in cases with serum
PSA levels between 4. I and 10 ng/mL (DRE- TRUS-).
F I G U R E 2.
r/
100
0 28
80
0.25
0a
"~
i
"%_["
0
7O
A
oas, , ~ /
60
> 50
~40.
30 -:
89 patients
20.
10.
0
~'''1''''1
10
....
20
I ....
I ....
I''''1
....
I''''1~''''1
30 40 50 60 70 80
False Positive Fraction (%)
'''I ' '
90
100
F I G U R E 3.
ROC curve of PSAD in cases with serum
PSA levels above I0 ng/mL (DRE- TRUS-).
of cancers detected in patients with serum PSA
between 10.1 and 14 ng/mL was small (7 cancers
out of 50 patients), a ROC curve for this PSA
range could not be drawn. The sensitivity and
specificity of PSAD varied according to different
cut-off points and different PSA ranges. Tables II,
III, and IV show the effect of changes in the PSAD
cut-off point on the test's sensitivity and specificity for patients with different PSA ranges.
UROLOGY / JANUARY1994 / VOLU~tE43, NUMBER 1
,,,i,,
0
lO
'1 . . . .
20
I''~'1
....
I''''1''''1''''1''''1''''
30 40 50 60 70 80
False Positive Fraction (%)
90
100
F I G U R E 4.
ROC curve of PSAD in cases with serum
PSA levels above 14 ng/mL (DRE- TRUS-).
DRE+ T R U S -
0.2
90
v
J
Among the 60 patients in this group with serum
PSA above 4 ng/mL, twenty-seven cancers (45%)
were diagnosed. Eighteen cases (66.7%) were positive for cancer exactly at the same site of suspicion by DRE; of these, 15 showed additional involvement with cancer by systematic biopsies in
other areas, 7 of which showed cancer in the contralateral side. Systematic biopsies detected the 9
other cases (33.3%) with cancer involvement in
areas other than those suspected by DRE. Cancer
was shown to be bilateral in 6 of these 9 cases,
Fourteen patients had serum PSA levels between
4,1 and 10 ng/mL and PSAD less than 0.15. All
three cancers in this subgroup were detected by
directed biopsies, while no additional patients
were found to have cancer by performing the systematic biopsies (Table V).
D R E - TRUS+
Among the 69 patients in this group with serum
PSA above 4 ng/mL, twenty-nine cancers (42%)
were diagnosed. Twenty-two of these twenty-nine
cancers (75.9%) were detected by directed biopsies, and twelve of them showed additional cancer
involvement by systematic biopsies in areas other
than the suspicious lesion. Seven other cancers
(24,1%) were detected by systematic biopsies
only; two of these were just beside the area of sus~
picion, while the remaining five were far from the
suspicious area and thus would definitely have
been missed without the systematic biopsies (e.g.,
47
�Effect of changes in PSAD cut-off
point in patients with serum PSA levels
between 4.1 and I0 ng/mL (DRE- TRUS-)
TABLE II.
I
Upper limit [ Patients
Patients
of PSAD
testing
testing
cut-off
positive
negative
point'
(potentially
saved
biopsies)
True
positives
(cancers
detected)
False
negatives
(cancers
missed)
Sensitivity Specificity
(%)
(%)
Effect of changes in PSAD cut-off
point in patients with serum PSA levels
above 14 ng/mL (DRE- TRUS-)
TABLE IV.
Upper limit
of PSAD
'cut-off
point'
Patients
testing
positive
Patients
testing
negative
(potentially
saved
biopsies)
True
positives
(cancers
detected)
False
negatives
(cancers
missed)
Sensitivity Specificity
(%)
(%)
0.00
142
0
23
0
100.0
0.0
0.00
39
0
13
0
100.0
0.0
0.05
139
3
23
0
100.0
2.5
0.10
37
2
13
0
100.0
7.7
0.10
112
30
22
1'
95.7
24.4
0.15
34
5
12
I*
92.3
15.4
0.13
80
62
22
1
95.7
51.3
0.20
29
10
12
1
92.3
34.6
0.14
72
70
21
2**
91.3
57.1
0.25
24
15
12
1
92.3
53.8
0.15
65
77
21
2
91.3
63.0
0.30
20
19
11
2**
84.6
65.4
0.16
55
87
19
4
82.6
69.7
0:35
15
24
8
5
61.5
73.1
0.17
49
93
17
6
73.9
73.1
0.40
73.1
*This case had a serum PSA value of 15.7 ng/mL, prostatic volume calculated by
0,20
81.5
*This case had a serum PSA value of 4.4 ng/mL, prostatic volume calculated by
TRUS was 52.4 cc, and thus the patient had a PSAD of 0.084. The Gleason histologic score of the tumor was 7. Four of the 6 cores were positive for cancer, which
involved 100 percent of one of the cores.
**The second case had a serum PSA value of 4.3 ng/mL, prostatic volume calculated by TRUS was 33 cc, and thus the patient had a PSAD of 0.13. The Gleason
histologic score was 4. One of the six cores was positive, with cancer involving only
10 percent of that core.
TRUS was 140 cc, and thus PSAD was 0.112. The Gleason histologic score of the
tumor was 7. One of the 6 cores was positive, with cancer involving less than 5 percent of that core.
**The second case had a serum PSA value of 62.1 ng/mL, prostatic volume'calculated by TRUS was 223 cc, and thus PSAD was 0.278. The Gleason histologic score
was 7. Two of the six cores were positive, with cancer involving 30 percent of both
cores.
Yield of systematic biopsies in
patients with cancer suspected on DRE
and~or TRUS with serum PSA levels
between 4.1 and 10 ng/mL
TABLE V.
Effect of changes in PSAD cut-off
point in patients with serum PSA levels
between 10. I and 14 ng/mL (DRE- TRUS-)
TABLE III.
Upper limit
of PSAD
'cut-off
point'
0,00
Patients
testing
positive
50
Patients
testing
negative
(potentially
saved
biopsies)
0
True
positives
(cancers
detected)
False
negatives
(cancers
missed)
0
0.10
48
2
0
0.15
42
8
O.20
33
0.25
23
0.30
Sensitivity Specificity
(%)
(%)
100.0
0.0
100.0
4.7
1"
85.7
16,3
17
2**
71.4
34.9
27
4
42.9
53.5
No. of
No. of
cancers
patients detected
No. of cancers
detected by directed
biopsies
No. of cancers
detected by systematic
biopsies only
DRE +
TRUS -
<0,15
_>0.15
14
21
3
9
3
5
DRETRUS +
< 0.15
_>0.15
14
19
0
10
0
0
8
2
DRE +
TRUS +
< 0.15
>_0.15
17
37
9
29
9
28
0
1
Total
<0.15
>_0.15
45
77
12
48
12
41
0
4
69.8
*This case had a serum PSA value of 12 ng/mL, prostatic volume calculated by
TRUS was 90.5 cc, and thus PSAD was 0.133. The Gleason histologic score of the
tumor was 6. Four of the 6 cores were positive for cancer, which involved more
than 50 percent of all cores.
**The second case had a serum PSA value of 11.25 ng/mL, prostatic volume calculated by TRUS was 75 cc, and thus PSAD was 0.15. The Gleason histologic score
was 5. One of the six cores was positive, with cancer involving less than 5 percent
of that core.
/+8
PSAD
in 1 case, the right base was the area of suspicion,
but the left apex was the area involved with cancer). No cancer was detected ill 14 patients with
serum PSA between 4.1 and 10 ng/mL and PSAD
less than 0.15 (Table V).
UROLOGY / JANUARY•994
/ VOLUME43, NUMBER 1
�DRE+ TRUS+
Among the 131 patients in this group with
serum PSA above 4 ng/mL, one hundred ten cancers (84%) were diagnosed; of these, one hundred
five (95.5%) were found by directed biopsies and
sixty-three of them showed additional cancer involvement by systematic biopsies in other areas.
Five other cases (4.5%) were diagnosed by systematic biopsies alone; 4 of these were positive for
cancer just beside the area of suspicion, and 1 was
positive for cancer far from the area of suspicion.
Seventeen patients had serum PSA between 4.1
and 10 ng/mL and a PSAD less than 0.15. All nine
cancers in this subgroup were detected by directed biopsies, while no additional patients were
found to have cancer by performing the systematic biopsies (Table V).
In the whole population, systematic biopsies
were the only method of detecting carcinoma in
64 cases (29.5% of d e t e c t e d cancers). T h e y
showed additional areas involved with cancer
other than those revealed by directed biopsies in
90 cases (41.5% of detected cancers).
In comparing cancers found by systematic biopsies with those detected by directed biopsies, there
was no significant difference in serum PSA levels
(p = 0.114). The PSAD of cancers diagnosed by
directed biopsies had a mean (_+ S.D.) of 0.71 __.
0.97, while those detected by systematic biopsies
had a mean of 0.43 _ 0.48, showing a statistically
significant difference between both groups (p =
0.032). Cancers found by systematic biopsies had
a mean Gleason histologic score of 5.6 _+ 1.9,
while those diagnosed by directed biopsies had a
mean of 6.5 __. 1.5, representing a statistically significant difference (p = 0.0003). The percentages
of cancers with a Gleason histologic score > 7
were 36.7 percent in cases detected by systematic
biopsies, and 57.7 percent in those found by directed biopsies. It should be noted, however, that
only 21.9 percent of cancers diagnosed by systematic biopsies were palpable, as compared with 85
percent of those detected by directed biopsies.
The mean Gleason histologic score for palpable
cancers was 6.6 _ 1.5, while that of impalpable
cancers was 5.6 + 1.7, with a statistically significant difference between both groups (p = 0.0001).
Of the palpable cancers, 60 percent had a Gleason
histologic score >_ 7, as compared with 34.8 percent in cases of impalpable cancers.
Six transition zone cancers were detected (2.8%)
by biopsies directed toward suspicious areas in
the transition zone. Their Gleason histologic
scores ranged from 3 to 9 with a mean of 5.5 _+
2.2, their serum PSA levels ranged from 4.6 to 48
UROLOGY / JANUARY1994 / VOLUME43, NUMBER 1
ng/mk with a mean of 19.3 _+ 15.0 ng/mk, and
their PSAD ratios ranged from 0.23 to 0.88 with a
mean of 0.61 _+0.29.
Prostatic intraepithelial neoplasia (PIN) without
associated cancer was diagnosed in 46 patients
(8.6% of biopsies), 8 of which were of high grade.
Their serum PSA levels ranged from 0.3 to 26.5
ng/mL with a mean of 8.4 +--4.9, and their PSAD
ratios ranged from 0.01 to 0.41 with a mean of 0.2
+_0.1. PIN was associated with cancer in 59 cases
(27.2% of cancers detected). Their serum PSA levels ranged from 4.4 to 80.8 ng/mL with a mean of
16.3 _+ 15.3, and their PSAD ratios ranged from
0.1 to 3.0 with a mean of 0.5 +_0.5. Patients with
PIN alone had significantly lower serum PSA levels and PSAD ratios than those with PIN associated with cancer (p = 0.001 and p = 0.0004, respectively), but similar to those with other benign
pathologies (p -- 0.6 and p = 0.98, respectively).
COMMENT
Our study cannot be considered to represent the
result of routine screening for prostatic carcinoma, since all patients were referred to our center by urologists. However, it might help us to develop guidelines that could be used clinically in
the early diagnosis of prostatic cancer, and could
possibly assist in avoiding a significant number of
biopsies.
Studies by Cooner et al., in which all patients
underwent DRE, serum PSA determination, and
TRUS, provided comprehensive data supporting
the value of integrating serum PSA and DRE as
primary measures in any early detection program,
being supplemented by TRUS in selected cases.l,12
It should be emphasized, however, that Cooner et
al. only performed biopsies of suspicious lesions
on DRE and/or TRUS. Other studies suggest that
more cancers would probably have been detected
had systematic biopsies been performed on every
patient with elevated serum PSA levels. 13 In 1992,
Catalona 7 proposed that all patients with serum
PSA above 4 ng/mL should be subjected to systematic biopsies. To test Cooner's algorithm for
the early detection of prostatic cancer, 6 and to
evaluate Catalona's suggestion, 7 we prospectively
performed systematic biopsies in all patients with
serum PSA above 4 ng/mL, together with directed
biopsies of suspicious lesions.
By comparing areas under the ROC curves for
serum PSA and PSAD in all patients, it was found
that PSAD was a superior diagnostic tool for the
detection of prostatic carcinoma.
In the DRE- TRUS- patients with serum PSA
between 4.1 and 10 ng/mL, the ROC curve for
49
�PSAD (Fig. 2) indicates a cut-off point of approximately 0.15 in this PSA range. This is equivalent
to the cut-off point suggested by Cooner, 6 below
which he does not r e c o m m e n d performing systematic biopsies. However, it should be noted that
Cooner's choice of 0.15 was based on directed
biopsies in groups of patients with either suspicious DRE and/or TRUS. Only then did he apply
his hypothesis to those with no suspicious findings on DRE and TRUS. He could not evaluate the
group of interest (DRE- TRUS-) directly, as no
biopsies were performed on these patients in his
earlier studies. 1,4,12 Therefore, in our investigation,
we systematically performed systematic biopsies
on every patient in this group to assess the real
value of PSAD. The data in Table II show that if
we had limited systematic biopsies in the DRETRUS- group to patients with a PSAD > 0.15, we
would have missed two cancers. This would have
resulted in a detection rate of 14.8 percent instead
of 16.2 percent, but only 3.1 patients would have
required biopsies to find 1 with cancer as compared with 6.2. This would have spared biopsies
in many patients (77 of 142 in our study) with a
negligible decrease in the cancer detection rate.
In patients with cancer suspected on DRE and/or
TRUS with serum PSA levels between 4.1 and 10
ng/mL and with a PSAD below 0.15, all carcinomas were detected by directed biopsies (12 cancers of 45 patients) (Table V). Although systematic biopsies did not detect any additional patients
with cancer, they showed bilateral involvement of
the prostate in 4 of the 12 patients. This additional information might be important in patients
who would be candidates for subsequent nervesparing prostatectomy.
The data in Table V show that TRUS did not reveal any cancer in 14 patients with a serum PSA
between 4.1 and 10 ng/mL, in the absence of positive findings on the DRE and with a PSAD < 0.15.
This suggests that hypoechoic lesions have a very
low specificity and are of questionable value
under these conditions.
Essentially, all authors agree that patients with
serum PSA levels above 10 ng/mL require systematic biopsies. In DRE- TRUS- patients with serum
PSA levels above 10 ng/mL, 4.5 required biopsies
to find one cancer for a detection rate of 22.5 percent (Table I). In the other three groups, the detection rate was higher, and less patients required
biopsies to find one cancer. We tried to assess the
value of PSAD in D R E - TRUS- patients w i t h
serum PSA levels above 10 ng/mL, to see if the
n u m b e r of patients requiring biopsies could be
safely decreased without jeopardizing cancer de50
tection. By drawing a ROC curve for PSAD in this
group (Fig. 3), the best cut-off point was 0.3, but
if applied to all patients in the group, six of
twenty cancers would have been missed, sparing
biopsies in 53 of 89 patients. In this case, 2.6
cases would have required systematic biopsies to
find one cancer instead of 4.5, but the detection
rate would drop to 15.7 percent instead of 22.5
percent.
If we exclude patients with serum PSA between
10.1 and 14 ng/mL, and draw another ROC curve
for PSAD in those with serum PSA levels above 14
ng/mL (Fig. 4), the best cut-off point is also 0.3.
In this situation, two of thirteen cancers would
have been missed, sparing biopsies in 19 of 39 patients, reducing the number of patients requiring
biopsies to find one cancer from 3 to 1.8, and decreasing the detection rate from 33.3 percent to
28.2 percent (Table IV).
As the number of cancers diagnosed in patients
w i t h s e r u m PSA levels b e t w e e n 10.1 and 14
ng/mL was small (7 cancers of 50 patients), no
proper ROC curve could be drawn for the PSAD
ratios. Table III shows the n u m b e r of biopsies
spared and cancers missed for the different PSAD
cut-off points. It indicates that at a PSAD of 0.2,
two cancers would have been missed and biopsies
spared in 17 patients. As the number of cancers
detected in this category was small, more cases are
needed to conclude if there is any value of a PSAD
cut-off point in this serum PSA range.
Our results are based on a single set of systematic biopsies. It is probable that we would detect
more cancers if systematic biopsies were repeated 7
in patients with serum PSA levels above 10 ng/mL
who had a non-malignant result from the first set
of biopsies. This evaluation is presently underway.
Systematic biopsies were the only method of detecting cancer in 29.5 percent of the malignant
cases. They added further information to the diagnosis in 41.5 percent of cases in which cancer was
found with directed biopsies, by showing multifocal lesions.
Regarding the clinical significance of cancers
detected by systematic biopsies, there appeared to
be a significantly lower Gleason histologic score
in this group as compared with cancers diagnosed
by directed biopsies (p = 0.0003). However, this
may be due to the fact that most of the cancers
detected by directed biopsies were digitally palpable, while most of those found by systematic biopsies were impalpable. On comparing palpable with
impalpable cancers, the Gleason histologic score
was significantly higher for the palpable cancers
(p = 0.0001). On comparing Gleason histologic
UROLOGY / JaNuaeY 1994 / VOLUME43, NUMBER1
�scores of i m p a l p a b l e cancers only, there w a s n o
statistically s i g n i f i c a n t difference b e t w e e n t h o s e
d e t e c t e d b y s y s t e m a t i c biopsies a n d those f o u n d
b y directed biopsies (p = 0.85). This m a y be related to the fact that palpable cancers have a larger
v o l u m e t h a n i m p a l p a b l e c a n c e r s ) H o w e v e r , this
issue c o u l d n o t be a d d r e s s e d in o u r s t u d y as the
patients w e r e referred to o u r center b y several different urologists, a n d the data are n o t c o m p l e t e reg a r d i n g p a t i e n t m a n a g e m e n t a n d t u m o r size in
radical p r o s t a t e c t o m y s p e c i m e n s (if done).
W e d i d n o t u s e s y s t e m a t i c b i o p s i e s in an att e m p t to detect transition z o n e cancers. 5 T h e six
(2.8%) transition z o n e cancers d i a g n o s e d in o u r
s t u d y w e r e all f o u n d b y d i r e c t e d biopsies. T h i s
low yield of transition z o n e t u m o r s is similar to
that r e p o r t e d b y o t h e r investigators.1
CON CLUSION
As a result of o u r study, we c o n c l u d e that PSAD
is a useful diagnostic tool for the early detection
of prostatic c a r c i n o m a . In the D R E - T R U S - g r o u p
of p a t i e n t s w i t h a PSA r a n g e b e t w e e n 4.1 a n d 10
ng/mL, o u r data s u p p o r t the n o t i o n that s y s t e m atic biopsies can be safely limited to cases w i t h a
PSAD > 0.15. Patients n o t s u b j e c t e d to s y s t e m a t i c
biopsies s h o u l d be followed to search for a n y potentially u n d i a g n o s e d cancers. In patients in the
s a m e PSA r a n g e w i t h c a n c e r s u s p e c t e d o n DRE
a n d / o r TRUS a n d w i t h a PSAD < 0.15, s y s t e m a t i c
biopsies did not detect any additional patients
w i t h cancer, however, they are useful in d e t e r m i n ing if c a r c i n o m a exists o n the o p p o s i t e side.
O u r data s u g g e s t t h a t in p a t i e n t s w i t h s e r u m
PSA levels a b o v e 14 n g / m L a n d w i t h o u t s u s p e c t e d
cancer o n b o t h DRE a n d TRUS, s y s t e m a t i c b i o p sies c o u l d b e safely limited to those w i t h a PSAD
o f _> 0.3. H o w e v e r , c l i n i c a l j u d g m e n t m a y b e
n e e d e d in i n d i v i d u a l cases. A larger s t u d y is req u i r e d before this a p p r o a c h c o u l d b e c o n s i d e r e d
for a d o p t i o n . In p a t i e n t s w i t h s e r u m PSA levels
b e t w e e n 10.1 a n d 14 n g / m L , the role of PSAD
c o u l d n o t be evaluated due to the small n u m b e r of
cancers detected in this category in o u r investigation.
Michel Bazinet, M.D.
Department of Urology
The Montreal General Hospital
1650 Cedar Avenue
Montreal Quebec H3G 1A4
Canada
REFERENCES
1. Cooner WH, Mosley BR, Rutherford CL Jr, Beard JH,
Pond HS, Terry WJ, Igel TC, and Kidd DD: Prostate cancer
UROLOGY / JANUARY•994 / VOLUMe43, NUM13~R1
detection in a clinical urological practice by ultrasonography,
digital rectal examination and prostate specific antigen. J Urol
143: 1146-1154, 1990.
2. Catalona WJ, Smith DS, Ratliff TL, Dodds KM, Coplen
DE, Yuan JJJ, Petros JA, and Andriole GL: Measurement of
prostate-specific antigen in serum as a screening test for
prostate cancer. N EnglJ Med 324: 1156-1161, 1991.
3. Stamey TA, Yang N, Hay AR, McNealJE, Freiha FS, and
Redwine E: Prostate-specific antigen as a serum marker for
adenocarcinoma of the prostate. N Engl J Med 317: 909-916,
1987.
4. Benson MC, Whang IS, Olsson CA, McMahon DJ, and
Cooner WH: The use of prostate specific antigen density to
enhance the predictive value of intermediate levels of serum
prostate specific antigen. J Urol 147: 817-821, 1992.
5. Hodge KK, McNeal JE, Terris MK, and Stamey TA:
Random systematic versus directed ultrasound guided transrectal core biopsies of the prostate. J Urol 142: 71-75, 1989.
6. Cooner WH, Babaian RJ, and Bostwick DG: Prostate
cancer detection using DRE, prostate specific antigen and
prostate-ultrasonography. Postgraduate Course #77, AUA Annual Meeting (24A), Washington, DC, May 14, 1992.
7. Catalona WJ: Prostate specific antigen as a screening
test for prostate cancer. State of the Art Lecture. AUA Annual
Meeting (63A), Washington, DC, May 10, 1992.
8. Lee F, Gray JM, McLeary RD, Meadows TR, Kumasaka
GH, Borlaza GS, Straub W, Lee F Jr, Solomon MH, McHugh
TA, and Wolf RM: Transrectal ultrasound in the diagnosis of
prostate cancer: location, echogenicity, histopathology, and
staging. Prostate 7: 117-129, 1985.
9. Evaluating diagnostic procedures, in Dawson-Saunders
B, and Trapp RG (Eds): Basic and Clinical Biostatistics, East
Norwalk, Appleton and Lange, 1990, chapt 13, pp 229-244.
10. Hanley JA, and McNeil BJ: The meaning and use of
the area under a receiver operating characteristic (ROC)
curve. Radiology 143: 29-36, 1982.
11. Hanley JA, and McNeil BJ: A method of comparing
the areas under receiver operating characteristic curves derived from the same cases. Radiology 148: 839-843, 1983.
12. Cooner WH: Prostate specific antigen, digital rectal
examination, and transrectal ultrasonic examination of the
prostate in prostate cancer detection. Monogr Urol 12: 3-13,
1991.
13. Vallancien G, Prapotnich D, Veillon B, Brisset JM, and
Andre-BougaranJ: Systematic prostatic biopsies in 100 men
with no suspicion of cancer on digital rectal examination. J
Urol 146: 1308-1312, 1991.
EDITORIAL COMMENT
The diagnosis of prostatic carcinoma rests entirely on microscopic tissue analysis. Suspicion that cancer may exist
comes from abnormal physical findings, elevated serum
markers, or abnormalities seen with imaging modalities. All
of these suffer from low specificity. Suspicious digital rectal
examination (DRE) findings almost always lead to biopsy.
The advent of serum prostate-specific antigen (PSA) and
transrectal ultrasonic examination of the prostate (TRUS) introduces the question as to which patients need biopsy
should either of these be abnormal.
Even if all available diagnostic tests were used, it would be
impossible to detect every prostatic carcinoma, including
those that would be destined to become clinically significant.
Use of TRUS without DRE or PSA abnormality adds little if
biopsy is directed only at visually suspicious areas. Because of
the high prevalence of prostatic carcinoma in men over age
51
�
 Francois Peloquin