Fungicides are irreplaceable tools in contemporary agriculture, protecting crops from fungal pathogens threatening productivity and food security.
Fungicides are commonly utilized in industrial, agricultural, and various home and gardening applications.
The majority of fungicides are applied to control fungal pathogens found on crops or utilized following harvest as a treatment that prevents mold or fungi from rotting the food throughout storage or transportation. They have become crucial in food protection and crop maintenance as a way to ensure consistent yields of high-quality products.
The Italian report “INAIL Research Notebook n.17” states that fungicides represent more than 52 % of all plant protection products utilized in the European Union.
Contact fungicides are sprayed onto plants, binding to the surface of the leaf. As opposed to systemic fungicides, where the roots and leaves absorb the fungicide through the cuticle which spreads it throughout the plant tissues, contact fungicides offer localized protection. Understanding the spatial distribution of fungicides on treated plant surfaces is crucial for efficacy optimization.
Laboratory technicians are able to use a treatment-exposed leaf to complete a direct analysis on the treated surface and decide the distribution of the applied fungicide.
To protect plant structures from potential damage created by the vacuum and the electron beam inside the Scanning Electron Microscope chamber, some sample preparation care is required. The Coxem Cool Stage accessory enables the freezing of the leaf sample and the performance of the SEM analysis with no additional treatments.
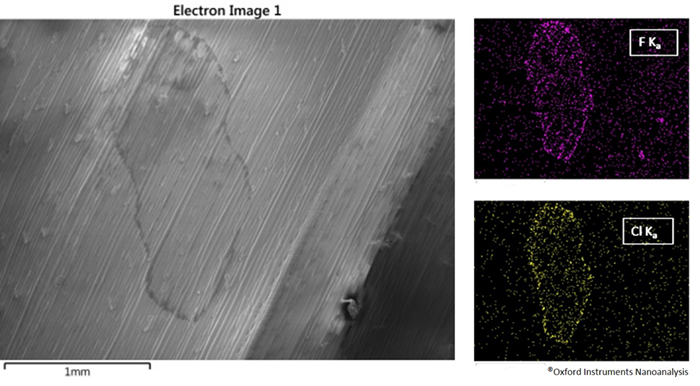
Figure 1. Fungicide-treated leaf with associated EDS maps. Image Credit: Oxford Instruments Nanoanalysis
In Figure 1, a wheat leaf has been exposed to a combination of two fungicides, one with Isopyrazam as the active ingredient (which contains fluorine), and the second on Ciproconazole which contains chlorine. The distribution of fungicides on the surface of the leaf can be analyzed by performing EDS elemental maps, which reveal the locations of elements aligned with each fungicide.
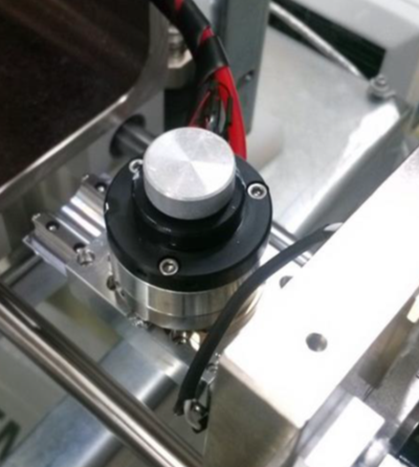
Figure 2. Cool Stage installed on the EM-30 Tabletop SEM. Image Credit: COXEM Co. Ltd.
To enable direct study of the fungicide distribution on the surface of the leaf, the leaf portion was frozen using the Cool Stage. Freezing stabilizes the leaf structure for vacuum analysis, and affixes the fungicide in situ.
As the two fungicides are rich in a specific element, the fluorine EDS map indicates the locations covered by Isopyrazam, while the chlorine EDS map indicates the locations accessed by Cyproconazole.
Although the sample is frozen, it remains vulnerable to potential damage from the high-energy electron beam used to scan the surface and generate the X-ray signal. Using a low accelerating voltage (e.g., 10 kV) mitigates this risk but also reduces the intensity of the generated X-ray signal. The solution is to extend the acquisition times of EDS maps, finding the optimal balance to achieve maps with decent resolution without damaging the sample.
To analyze this type of sample, and for general analyses where low count number are expected, it is recommended to choose EDS SDD detectors with a wide collection window and solid angle, which enable low acceleration voltages that also maintain low acquisition times.
Acknowledgments:
Coxem thanks Media System Lab for providing access to SEM facilities and technical support during the duration of this study.


This information has been sourced, reviewed and adapted from materials provided by COXEM Co. Ltd.
For more information on this source, please visit COXEM Co. Ltd.