Abstract
This study applies the BRIC – Baseline Resilience Indicator for Communities – as a case study to the city of Porto Alegre. The purpose of quantifying resilience is to allow the identification of the constraints of that city considering its 17 participatory budgeting regions to increase resilience over time. Utilizing five TOC focusing steps is suggested so that the identified constraints may be exploited and “broken” effectively. At the end, three significant constraints were identified, which lead to the conclusion that there is room for improvement in the city and in the adequacy of the tool regarding the proposed case, enabling further research opportunities.
1 Introduction
Government officials and the citizens they serve face a daunting challenge caused by rising rates of risk and uncertainty: ensuring the continued safety and vitality of the municipalities and regions where they live and work. A key way scholars and practitioners study this challenge is by assessing localities resilience – their ability to return to an acceptable operating condition after suffering a disruption caused by a given event (Starr et al. 2003; Seville et al. 2008; Bhamra et al. 2011). Communities that are more resilient are better able to accommodate internal or external change than those that are less resilient. The practical challenges lie in understanding the constraints for resilience and creating reliable, repeatable measures for each factor to enable the development of sound priorities for action.
This paper applies a tailored version of one such set of measures – the Baseline Resilience Indicators for Communities (BRIC) – to an integrated case study (Yin 2013, informed by Dyer and Wilkins 1991) of 17 contiguous municipal entities in order to identify its constraints for resilience. Following BRIC application, the theory of constraints’ (TOC) focusing steps are utilized to suggest actions to “break” those constraints and increase resilience. Therefore, the paper’s objective is to identify the constraints for resilience of each municipality to support centralized resource allocation decisions to increase the city’s resilience as a whole.
Although the term “resilience” has a broad application in several research fields such as ecology (Pickett et al. 2014), sociology (Arnall 2015), psychology (Masten 2001) and engineering (Hollnagel, Woods, and Leveson 2006), Weichselgartner and Kelman (2014) argue that resilience is not an accepted and universally defined term. Government views also diverge on this subject, considering it alternatively a process, a state or a quality. Similarly, Gibson and Tarrant (2010) posit that there is a lack of clarity in its basic concepts. The lack of consensus on the subject is reflected in the difficulty of quantifying urban resilience. In addition, the qualitative nature of the topic makes a precise quantification even more complex (Frazier et al. 2013). Even so, Frazier et al. (2013) state that recent research has emphasized the importance of measuring urban resilience in order to estimate a baseline measurement and to monitor the progress of improvements that aim to increase it.
Desouza and Flanery (2013) suggest that it is necessary to measure the various components of a city so that urban resilience can be achieved. Such components may be physical (physical resources and processes) or social (human elements that interact with the city) (Desouza and Flanery 2013). It can be argued, then, that urban resilience as a whole comprises measurements of components that are part of a city or a specific location. However, the components of a city may also become constraints. There may be, for example, resource constraints (Woods 2015), social (or behavioral) constraints (Marshall and Marshall 2007), infrastructure constraints (Christopherson, Michie, and Tyler 2010), among others. Articulating the Theory of Constraints’ point of view, Goldratt (1988, p. 453) states that a constraint is “anything that limits a system from achieving higher performance versus its goals.” Similarly, considering components (variables) and constraints, Boin, Comfort, and Demchak (2010, p. 10) state: “if resilience can be engineered into social systems, research should be focused on identifying the variables, strategies, and constraints that can help bring this about.”
Despite difficulties, several indicators have been developed in order to quantify urban resilience, for example disaster resilience scorecard for cities (DRSC) (UNISDR 2015), community resilience index (CRI) (Norris et al. 2008; Sherrieb, Norris, and Galea 2010) and baseline resilience indicators for communities (BRIC) (Cutter, Burton, and Emrich 2010; Cutter, Ash, and Emrich 2014). Each indicator has a unique approach to the concept, the view on urban resilience and the proposed method to measure it. Due to the low implementation costs, the possibility of applying it to a wide area over time, the level of maturity of the tool (Stevenson et al. 2015) and its adaptability to different locations, the BRIC indicator is the focus of this study.
The city of Porto Alegre was chosen for the empirical application of the tool. The Brazilian city is the capital of Rio Grande do Sul state. In 2010, it had approximately 1.4 million people (IBGE 2010). The city implemented in 1989 the participatory budgeting (PB) policy. Since then, 17 participatory budgeting regions were created within the municipality. The PB can be defined as “[...] a different way to manage public money, and to engage people in government. It is a democratic process in which community members directly decide how to spend part of a public budget. It enables taxpayers to work with government to make the budget decisions that affect their lives.” (Participatory Budgeting Project 2016).
Since the implementation of the participatory budgeting policy in Porto Alegre many improvements were identified throughout the whole city, which is known for building public policies that nurture open dialogs, respect and solidarity, strategically planning the city’s area and its communities. The objectives of the participatory budgeting in Porto Alegre are to overcome of the harshest social inequality problems within the city’s population and to promote of the city due to its social participation in the public administration strategic process.
Amongst the main improvements resulting from Porto Alegre’s PB policies are the improvements in the infrastructure of the poorest areas of the city, the improvement of public transportation, the improvement in the quality of life of the citizens and the increase in the levels of satisfaction of the city’s population related to basic needs. In this sense, Porto Alegre’s success evaluate the PB has been acknowledged internationally and adapted to other cities around the world. The participatory budgeting policy has expanded through hundreds of Latin American cities and dozens of cities from Europe, Asia, Africa and North America (Programa de Cidades Sustentáveis 2016).
After a contextualization, the setting and a brief conceptualization of urban resilience and the theory of constraints, the paper is segmented into sections comprising theoretical framework, research method, analysis of results, discussion of results and conclusion. In the theoretical framework, the conceptual basis of the work is presented based on a literature review of the relevant topics. The research method is presented in order to describe the research strategy used. Then, results are presented and analysed, and the concepts and tools studied are applied – discussion of the results. Finally, ethe authors present some limiting factors, suggest future research and evaluate the knowledge generated by the study.
2 Literature Review
The literature review section seeks to discuss developed studies and future research possibilities (Souza et al. 2013). In order to understand the concepts of urban resilience and the theory of constraints, a theoretical framework on the subjects studied is presented in this section. First, urban resilience in general is discussed. Then, specifically, BRIC is defined and explained. Finally, the theory of constraints, its concepts and applications related to public administration are discussed.
2.1 Urban Resilience
Overall, resilience, in the context of cities, “[...] refers to the ability to absorb, adapt and respond to changes in an urban system” (Desouza and Flanery 2013, p. 89). Resilience becomes important for cities when they become exposed and vulnerable to disruptive events caused by changes in their environment. An example is the increased risk of flooding due to climate changes caused by rising levels of urbanization and industrialization in certain cities (Dieleman 2013; Bambara et al. 2015). In addition to climate changes and environmental issues, urban resilience is also studied from other points of view, addressing topics such as urban security, economy, anti-terrorism, natural disasters and others (Vale 2014).
Although most studies on urban resilience are linked to environmental sustainability issues such as climate change and its impact on cities (Hudson 2010), Desouza and Flanery (2013) identify four categories of stressors to which cities need to develop resilience: natural, technological, economic and human stressors. In addition, Desouza and Flanery (2013) suggest that, for a city to be resilient, it is necessary to know and have the ability to understand the components of the four categories of stressors and their interconnections. In general, components can be segmented into physical and social spheres. The physical components are structures and processes within the limits and the control of a city. The social sphere comprises people, institutions (group of individuals working together for a common objective) and activities (designed and performed by individuals and institutions) (Desouza and Flanery 2013). Figure 1 shows the components of cities and their interactions, stressors and the types of damage caused by them.
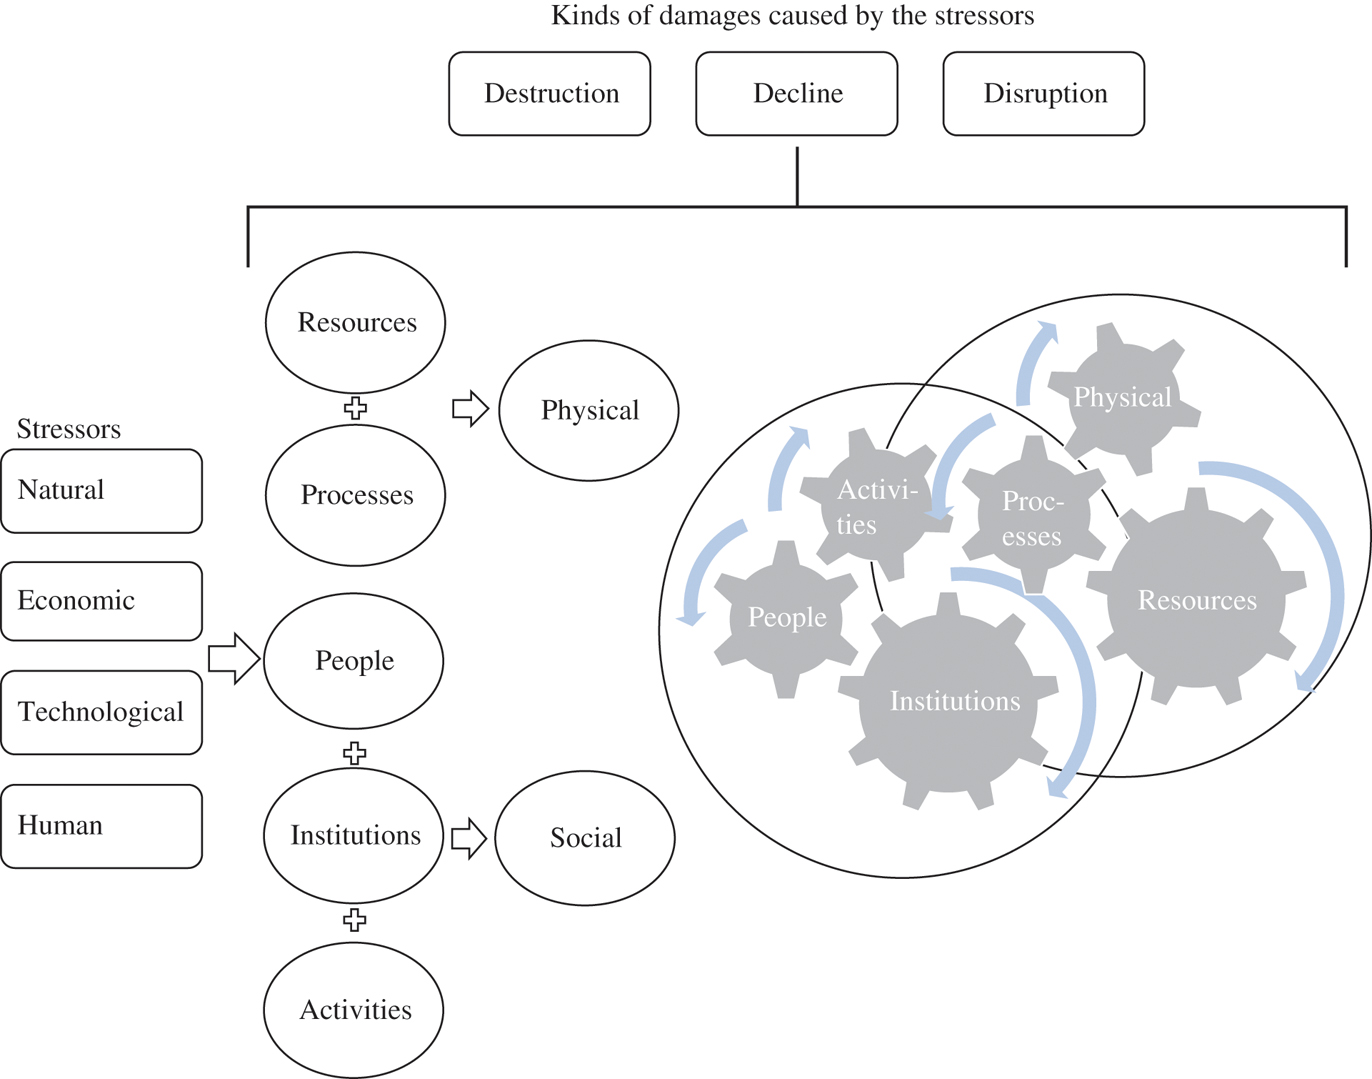
Cities, Components and Stressors.
Source: Adapted From Desouza and Flanery (2013).
Desouza and Flanery (2013) explain that the five main components (resources, processes, people, institutions and activities) interact and create instruments for the creation of value for the inhabitants of the city. The two largest spheres represent the interaction between the social and physical components, which constantly overlap and shape themselves according to the circumstances. To the left, the four types of stressors to which a city can be exposed are categorized: natural (natural disasters, hurricanes, earthquakes, tsunamis etc.), technological (result of complex technological systems prone to errors), economic (unemployment, poverty, poor investment management etc.) and human (terrorism, war, crime etc.). At the top of the figure, the types of damage that stressors may cause to one or more components of the city can be seen: destruction (permanent loss or incapacitation of one of the city components or interaction means thereof), decline (gradual obsolescence of a component, causing the loss of its ability to function or survive) and disruption (temporary loss of availability or inability of a particular component to work) (Desouza and Flanery 2013). Next, one of the metrics to evaluate urban resilience will be presented.
2.2 Baseline Resilience Indicators for Communities (BRIC)
The Baseline resilience indicators for communities (BRIC) is a composite indicator (an aggregate composite resilience measurement comprising individual variables) used to measure the conditions that influence resilience to disasters in communities (Cutter, Burton, and Emrich 2010). The proposed indicators are a basis for a number of conditions considered when measuring the effectiveness of the programs, policies and interventions designed to increase resilience (Cutter, Burton, and Emrich 2010).
The BRIC consists of five categories or sub-components: social resilience, economic resilience, institutional resilience, infrastructural resilience and community capital (Cutter, Burton, and Emrich 2010). According to Singh-Peterson et al. (2014), social resilience focuses on the measurement of social differences within and between communities; economic resilience can be understood as the ability of a region to recover from a shock in its economy, which may affect or threaten the growth of the region (Hill, Wial, and Wolman 2008); institutional resilience refers to the resources and the expertise that institutions immediate to communities present to deal with adverse situations (Paton 2007); infrastructural resilience includes physical systems (for example, structure of households and the number of available shelters) (Cutter et al. 2008), capacity of responsiveness and community regeneration (Singh-Peterson et al. 2014); finally, community capital is essentially “[...] anything that is tangible that a community requires for its existence or benefits from” (Miles and Chang 2008, w/p). The indicator is thus a measurement that focuses on issues of sense of community, local adherence and citizen participation.
The index is based on the theoretical framework proposed by Cutter et al. (2008) called disaster resilience of place (DROP). The framework supports the selection, ponderation and aggregation of variables. From the grouping of several sub-components distributed within the categories mentioned, the BRIC makes a comparative approach (between communities within the scope) and builds a representation of resilience (Cutter, Burton, and Emrich 2010). The variables (sub-components) were chosen based on the relevance justified by the literature and the availability of consistent quality data. They are represented by percentage, per capita scales and density functions (Cutter, Burton, and Emrich 2010). Thirty-six variables were finally selected. Each sub-component has seven or eight variables.
All variables are normalized by the min-max method, which re-scales all measures to values between 0 and 1 (Tarabusi and Guarini 2013). Some variables need to be adjusted so that higher values represent lower resilience indexes (inversion of values) (Cutter, Ash, and Emrich 2014). Utilizing variable averages, the resilience values of regions are obtained for each of the five categories or sub-components, and the sum of these values comprises the resilience index (Cutter, Ash, and Emrich 2014; Cutter, Burton, and Emrich 2010). Therefore, allowable resilience index values range from 0 to 5. Equations (1) and (2), respectively, show the calculation of the sub-components and of the resilience index.
where:
k = number of the sub-components, varying from 1 to 5.
n = number of the sub-component variables, varying from 1 to 7 (except for the sub-component institutional resilience, which varies from 1 to 8).
Cutter, Ash, and Emrich (2014) recognize the fact that the resilience of communities is dynamic over time. They state that, due to the quantification of variables, the model statically depicts the inherent resilience of the regions at a specific time. Moreover, due to the normalization of variables, the measurement does not represent the absolute resilience value of a community; instead, it represents a relative value with which multiple locations can be compared (Cutter, Ash, and Emrich 2014). Frazier et al. (2013) claim that the index does not take into account specific indicators that may vary according to region, which could affect the precision of the index. Similarly, Singh-Peterson et al. (2014) criticize the exclusion of ecological resilience and report difficulties in the transition of indicators to local levels, mainly because the indicator does not consider some region specific characteristics, such as exposure to certain types of natural hazard.
According to Stevenson et al. (2015), the indicator has a low implementation cost compared to other tools. It was statistically validated and can be applied to a wide area over time. Therefore, understanding BRIC as an urban resilience performance measurement, it is possible to make an analogy to TOC performance measurements. Aiming to elucidate the theory of constraints and its components in the next section its concepts, definitions and applications to the public sector are discussed.
2.3 Theory of Constraints (TOC)
The theory of constraints originated in the 1970s along with materials requirement planning (MRP) and just-in-time production (JIT), derived from the creation of the OPT production synchronization system (Optimized Production Timetables) (Tulasi and Rao 2012). The theory was defined by Dr. Eliyahu Goldratt as a general approach to manage an organization (Goldratt 1988). In short, the concept of TOC suggests that (a) every system has at least one constraint that limits the achievement of the goal, and (b) constraints represent opportunities for improvement (Robbins 2011).
According to Tulasi and Rao (2012), the TOC has three paradigms that serve as its basic principles: logistics, global performance measures and thinking process. The first paradigm is a philosophy that establishes the working principles of the theory, including five steps to reach the goal and the drum-buffer-rope production synchronization system (Tulasi and Rao 2012). Where the goal of the organization is to make money now and in the future, the TOC proposes global performance indicators that focus on achieving the goal, unlike traditional accounting (Tulasi and Rao 2012). The last of the three paradigms, thinking process (or TP), is an analytical tool to investigate, analyze and solve complex problems (Kim, Mabin, and Davies 2008). TOC’s thinking process makes use of scientific method and aims to answer three questions: what to change? What to change into? And how to cause the change? In that sense it intends to facilitate the liberation, the focalization and the criticism of the intuition (Goldratt 2010).
The concepts and methods of the TOC are still being improved through research, with the production sector the one to receive more studies (Tulasi and Rao 2012). However, the theory is not limited only to this sector. It is also applicable to public and non-profit organizations (Taylor, Moersch, and Franklin 2003). In this sense, Robbins (2011) stresses the need for official governments to learn to manage more efficiently and effectively public resources through the Theory of Constraints (Goldratt 2010) due to increasingly limited budgets. Barnard and Immelman (2013), though, warn that such organizations are more complex, often lack clarity in their objectives, include great bureaucracy, involve distrust among people, experience resistance to change, and conflicting objectives and lack tolerance to business theories.
In the context of non-profit organizations, according to Ronen and Pass (2013), the goal is to increase performance as measured by specific indicators. Each organization must focus tightly on its goal, once clearly defined, because they often have access to very limited resources. Thus, the throughput of a public organization can be defined as “[...] the amount of aggregate value units produced by the amount spent over a period” (Walsh 2013, p. 1,093).
The TOC in public organizations can be applied to both common processes and complex problems. Robbins (2011), for example, applies the TOC to a process of a records department and to activities of a heavy equipment maintenance department. Applications of the theory to more complex problems can be found in Taylor, Moersch, and Franklin (2003) and Čiegis and Jasinska (2006). The first study presents the thinking process of the TOC in a staff recruitment procedure at a police academy in the state of Texas/USA, increasing the number of selected people per process and shortening the process time as a whole. Čiegis and Jasinska (2006) suggest the application of TOC for governments to analyze an industrial sector before providing financial support. In this case, rather than benefiting a small group of companies, the goal is to improve the competitiveness of the entire production chain.
The basic form of application of the TOC for troubleshooting and performance improvement occurs through the focusing process. This process consists of five steps that identify the constraints that prevent an organization from achieving its goal, restructuring the organization based on the constraints and creating a continuous improvement process (Kim, Mabin, and Davies 2008; Tulasi and Rao 2012). Robbins (2011) details the five focusing steps for public organizations:
identify the system’s constraints: constraints in public agencies may be the number of employees, their training level, the capacity or amount of equipment etc. A suggested way to identify constraints is to identify (and analyze the impact of) queues in the process flow;
exploit the constraint: find ways to maximize gain from an identified constraint, i.e. to make the constraint as effective as possible. It can be obtained with an optimal conjunction of services, for example;
subordinate the system to the constraint: resources that are not constraints should operate to make the constraint more productive. In a public organization, examination of how processes are executed, optimization of space, analysis of implication of performance measurements etc. are practical examples of this step;
elevate the constraint: use available resources to eliminate the constraint; this refers to long-term solutions, such as increase in staff or acquisition of new physical facilities;
if the constraint has been “broken”, return to the first step.
When trying to improve urban resilience, practitioners can use BRIC in the first focusing step of TOC, i.e. identifying constrains. Pretorius (2014) states that the restrictions found in this step can be physical (internal or external), or non-physical (political and behavioral). It is also important to use a tactic to identify constraints that takes into account the system as a whole so that not only local optima, but also global optimizations are obtained (Pretorius 2014). Identifying the system constraint is key since, according to Goldratt (2010), the sum of the optimal locations is not equal to the overall optimum of a system. As applied in this study, the BRIC must be used so that city constraints are identified holistically and thus exploited, elevated and “broken” to increase the resiliency of the city as a whole.
Having defined the concepts proposed, this work continues by presenting the research method, which describes the steps defined for the conduction of this research.
3 Research Method
The research method helps to justify the generated knowledge, to answer the research problem under evaluation by the scientific community and report procedures that provide a solid base to research results (Lacerda et al. 2013). This study uses case study as the research method. According to Dresch et al. (2015, p. 95), the case study is indicated “[...] when research objectives are focused on the extent of the operation, description or explanation [...]”. This research method is used to study a specific situation, creating or testing theories. The researcher has an observer role, not interfering directly in the research (Dresch et al. 2015). However, the researcher is responsible for a careful analysis of the data, verifying behavior patterns and explaining the phenomena relevant to the study (Ellram 1996). Unlike the prior case study documented in (Cutter, Burton, and Emrich 2010), which focused on a set of economically and administratively independent regions, this study investigates resilience in a centrally administered set of 17 PB regions. Therefore, this study is characterized as an embedded (multiple units of analysis) single case (regarding its context), as proposed by Yin (2013). This study explores both means to improve the resilience of cities and the restrictions that inhibit desired improvement. In this study, the BRIC is applied to all 17 of the PBRs of the city of Porto Alegre, generating data that provide a critical analysis of the levels of resilience and the connection with the TOC’s five focusing steps. Based on the model proposed by Cauchick Miguel and Sousa (2012), the research method is outlined in Figure 2.
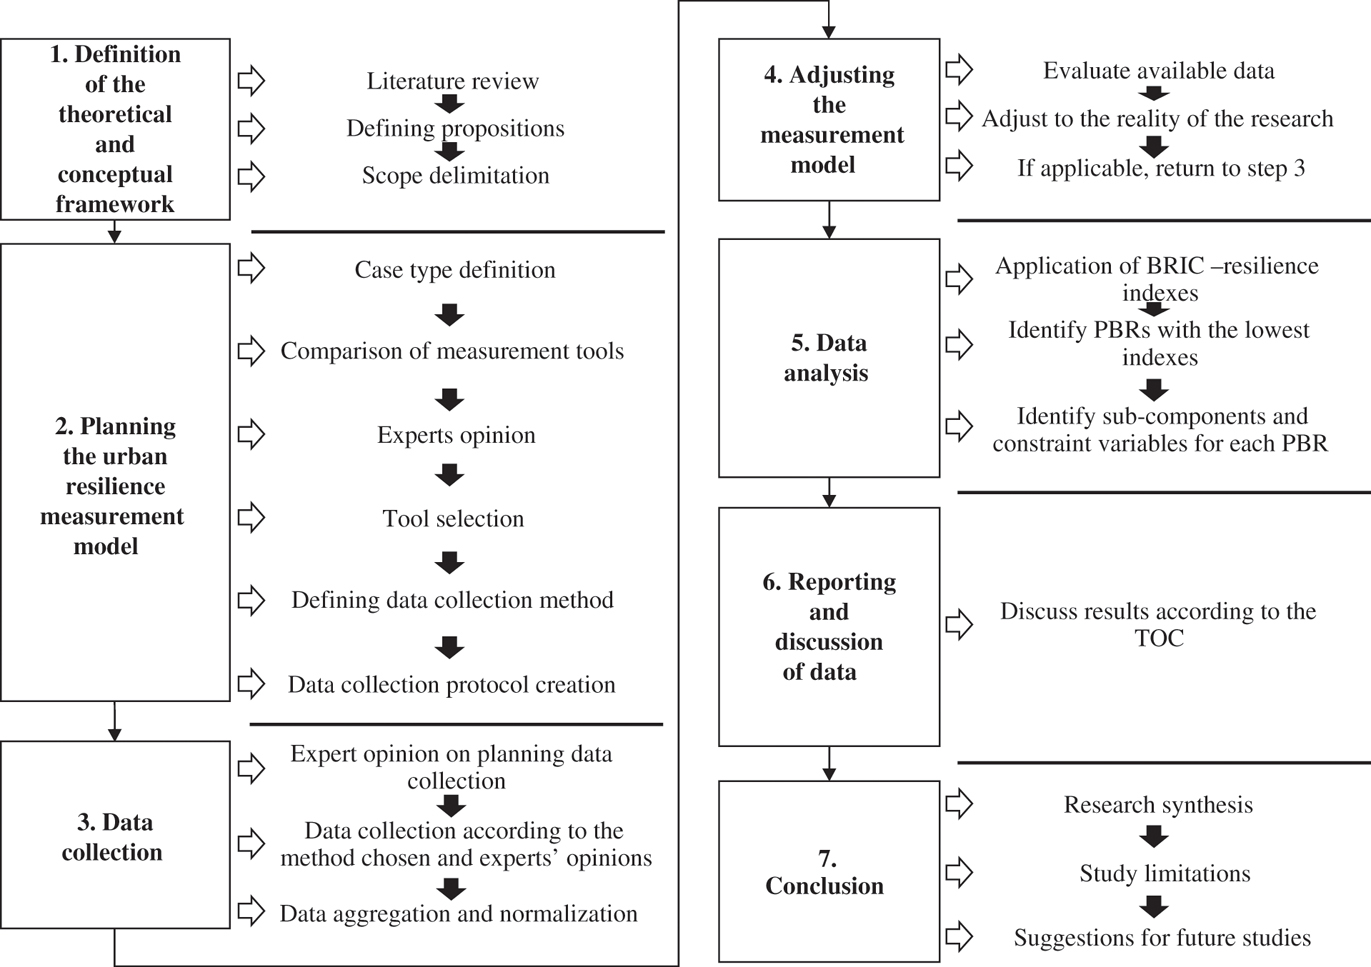
Research method.
Source: Prepared by the author.
In the first stage, presented in the Sections 1 and 2 of the current work, the authors defined the conceptual and theoretical basis on which the research was conducted, evaluated prior studies and selected material. The proposals of the research and the scope of the work were also defined to support design of the conceptual-theoretical framework. The second stage included planning the urban resilience measurement model, defining the case, comparing available tools, their presentation to a specialist, the selection of a tool (among those presented) considered suitable for the research and the definition of the method and the data collection protocol.
The collection of data occurred during the third stage of the research. The collection was planned in consultation with experts in order to enable the use of appropriate collection tools. After the planning, data collection was held, collecting information needed for the construction of the indicator. The data was processed according to the BRIC. With part of the data collected, an evaluation of the data available to that point was performed. Based on data availability and on the variables proposed by the indicator, adjustments to the tool were made so that it better reflected the reality of the case, but there were no significant changes in the concepts and propositions of the variables and the BRIC. When deemed necessary, a new data collection was performed after adjustments in order to adequate the proposal of the indicator.
The data analysis was the fifth stage of the research. The indicator was applied to the case and the results were presented. It was then possible to identify the regions with the lowest resilience levels as well as the indexes of the variables and sub-components for each PBR and for the city as a whole. Based on the fifth stage, there was a discussion of the results and the connections of the research with the theory of constraints. Finally, a summary, a presentation of limitations and future research suggestions conclude the work. In the following sections, the stages are detailed.
3.1 The Case Under Analysis
Porto Alegre is the capital of Rio Grande do Sul, a Brazilian state located in the far south of the country. The city is the 10th most populous in Brazil and the most populous city in the state (IBGE 2010). Internationally, Porto Alegre gained recognition for hosting the World Social Forum in 2001, 2002, 2003 and 2005 (Lemos 2011) and the FIFA World Cup in 2014 (Zero Hora 2011). It was also highlighted by the American Lang LaSalle consulting group as one of the 24 cities worldwide with a great potential to attract investments (Gerchmann 2004). Figure 3 shows the geographical location of Porto Alegre.
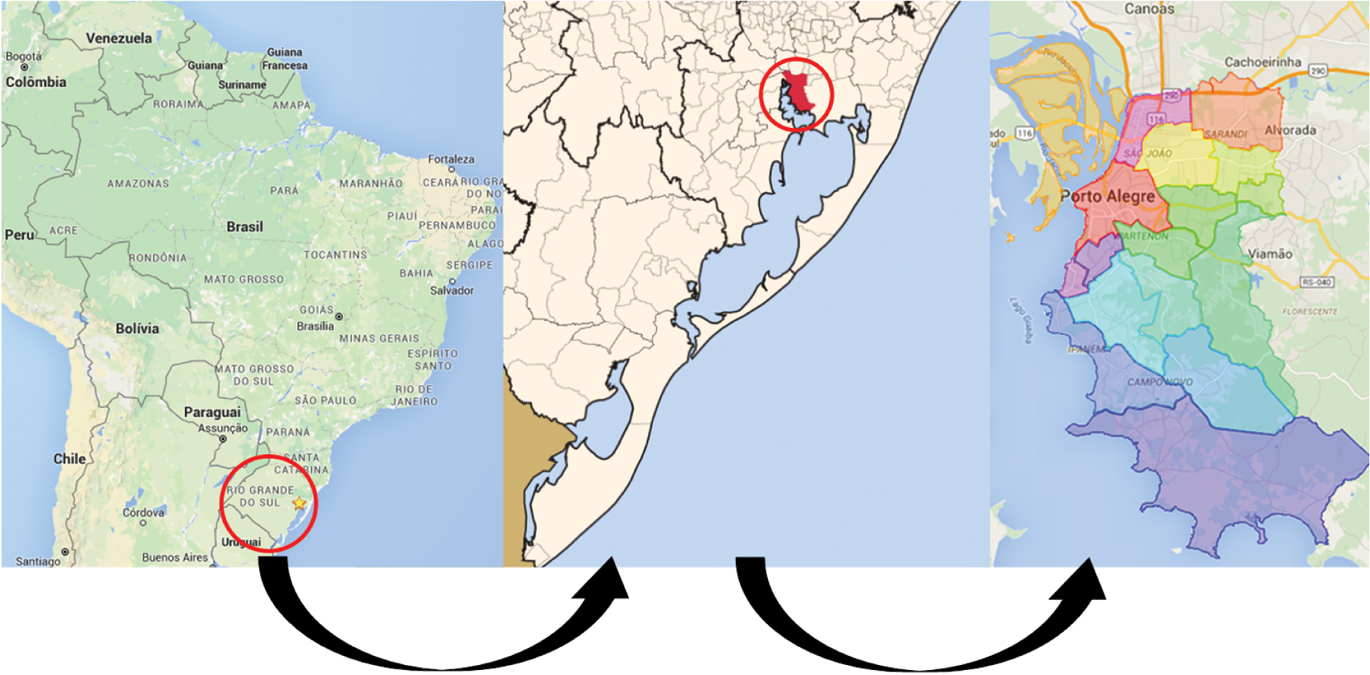
Location of Porto Alegre.
Source: Prepared by the author.
Another significant factor for the city and for this research is its Participatory Budgeting (PB) policy. The city implemented the PB policy in 1989. It is one of the pioneers in the application of this process (Shah 2007). According to Shah (2007), participatory budgeting has brought expansion of access to basic public services such as sanitation and paving of streets, and reduced the default of municipal taxes, thus increasing the revenue of the city. As the PB aims to meet local policies regarding a more equalized distribution of public resources between the regions of a city, regardless of their economic or social situation (Avritzer 2002), Porto Alegre is segmented into 17 participatory budgeting regions. The use of this segmentation aims to understand the city in smaller parts and measure their resilience in this sense, since the city’s budget is distributed across these 17 regions. In addition, this segmentation aids the TOC Focusing Process that is proposed in this work. The segmentation of the participatory budgeting is detailed in Figure 4.
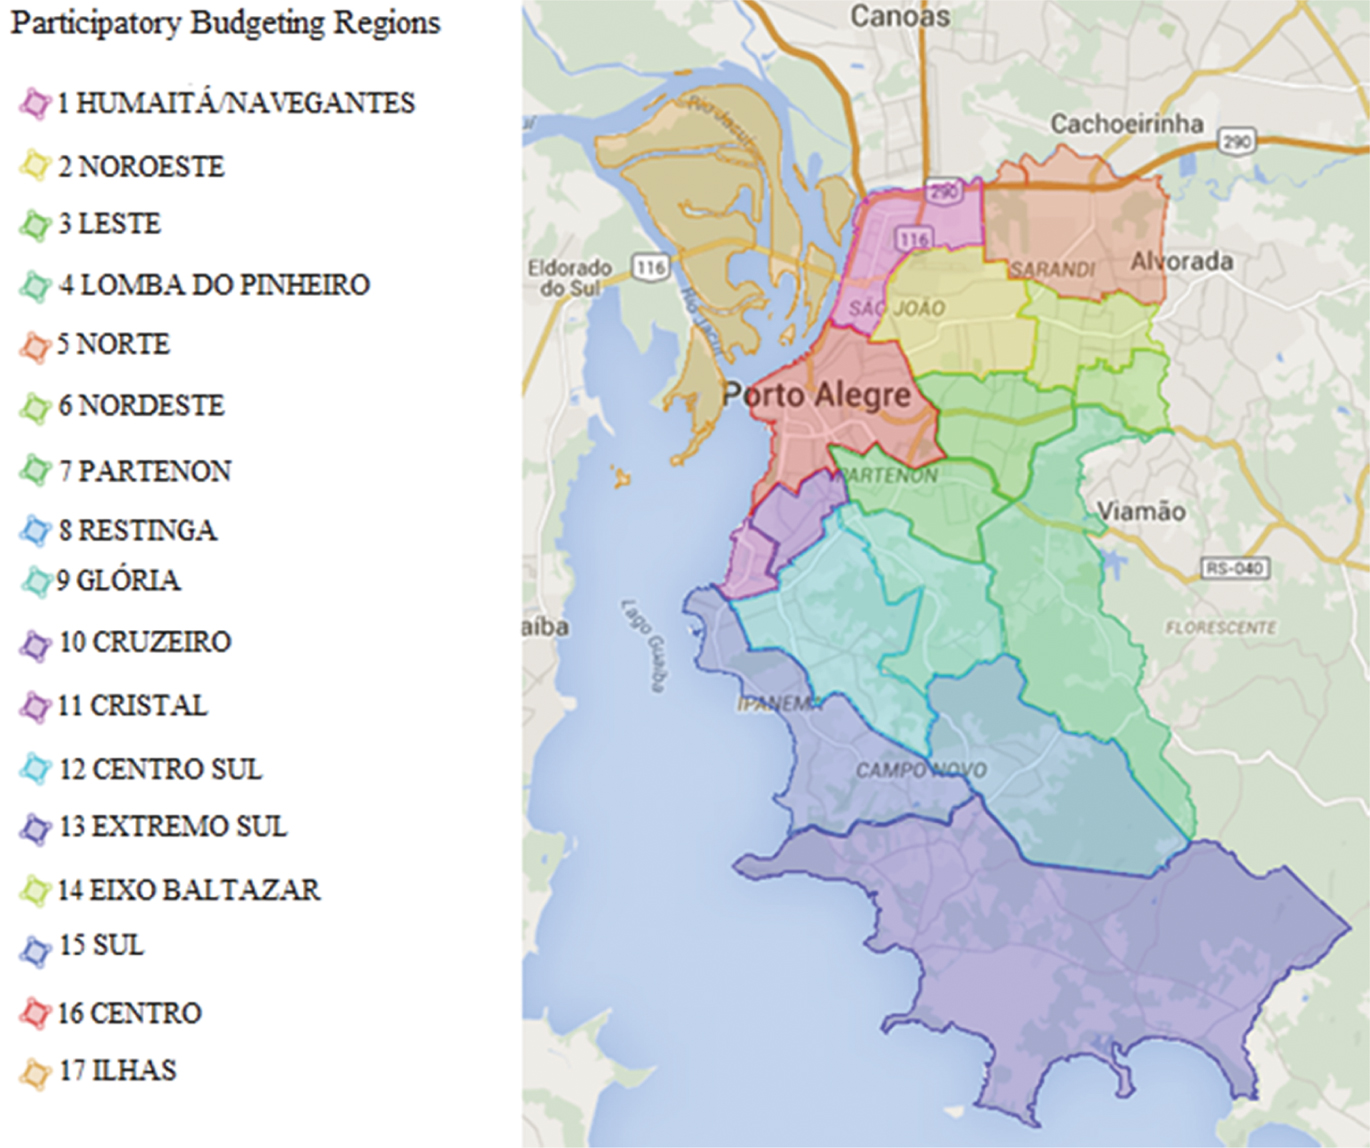
Participatory Budgeting Regions of Porto Alegre.
Source: (Google Maps 2016).
As for urban resilience, Porto Alegre has been part of the 100 Resilient Cities of the Rockefeller Foundation since 2014. The 100 Resilient Cities 100RC supports the adoption and incorporation of a view of resilience that includes not just the shocks — earthquakes, fires, floods, etc. – but also the stresses that weaken the fabric of a city on a day to day or cyclical basis. Examples of these stresses include high unemployment; overtaxed or inefficient public transportation systems; endemic violence and chronic food and water shortages. By addressing both the shocks and the stresses, a city becomes more able to respond to adverse events, and is overall able to deliver better basic functions in both good and bad times, to all populations (Resilient Cities 2016). The project’s completion is scheduled for the end of August 2016.
In a first analysis, the objective of the work is to identify the constraints to the increase of resilience of cities. The use of a single case is thus justified. As Yin (2013) states, one of the justifications for the use of the single case is when the case under study is common, that is, when the objective is to understand the conditions of a usual scenario aiming to apply the knowledge generated to the theory under study from the observation of such scenario. The relevance of Porto Alegre, both nationally and internationally, and the recent involvement of the city with urban resilience explain the reason for the choice of this city as the case study in this work. Further, according to Yin (2013), when analysis units are used for more than one level, creating analysis subunits, the case is called integrated. As this research examines not only the city of Porto Alegre but also the regions within the city, it is classified as an integrated single case. The process of choosing the resilience measurement tool is detailed in the next section.
3.2 Tool Selection
As a result of the literature review on resilience measurement methods, three tools were identified: (a) baseline resilience indicators for communities (BRIC), (b) city disaster resilience scorecard (CDRS) and (c) community resilience index (CRI). However, only one of these tools was to be selected for this study and for compliance with its scope. Table 1 presents and details the tools and some of the factors used in selecting tools.
Resilience Measurement Tools.
| Indicator | Type | Maturity level1 | Source | Positive aspects | Limitations |
|---|---|---|---|---|---|
| BRIC | Composite indicator | 4.5 | (Cutter, Burton, and Emrich 2010; Cutter, Ash, and Emrich 2014) | – Use “easy” access secondary data; – Low cost implementation; – Applicable to a large area over time. | – Depends on the availability of required data; – Comparative analysis limited only to the area to which the tool is being applied; – Tool with USA particularities. |
| CDRS | Evaluative tool | 3.25 | (UNISDR 2014; 2015) | – Greater detail and contextual information when compared to indexes using secondary data; – Facilitates commitment to and communication on resilience. | – Intensive use of resources; – Subject to inconsistent applications and interpretations by different users; – Previous and well developed assessment of risks required; – After completion of the index, lacks a clear path to facilitate the change and maintain a continuous monitoring of resilience. |
| CRI | Composite Indicator | 3.5 | (Norris et al. 2008; Sherrieb, Norris, and Galea 2010) | – Use secondary data; – Applicable over time. | – Model not fully validated. |
Source: Prepared by the author.
1According to Stevenson et al. (2015).
CDRS is an evaluation tool designed to allow cities to establish a measurement based on their levels of resilience in order to identify investment and action priorities and monitor resilience over time (UNISDR 2015). The CDRS has 90 evaluation criteria, scored using values ranging from 0 to 5, organized in 10 categories. The indicator is detailed and may be used as a facilitating tool for the city’s commitment to resilience (Stevenson et al. 2015).
CRI is a composite indicator that uses secondary data to measure adaptive resilience capabilities (Sherrieb, Norris, and Galea 2010). According to the authors, most of the data were available in the public domain and included researches conducted by governmental departments and agencies, universities, NGO’s, etc. It is developed from a community resilience framework developed by Norris et al. (2008), which consists of four categories of resources, i.e. economic development, social capital, information and communication and community competence.
One of the limitations of CDRS is its high cost resulting from the amount of data required for the application of the tool. In addition, the indicator requires the city to have in advance a structured and well-developed risk evaluation (UNISDR 2015). It is noteworthy that because it is a tool that uses data collected directly from interviews with experts, the results are subjective and subject to assessment and different people views.
Although it presents 17 statistically validated indicators for the categories of economic development and social capital, the CRI is limited to only those two categories. The indicator does not provide a complete examination of the four categories suggested in the framework developed by Norris et al. (2008). In a sense, it appears to be only the initial part of the identification of community resilience capabilities (Sherrieb, Norris, and Galea 2010).
Like the CRI, the BRIC is a composite indicator that uses secondary data to measure resilience in different regions. The tool was developed in Cutter, Burton, and Emrich (2010) and in Cutter, Ash, and Emrich (2014). It stands out because it uses mostly public data, facilitating the replication and the adaptation to other regions and reducing the costs of implementation. However, the BRIC has some problems such as comparisons limited only to the areas studied (Stevenson et al. 2015), its difficulty to be transposed to smaller areas such as micro-regions and districts (Singh-Peterson et al. 2014) and the use of specific USA regional variables (Frazier et al. 2013).
In addition to the advantages and disadvantages of each tool, another aspect considered at the selection phase was tool maturity level (ML), which was assessed by Stevenson et al. (2015). The ML is an average value ranging from 1 (ad hoc measurement tools) to 5 (optimized and adaptative). The average is derived from a critical evaluation, assessed by the authors based on available literature, of four categories, namely: (a) development of the definition of resilience, (b) iterative tests and tool refinement, (c) evidence of operationalization and information policy and (d) test validity. The evaluation made by the authors is aided by a maturity model which specifies the criteria of the categories and the average ML. Table 2 presents the model and aims to elucidate the assessment.
Maturity Level Ranges.
| ML 1 | ML 5 | |
|---|---|---|
| Maturity level | Untested conceptual frameworks and ad hoc interventions | Well-developed assessment tools, policies, and operationalized interventions are adaptable to optimize assessments and interventions |
| Definitions | Unclear or ambiguous definition of resilience and desired resilience outcomes | Resilience and desired resilience outcomes defined. May include specific operational definition of resilience |
| Refinement | Not developed | Developed, tested and refined using empirical data |
| Operationalization and policy | Not systematically operationalized through policy | Established policy with clear pathways for implementation and enforcement or quality assessment |
| Validity | No evaluation made | Evaluation to ensure that interventions are leading to desired resilience outcomes |
Source: Adapted from (Stevenson et al. 2015).
The BRIC has the highest level of maturity among the three tools, mainly because of its high level of Validity. It is the closest tool to the classification defined by Stevenson et al. (2015) as optimized and adaptive. Table 3 details of the ML of the tools.
Maturity Level.
| Tool | Definition of resilience | Refinement | Operationalization and policy | Validity | Maturity (average) |
|---|---|---|---|---|---|
| BRIC | 5 | 5 | 3 | 5 | 4.5 |
| CRDS | 5 | 5 | 2 | 1 | 3.25 |
| CRI | 5 | 5 | 3 | 1 | 3.5 |
Source: Adapted from (Stevenson et al. 2015).
Evaluations were also presented to the current administrator of the Center for Integrated Command of the City Hall of Porto Alegre/RS (CEIC). During the meeting, the possibilities of applying the tools, their limitations, adjustments and issues related to the data collection method were discussed. Along with the experts, we found the BRIC to be the most suitable tool for the case. It was noted that some USA particularities presented by some variables of the tool could be adapted to Porto Alegre. Thus, bearing in mind the types and the amount of data used, the low cost, the comparative applicability across different areas of a same study location (in this case, the PBRs) and the high level of tool maturity, the choice of the BRIC as a tool in the present work is thus justified. The following section discusses the data collection method and adjustment of the selected tool.
3.3 Data Collection and Tool Adjustment
After selecting the tool, data collection began and the tool was adjusted to the case study. The BRIC aims to create a resilience reference measurement for the regions. Cutter, Burton, and Emrich (2010) suggested using 36 variables organized within five resilience sub-components. Required data are collected by means of public data sources such as censuses, studies and surveys by public organizations.
The study used as reference is the first version of BRIC developed by Cutter, Burton, and Emrich (2010). The category environmental resilience was not part of the scope of that research. In the second version, Cutter, Ash, and Emrich (2014) included environmental resilience, incremented new variables, excluded others and changed the form of measurement of some variables that were part of the previous work. In general, the variables included in the second version are directed to particular USA policies or regional characteristics. Therefore, the first version was used. However, the second version has some alternative measurement methods for some of the variables of the first version, that is, the variables are the same in essence but measured differently. Such options are important during the data collection phase, allowing a greater flexibility without loss of criterion in measurements. Therefore, they were also considered.
From the BRIC’s 36 variables, the authors consulted public data sources and people connected to the city (see Table 4 and Appendix A). Specific individuals were chosen because they are key people with knowledge and involvement with the resilience of the city. In line with the objective of this study, it was essential that available data were grouped by the 17 regions of the participatory budgeting process. Some of the variables were changed so that an adaptation to the reality of the city of Porto Alegre and its PBRs was possible, ensuring that the essence of the measurements did not diverge from the original indicator. It is important to note that differences are caused both by the geographical location of the regions (USA/Brazil) and by the regional dimension of the areas analyzed (state/municipality). As the intention of the indicator is to create a resilience index from public data, it is noteworthy that variables should have different time frames. When equal variables relating to different years were found, the most recent variables were used (see Appendix A). Table 4 presents the experts consulted during this stage.
Experts Consulted for Data Collection.
| Position | Summary of qualifications | Time working in the city hall | Time in public administration |
|---|---|---|---|
| Administrator of CEIC – Center for Integrated Command of the City Hall of Porto Alegre/RS | Master’s and PhD in Business Administration by Unisinos | 2 years and 4 months | About 23 years |
| Deputy director of resilience of Porto Alegre | Graduated in Architecture and Urbanism by Uniritter and Master’s in Urban Planning and Policy Design at the University Politecnico di Milano | 1 year and 11 months | About 10 years |
| Head of the First Approach Group (GPA) – civil defense | Graduate in Accounting Science Administration for Disaster Prevention (52 APRD/National Civil Defense/MI)Head of the First Approach Group and Technical Manager of the Civil Defense Support and Communication Group of POA | about 20 years | About 26 years |
Source: Prepared by the author.
Using the data collected for the 17 PBRs of Porto Alegre, a normalization was performed as suggested by Cutter, Burton, and Emrich (2010). Normalization scales the data of each variable to values between 0 and 1. In a given variable, the area (in this case, PBRs) with the lowest value equals 0, the area with highest value equals 1, and the other values are distributed within this range. After obtaining the normalized variables, the mean was calculated for each category so that the resilience score per resilience sub-component could be obtained for each PBR. The overall level of resilience of the regions was then calculated by summing the score of each of the five sub-components. No-data variables were considered as 0. When there were no values only for the Ilhas area (islands), they were zeroed after normalization so that the results of the other regions were not affected. Thus, these variables obtained two minimums with the value 0.
Finally, the standard deviation was calculated for each sub-component so that it was possible to observe the critical points, i.e. constraints. The classification of sub-components using standard deviations is important to perform a visual analysis. The indexes of the regions are mapped by the number of standard deviations distant from the mean, highlighting the PBRs, which have higher or lower resilience levels (Cutter, Burton, and Emrich 2010; Cutter, Ash, and Emrich 2014). A pure mapping, using only resilience values, would result in a large group of regions with average levels. The mapping using standard deviation is thus more appropriate to clearly point out groups that deviate from the average.
During data collection, 9 (25%) variables were not found or were not available, 12 (33.3%) had to be adjusted or changed, and 15 (41.7%) were found exactly as described by the indicator. The Ilhas region lacks some of the data that are available to other regions because its census was performed as part of the Humaitá/Navegantes region due to its low population (IBGE 2010) and also due to its recent independence as a region in the participatory budgeting (PMPA n.d.). After data collection and tool adjustment, the research was discussed the application of the tool.
4 Analysis of Results
This section details stage 5 of the research method. This stage included application of BRIC to identify resilience indexes of PBRs and of the city, the identification of PBRs with lower levels and deviations, sub-components and restrictive variables for the regions and the city. First, the results are presented and then analyzed.
The first step in the application of BRIC is the normalization of data. It is noteworthy that the values marked with “✘” represent data unavailable or not found (and therefore, as described in the method, set to zero). Figure 5 shows detailed data for each variable of the indicator considering each region of the participatory budgeting.
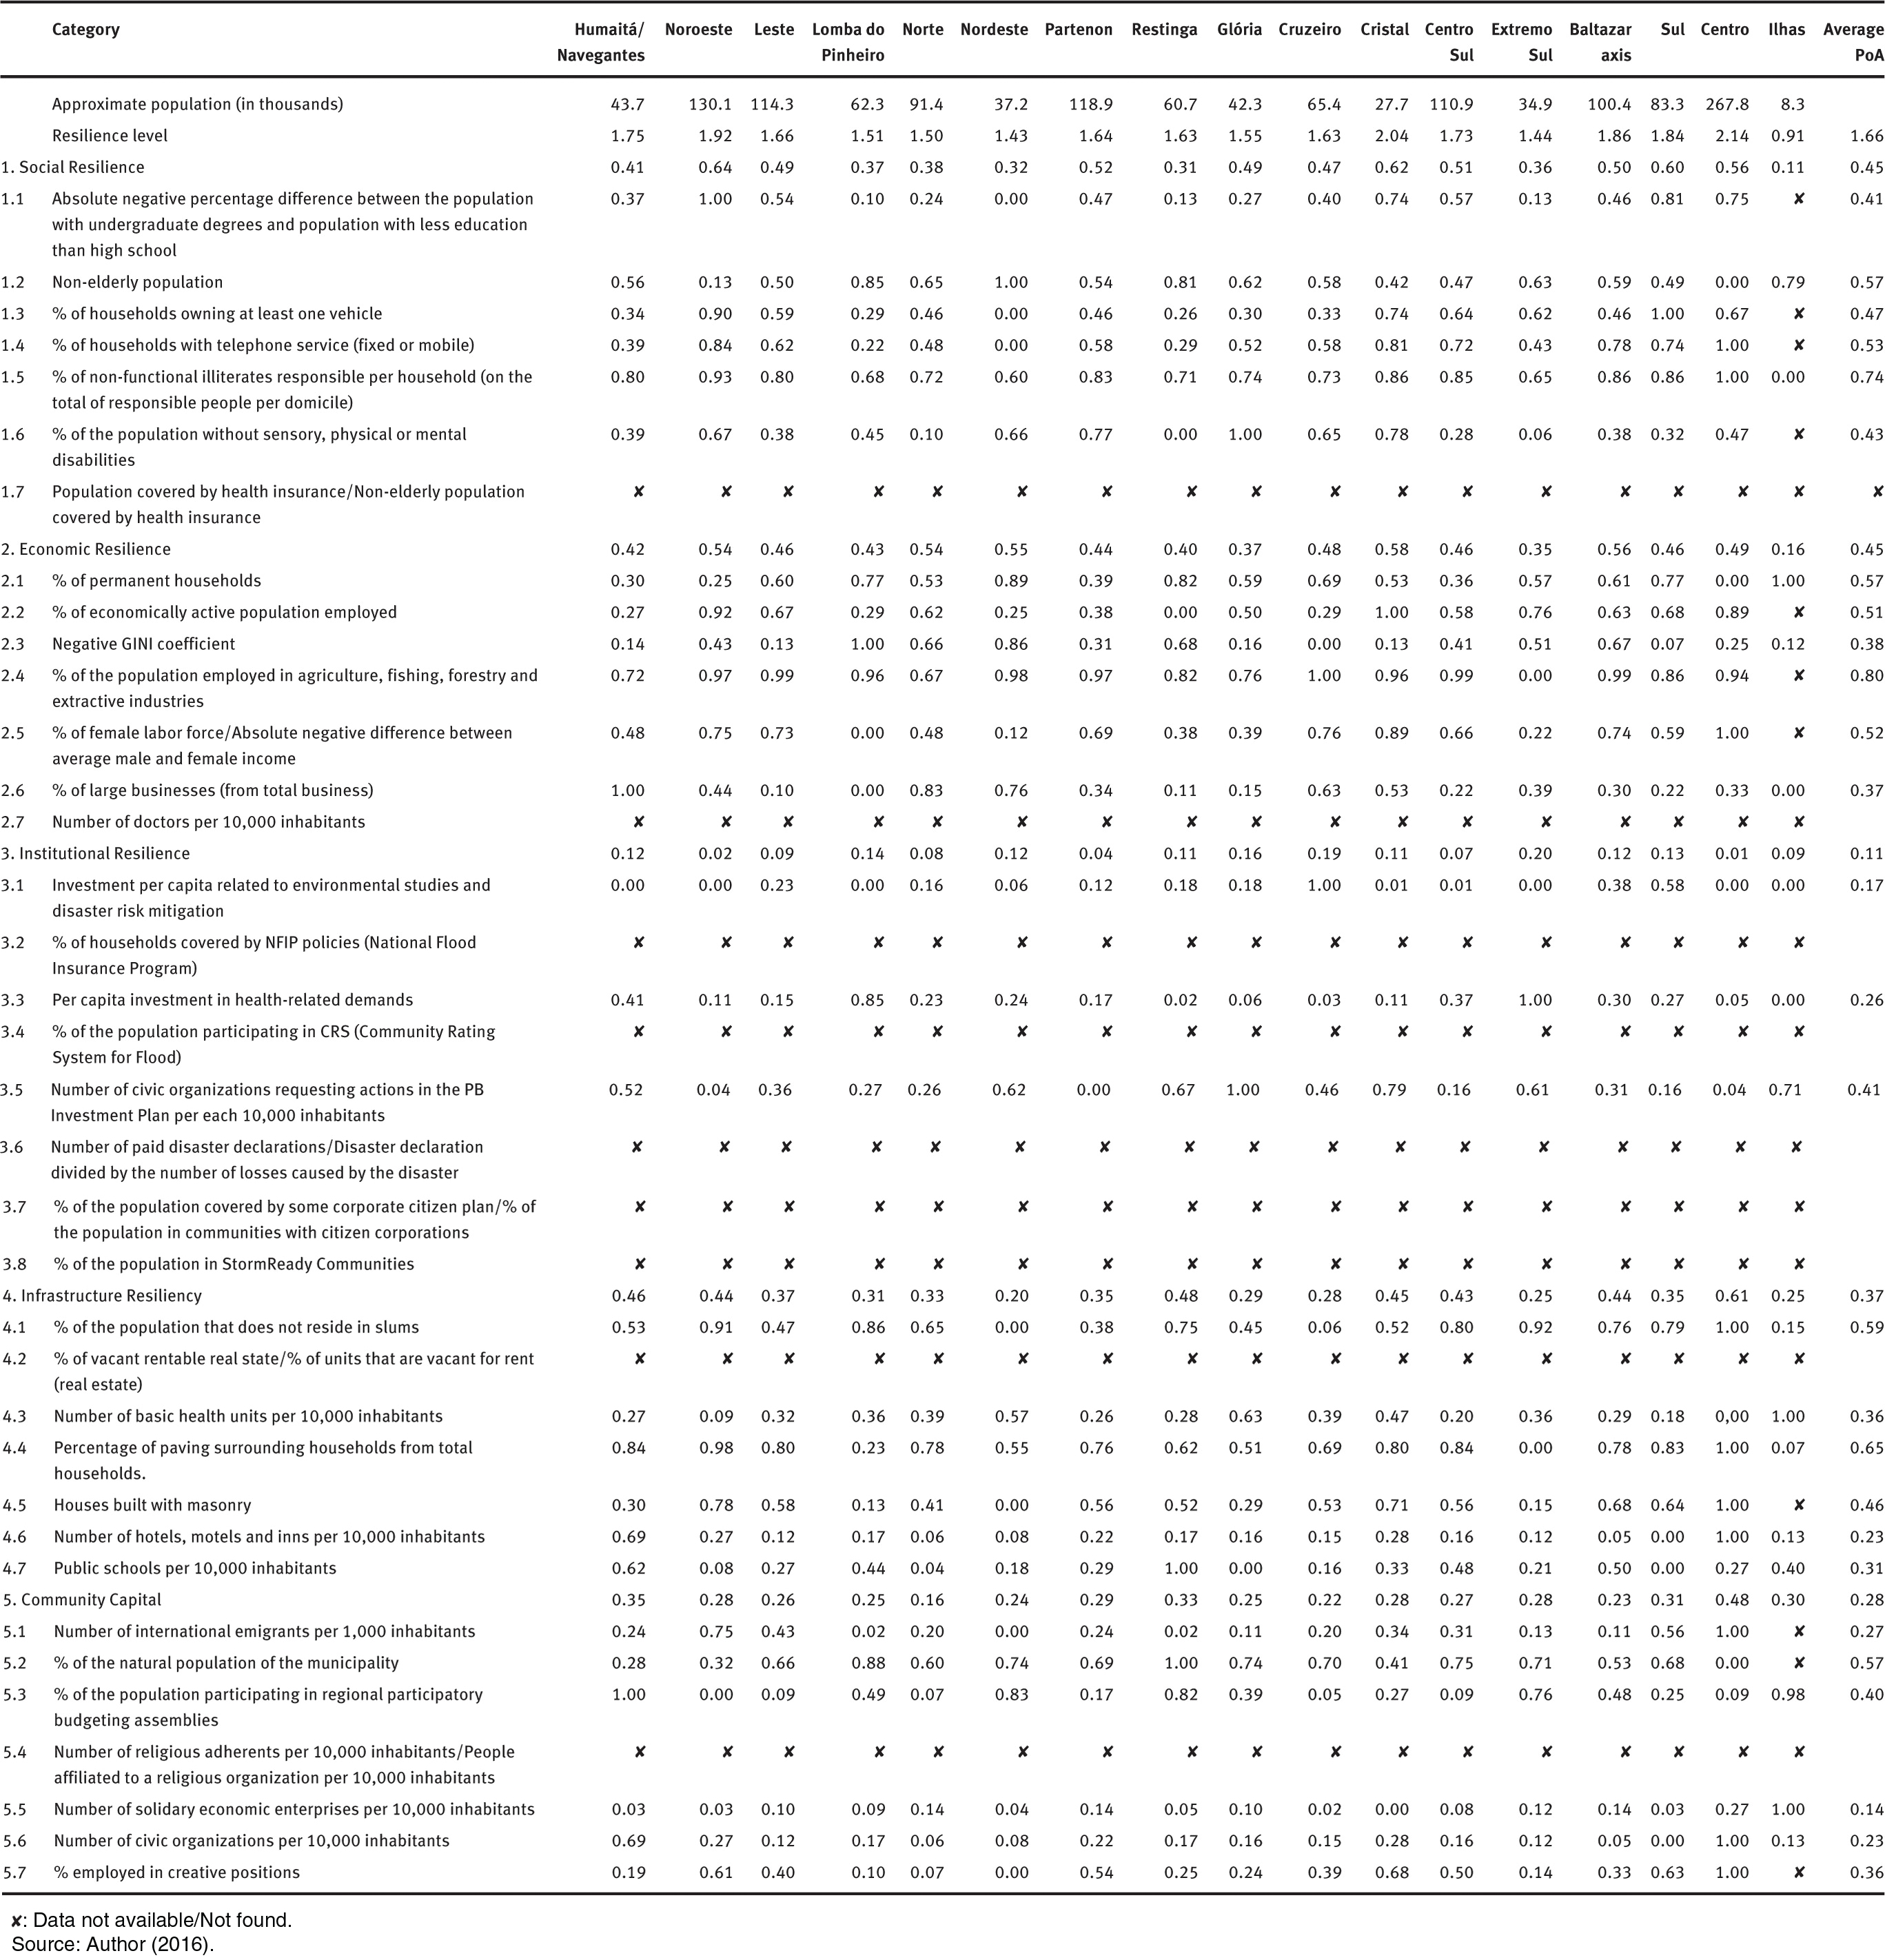
Normalized variables per PBR.
The table shows that, in addition to 9 variables not found or unavailable for all regions of the city, the Ilhas region (islands) has no data for another 11 variables. This sums to a total of 20 variables without data, i.e. more than a half of the variables initially set to zero in that PBR. In addition, the Ilhas region (islands) had four variables with a value of zero – as a consequence of the normalization – because they presented the lowest value among the regions. They were surpassed in this regard only by the Center and Northeast, with 5 and 7 variables with a lower value among PBRs, respectively. The Nordeste region has the second lowest level of resilience among regions. However, the PBR Centro has the highest level of resilience, even with five variables lower than all other regions. The average of the variables for the city is 0.33. Considering the proposed scale, the value is only 33% of the scale. However, it is important to mention that the average decreases due to the mentioned lack of values of some variables.
Consolidating the information presented, Table 5 shows the level of general resilience and levels by category for each participatory budgeting region. It is classified from the highest to the lowest resilience indexes. Values highlighted with italic are the highest values in the column; values highlighted with underline are the lowest values in the column; values highlighted with bold and italic/bold are values above and below the average, respectively.
Resilience per Participatory Budgeting Region.
| Region | Social | Economic | Institutional | Infrastructure | Community capital | Resilience level |
|---|---|---|---|---|---|---|
| Centro | 0.56 | 0.49 | 0.01 | 0.61 | 0.48 | 2.14 |
| Cristal | 0.62 | 0.58 | 0.11 | 0.45 | 0.28 | 2.04 |
| Noroeste | 0.64 | 0.54 | 0.02 | 0.44 | 0.28 | 1.92 |
| Baltazar Axis | 0.50 | 0.56 | 0.12 | 0.44 | 0.23 | 1.86 |
| Sul | 0.60 | 0.46 | 0.13 | 0.35 | 0.31 | 1.84 |
| Humaitá/Navegantes | 0.41 | 0.42 | 0.12 | 0.46 | 0.35 | 1.75 |
| Centro Sul | 0.51 | 0.46 | 0.07 | 0.43 | 0.27 | 1.73 |
| Leste | 0.49 | 0.46 | 0.09 | 0.37 | 0.26 | 1.66 |
| Partenon | 0.52 | 0.44 | 0.04 | 0.35 | 0.29 | 1.64 |
| Cruzeiro | 0.47 | 0.48 | 0.19 | 0.28 | 0.22 | 1.63 |
| Restinga | 0.31 | 0.40 | 0.11 | 0.48 | 0.33 | 1.63 |
| Glória | 0.49 | 0.37 | 0.16 | 0.29 | 0.25 | 1.55 |
| Lomba do Pinheiro | 0.37 | 0.43 | 0.14 | 0.31 | 0.25 | 1.51 |
| Norte | 0.38 | 0.54 | 0.08 | 0.33 | 0.16 | 1.50 |
| Extremo Sul | 0.36 | 0.35 | 0.20 | 0.25 | 0.28 | 1.44 |
| Nordeste | 0.32 | 0.55 | 0.12 | 0.20 | 0.24 | 1.43 |
| Ilhas | 0.11 | 0.16 | 0.09 | 0.25 | 0.30 | 0.91 |
| Porto Alegre Average | 0.45 | 0.45 | 0.11 | 0.37 | 0.28 | 1.66 |
Source: Prepared by the author.
Overall, the level of resilience enables identifying the divergence of the Ilhas region (islands) compared to other regions. However, it is necessary to remember that many of the values in the area were zeroed due to lack of data. The magnitude of difference in the relative level of resilience between the Ilhas and other regions can also be observed in Table 5 by subtracting the value of the general index of the region classified just above the Ilhas – islands (Nordeste) from the index of the Ilhas (islands). In addition to having the lowest level of resilience, this region has a great difference in its resilience level compared to the next region, with a level of resilience higher than the latter. Reaffirming this magnitude of difference of the region, the PBR with the highest level of resilience (Centro) is more than twice the level of the Ilhas (islands) PBR. Another factor that can be observed is that, of the 17 regions, 9 are below the average (see Table 5). However, although more than half of the PBRs are below the average, they represent 37% of the total city population. In total, the city has an average level of resilience of 1.66. This is considered low, given that the scale is from 0 to 5, indicating that there are significant issues to be improved.
The Centro region has the lowest value among PBRs in terms of the institutional resilience sub-component. However, it has the highest values for infrastructure resilience and community capital. At the bottom of Table 5, the Ilhas (islands), Norte and Lomba do Pinheiro regions each have only one sub-component above average. This shows a clear imbalance between regions. Another indication is the fact that there are only four sub-component indexes below the average among the five PBRs with higher levels of overall resilience. The Cristal region has no sub-component below average. Just as occurs with resilience level, the average indexes of the sub-components for the city were low compared to the proposed scale, from 0 to 1.
In order to present the data in Table 5 (discussed above) visually and intuitively, a map of the relative level of resilience for each PBRs was plotted. The calculations for the map were performed using numbers of standard deviations for each sub-component. The standard deviation for the resiliency level is 0.27, and the average is 1.66. The map of the overall resilience index is shown in Figure 6.
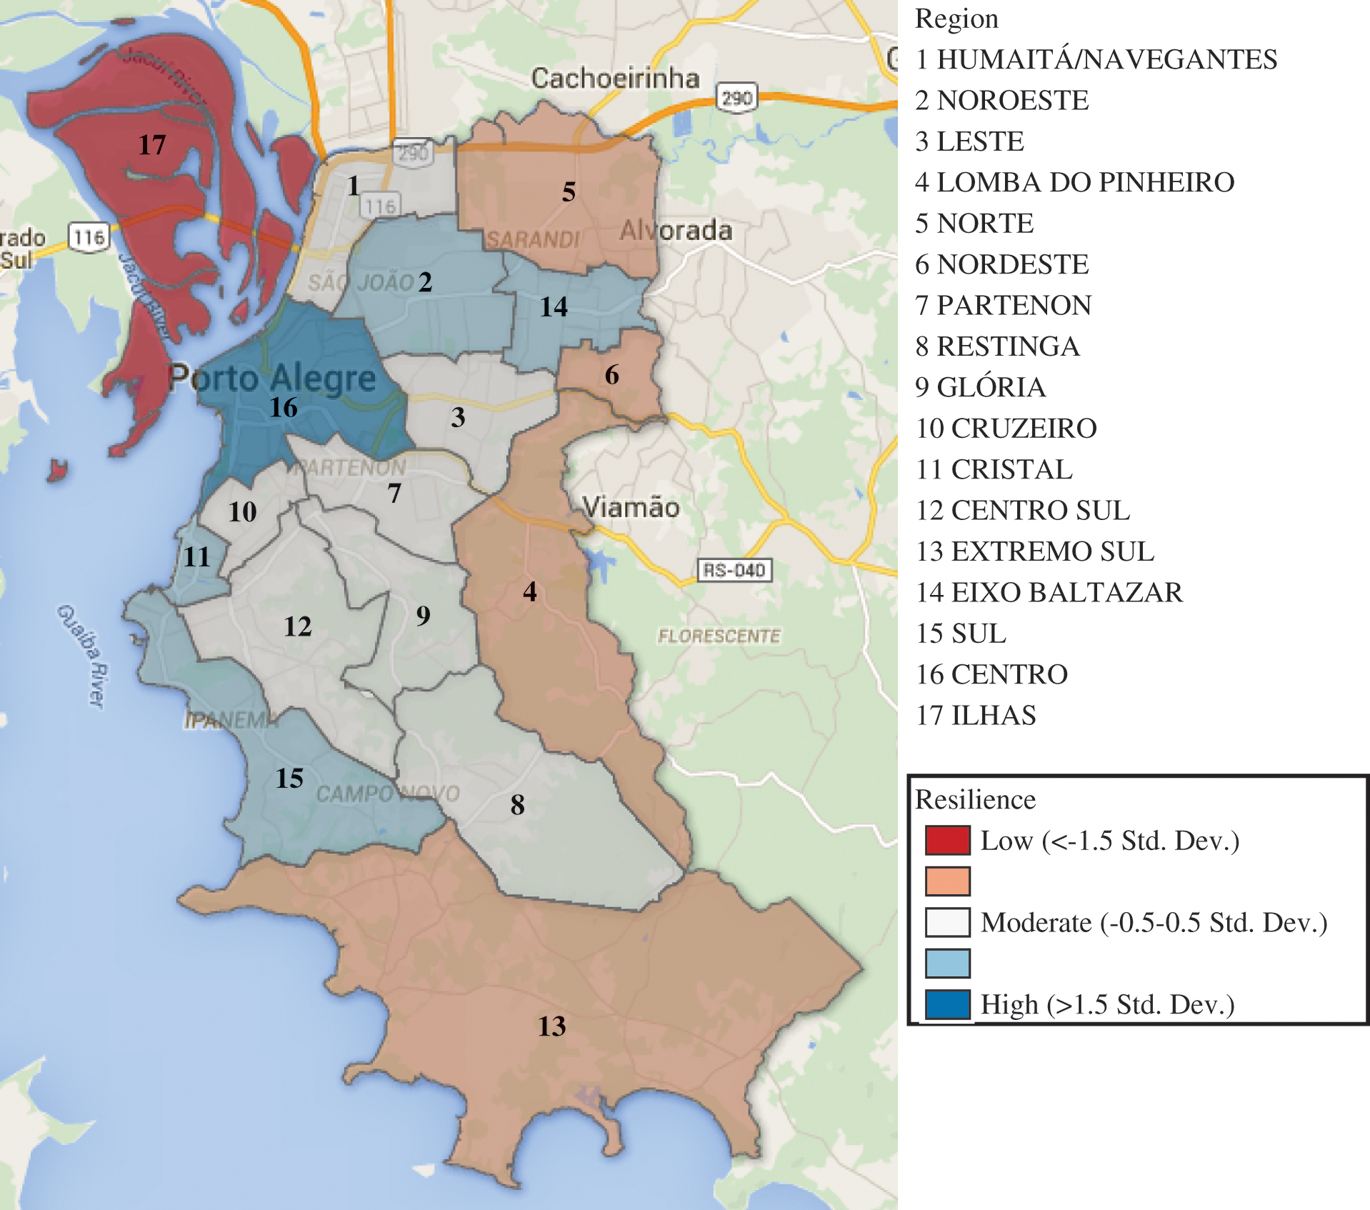
Map of Resilience Level per PBR.
Source: Prepared by the author.
In addition to clarifying the two extremes, Centro and Ilhas (islands), the map above shows other significant facts. It is possible to observe the resilience of groups. Five PBRs have an index below moderate, seven have moderate resilience levels and only five have levels above moderate, according to their standard deviations. That is, from the 17 PBRs, 12 have low or moderate resilience. It is also possible to observe resilience tendencies by geographic location. Central PBRs tend to have moderate or high levels of resilience, while extreme or city-limit regions tend to have indexes below moderate. Historically, even though Latin American countries have improved in terms of infrastructure, they are still very far from developed countries such as Spain, France and the United States, for example (The World Bank 2010).
As presented above, the resilience of sub-components is also mapped by the number of standard deviations distant from region averages. Thus, it is expected that the detection of sub-component constraints is possible Figure 7 shows the mapping per sub-component resilience.
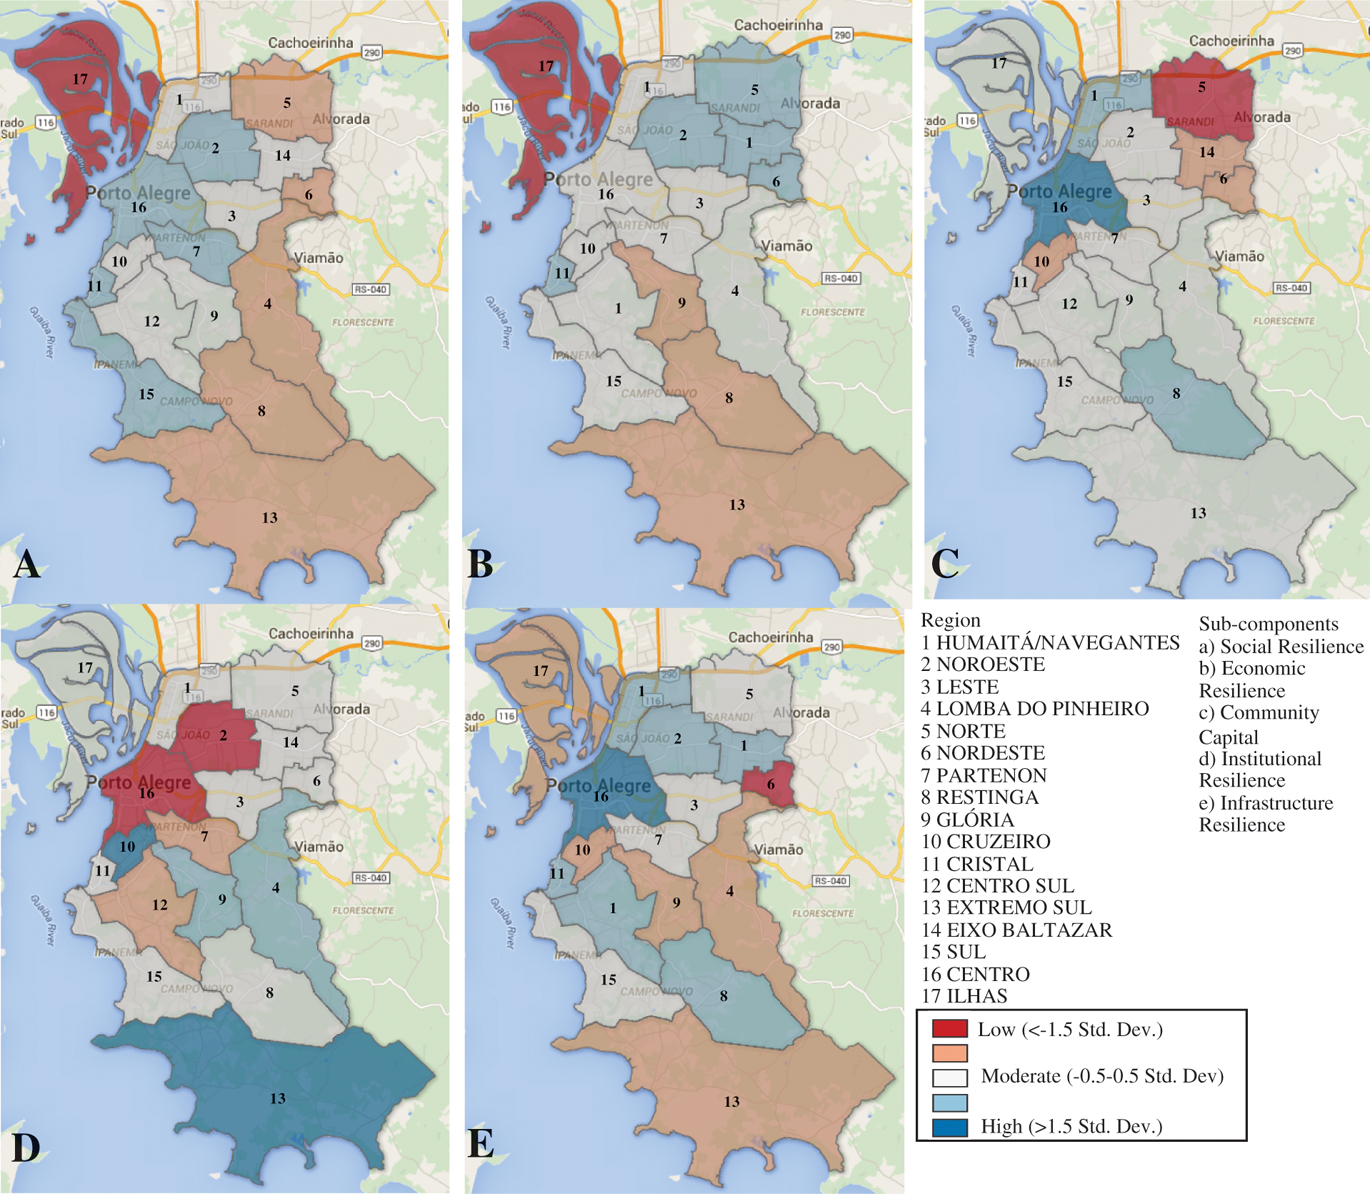
Mapping of Sub-Component Resilience.
Source: Prepared by the author.
Figure 7 shows that the Ilhas region (islands) had the worst results regarding social and economic resilience. By analyzing the data in Table 5 in detail, it is possible to understand the reasons for this result. The lack of data for the Ilhas region (islands) affect the results for the region. Yet, it is not possible to associate the poor performance of the Ilhas region (islands) only to the lack of data for the region, as there is evidence that this region has serious constraints regarding its resilience. In Figure 6 this region presents the lowest resilience level from all PBR’s. Concerning the sub-components index, the Ilhas region (islands) shows the lowest indices for social and economic resilience (Figure 7). The social resilience sub-component has the highest number (6) of PBRs with levels below moderate. Furthermore, this sub-component shows no region with a high level. This is also true for economic resilience: no PBR has an index considered high. However, only four regions have indexes below moderate.
According to Cutter, Burton, and Emrich (2010), community capital reflects social relationships between individuals and their surroundings, including sense of community, adherence of the residents to the location (how long residents tend to remain in their own communities) and citizen participation. The northern region has the lowest index for this sub-component among the 17 PBRs. This sub-component does not appear to be as uneven as the others. It has the most regions with moderate levels. Nevertheless, only one region (Centro) has a high level. Only two PBRs have levels above moderate and four levels below moderate, confirming the balanced level among regions.
Institutional resilience is the sub-component with the lowest average value for Porto Alegre. As with the Ilhas region (islands), this sub-component is impacted by the lack of data. Of eight proposed variables in this category, data for only three were found. Among all variables proposed by BRIC, nine were not found and five comprise institutional resilience, making this sub-component the most affected by the lack of data. Although two regions have significant deviations below the average, it is difficult to state that such regions (Centro and Noroeste) have indeed constraints in this category. Performing an analysis from another perspective, it is possible to question whether there is a lack of preparation by Porto Alegre in the areas of risk and disaster mitigation policies. There is not, for example, regional data identifying that the city and its regions are prepared to face risks of flooding or torrential rain, despite having a history of such events (Sander 2015). Spending and investments focused on such policies are also not clear. The overall resilience levels of regions that performed worst in this sub-component also demonstrate that the constraint may be the lack of data and measurements or the lack of an established risk mitigation policy. The Centro and Noroeste regions are respectively the first and the third best ranked in the general classification of resilience.
Considering the sub-component infrastructure resilience, the Nordeste region has the greatest deviation from the average, presenting a low level. The region has high levels of slum dwellers and few houses built with quality, affecting the region’s infrastructure (see Table 5). Along with social resilience, this sub-component has six PBRs with values considered low. In a way, it can be argued that such sub-components are responsible for a greater disparity among PBRs. Confirming this assumption by observing Figure 5, these two sub-components present a greater difference between the region with the highest index value and the region with the lowest index value.
From the resulting data, which were shown in Figure 5 and Table 5 and in Figure 6 and Figure 7, it was possible to identify constraints on resilience in different ways. In order to facilitate the analysis described above, the results were organized into two aspects: resilience components and geographic segmentation. The resilience components appear segmented, following the BRIC structure, into three levels: (a) variables, (b) subcomponents and (c) resilience (general index). Similarly, the geographical segmentation can also be segmented, but only into two levels: PBRs and Porto Alegre. Thus, a review and a structured analysis summarizing the data found was performed. Table 6 shows factors observed from the results obtained in this section according to the structure suggested.
Critical Analysis and Structured Results.
| Geographical segmentation | |||
|---|---|---|---|
| PBRs | Porto Alegre | ||
| Resilience components | Variables | – Ilhas: without data available for 11 of the 27 variables – Nordeste region: 7 times, Centro 5 times and Ilhas 4 times presenting the lowest value among all PBRs (considering only the variables that had data for the region) | – Of 36 variables, 9 were not available/were not found – The average of the variables for the city is low (0.33 of a maximum of 1) |
| Sub-components | – The Centro has the lowest institutional resilience value and the highest value for infrastructure resilience and community capital – Ilhas has the lowest levels for social and economic resilience – Among the 5 categories, 4 of the worst are ranked among the last 4 – Ilhas, Norte and Lomba do Pinheiro have only one sub-component above the city’s average – Among the 5 regions with the highest resilience index, there are only 4 PBR sub-components below average | – Low values compared to the proposed scale (0–1) – Very low institutional resilience (0.11) – From 9 variables not available, 5 are part of the sub-component institutional resilience | |
| General Index | – Central regions with an index greater than twice the index of Ilhas – Ilhas with a greater distance from the region from north regions (Nordeste) – More than half of the regions are below the city average – The highest PBR index is only 43% of the maximum possible value (5) | – Average index of 1.66 is only 33% of the maximum possible value | |
Source: Prepared by the author.
The structure presented exposes different levels of analysis, from the more focused and specific level (PBR variables, for example) to the broadest level (city’s general index, for example). Thus, having completed the analysis of the data, the discussion of the results follows.
5 Discussion of Results
This section associates the case study with the concepts presented in the TOC literature review. According to Sun and Linton (Sun and Linton 2014), the discussion should make comparisons between the concepts and the existing literature, exploring the implications for management methods and the theory. After applying the indicator, the aim is to identify resilience restrictions for the city of Porto Alegre.
According to Pretorius (2014), it is necessary to define the goal of a system before identifying its constraints. As the result produced by the studied case is not income or money, an alternative approach is necessary to define the study goal. Thus, the improvement against performance measures relevant to the system is considered as a concept of objectives (Ronen and Pass 2013) rather than a traditional approach to increased profit (Tulasi and Rao 2012). Thus, the increased resilience today and in the future is defined as the goal for Porto Alegre. Still referring to the gain of a public organization, such as the amount of value the system produces over time (Walsh 2013), the resilience index of the city, or the throughput itself, is defined as a performance measurement.
The definition of the goal and the throughput allows proceeding to the identification of constraints. The method used to identify the resilience constraints provides a top-down approach, as suggested by Wadhwa (2013) who applied it to a hospital system. The identification of constraints is first performed considering a broad view of the system and subsequently a local view, identifying more specific constraints. In the hospital system, a view of the hospital as a whole (broad view) and a view of the discharge process of a patient (focused view) are used as examples (Wadhwa 2013). Two broad views of the system are proposed for the case under study. They are used as starting points in identifying constraints. These two broad views are directed to local levels until a constraint deemed acceptable and concrete is identified. Figure 8 shows in detail the steps for identifying constraints.
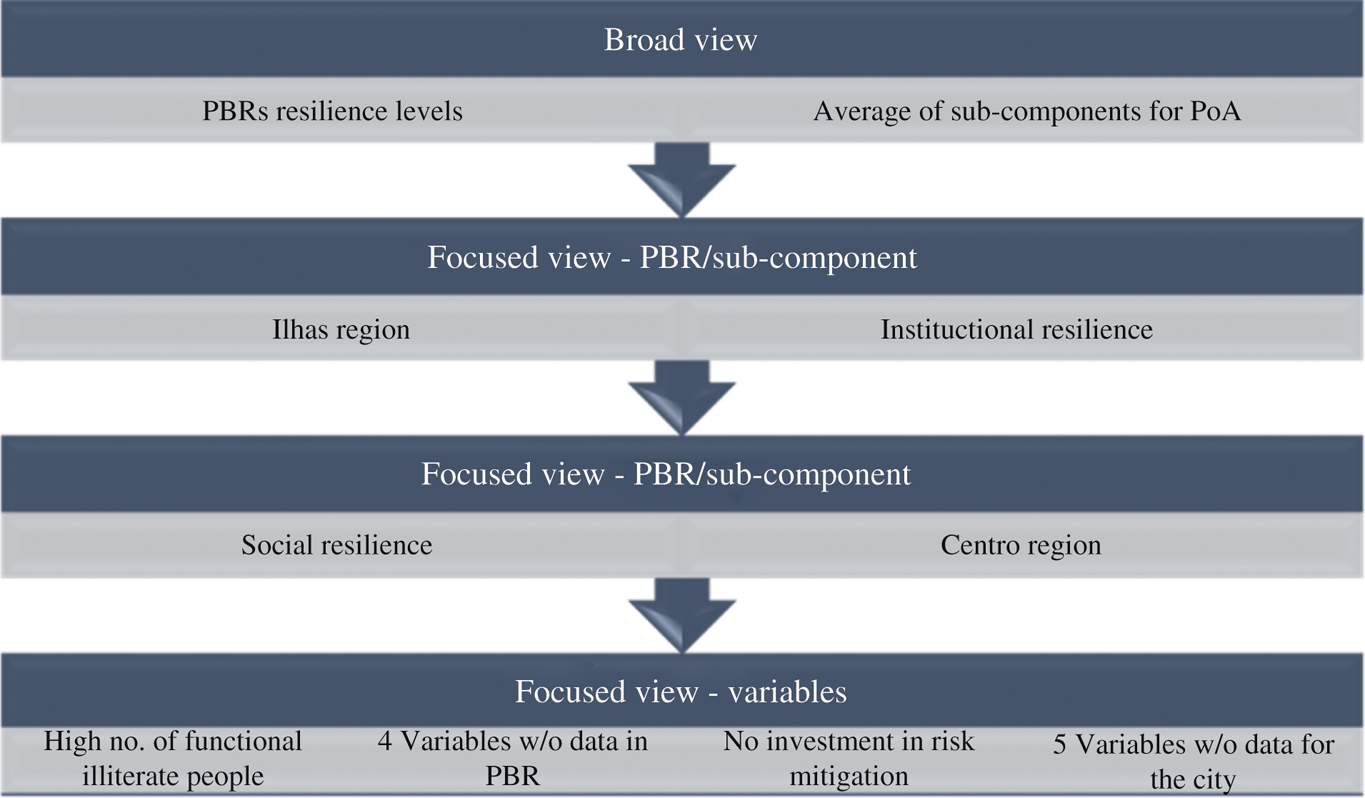
Top-down Approach to identify Constraints.
Source: Prepared by the author.
In order to identify constraints, two broad views that originated the process were considered: the overall resilience level of each PBR and average sub-component resilience indexes of Porto Alegre (see Table 5). In the case of the general resilience index, the aim was to identify which PBR among the 17 PBRs had the lowest value. In Porto Alegre, however, the resilience sub-component had the lowest average. In the focused view, social resilience was identified as the sub-component with the lowest index value of the Ilhas region (islands). Likewise, for Porto Alegre, the Centro PBR had the lowest value for the sub-component institutional resilience, becoming the focus of this step.
In the last step, two broad views converged on the analysis of variables. In the Ilhas (islands) region, four variables without regional data significantly decreased the social resilience index of the PBR. Indeed, this region has only one measured variable (not considering the no-data variables) with a lower value when compared to other PBRs, i.e. “percentage of functional illiterate people responsible for the household” (item 1.5, see Figure 5). In the case of the city, five of the eight variables proposed in the sub-component institutional constraint had no data. The only variable that has a value lower than the other PBRs in the Central region is the variable “investments per capita related to environmental studies and mitigation of disaster risks.”
In the Ilhas region (islands), it is necessary to question whether it would present a resilience level as low as that found if data for the region existed. The region is known for difficulties such as floods (Gonzatto 2015), poor infrastructure (Paula, Abreu, and Benites 2015) and poverty (Furtado 1989). It is possible to identify the criticality of the region in the indicator itself, considering that it is one of the PBRs that has a proportionally higher frequency of the lowest variable (4 out of 17, approximately 23%), only surpassed by the Nordeste region (the Centro region has also four low variables, but out of 27 variables available, approximately 15%). Finally, the reason why this region has some of its variables grouped to another region (Humaitá/Navegantes) remains an open question, considering that it is an independent party in the participatory budgeting policy.
As regards the sub-component institutional resilience, data are lacking to clarify, measure and publicly define risk mitigation plans for the city. There are no available regional data regarding such policies. Such data are essential for the city to become better prepared to face crises and disasters (Cutter, Ash, and Emrich 2014). Thus, the lack of information and risk mitigation policies eventually become constraints to resilience.
There is also a third constraint that significantly affects the city’s resilience rating: the tool itself. The BRIC, as mentioned by Frazier et al. (2013) and by Singh-Peterson et al. (2014), presents problems regarding its application to different locations and at geographical levels lower than the regional. Moreover, the indicator does not determine how to handle missing data, and assumes that all data are available. Another problem with the indicator is the use of information from different and sometimes dated time frames. It is questionable whether it is valid in 2016 to use data from 2000, along with data from 2010, among other years. As information are mostly from census surveys, new data may take up to 10 years to be updated, hindering the application of BRIC in a shorter period. However, the lack of data and the transition of some of these variables is the cause of the higher impact on the case studied.
It is evident that the analysis can be further extended to the variables in order to identify constraints. However, it is essential that effort be applied to determining the constraints that significantly impact the gain of the system rather than focusing on baseless attempts of solving several problems (Čiegis and Jasinska 2006).
Pretorius (2014) states that the constraints identified in stage 1 of the focusing process may be physical or non-physical. Čiegis and Jasinska (2006) use TOC to identify possible restrictions on the market caused by government aid. The authors exemplify physical constraints as the lack of equipment or people and non-physical constraints as strategies and lack of innovation, in order to exemplify TOC’s focusing steps for the case under study.
Thus, the three constraints identified for the resilience of Porto Alegre will be detailed following the model proposed by Pretorius (2014). As the goal and the throughput were previously defined and the constraints have been identified, the analysis of the first question “is the constraint physical?” follows. Table 7 shows the steps regarding the constraints identified as the most significant for the case under study, where N/A means not applicable.
The Five Steps of TOC Applied to the Case.
| Constraints | |||
|---|---|---|---|
| 1. Identifying the constraint | Adaptability of BRIC to the city | Measuring Policy for Ilhas | Risk Mitigation Policies |
| Is the constraint physical? | Yes | No | No |
| 2. Exploring the constraint | Adjust the tool | N/A | N/A |
| 3. Subordinating the system to the constraint | Adjust/replace with available data the specific and/or missing data | N/A | N/A |
| Was the constraint broken? | No | N/A | N/A |
| Is the performance satisfactory? | No | N/A | N/A |
| 4. Elevate the constraint | Restructure BRIC for the city scenario | Conduct/publish independent census survey for the PBR | Modify/Create a public policy for risk mitigation |
| Is it desirable to move the constraint? | Yes | N/A | N/A |
| 5. Return to step 1 | Find new constraint | Find new constraint | Find new constraint |
Source: Prepared by the author.
Non-physical constraints have political, behavioral or strategic origins (Čiegis and Jasinska 2006; Pretorius 2014), i.e. such constraints cannot be subordinated or exploited by the system. Thus, the lack of data for the Ilhas region (islands) and for mitigation policies are non-physical constraints. Therefore, the next step for these constraints is their elevation using additional resources to directly eliminate the constraint (Chou, Lu, and Tang 2012). Thus, it is suggested that regional public data policy be modified or created to mitigate risks and that a census research or the publication of an independent study be conducted for the Ilhas (islands) region. The measurement tool was also considered a constraint, as described above, but a physical constraint. Unlike non-physical constraints, they can be explored and subordinated to the system seeking a temporary increase in gain (Kim, Mabin, and Davies 2008). The explore the constraint step refers to maximizing the constraint using current and available settings (without adding resources) (Chou, Lu, and Tang 2012). Part of this step is performed in this study. However, it can go further: a new review of the literature can be conducted, estimating and validating new variables that consistently reflect the work reproduced in Cutter, Burton, and Emrich (2010) and Cutter, Ash, and Emrich (2014). However, this adaptation should be structured to the reality of the city – step 4 – and require the use of new characteristics. Once the constraint is overcome, it is desirable that the tool restriction be moved to make room for a new constraint, returning to the first step and eliminating past adjustments related to exploring and subordinating the constraint in order to avoid inertia and build a continuous improvement process (Wadhwa 2013; Pretorius 2014).
In summary, this work was intented to explain the connections between the TOC and the case study, highlighting urban resilience aspects of Porto Alegre and its regions. The last section presents the final conclusions, containing a summary of the proposed work and suggestions for future research.
6 Conclusions
The use of BRIC as an urban resilience measurement and quantification tool proved to be appropriate in the case of Porto Alegre and its participatory budgeting regions, but with biases. In addition to finding restrictions for the resilience of the city and PBRs, it was also possible to identify potential focal points in the tool itself so that there would be in the future an increase in the city’s resilience as a whole. The tool presented constraints under different aspects. The research identified aspects of regions, their sub-components and variables considered constraints to the resilience of the city; aspects of sub-components and variables as constraints to the resilience of regions; aspects of municipal policies as constraints to the resilience of the city; and aspects of the tool itself as a constraint to the increase of the resilience of the city.
Regions, their sub-components and variables were detailed in the analysis of the results. It was possible to identify the Ilhas region (islands) as a potential focus point to increase the resilience of Porto Alegre, evidencing the need for more data to identify more specific constraints, without neglecting a need to improve the social and economic conditions of the region. The tool enables practitioners to perform a more critical and detailed analysis of variables, sub-components, regions and the city as a whole, making the focalization process less complicated. However, in a case such as Ilhas (islands), where data are lacking, it is necessary to act to obtain the missing information. Otherwise, identification and analysis of the detail level of the categories becomes impossible. Nevertheless, the lack of information does not eliminate the likelihood that the Ilhas region (islands) is a potential constraint to the resilience of the city.
As for city data, it is important to note that, although the municipality has good initiatives, such as the Observatory of the City of Porto Alegre and the #DataPoA, a departmentalization was observed among the secretariats regarding contacting people connected to the city. In other words, the information is not centralized or common to everyone and every administrative department, but restricted to some divisions of the municipal administration. This also reflects the lack of standardization of information, requiring a cautious treatment after collecting the data so that there will be no deviations or loss of information.
The date of the information used in the indicator may also be a limitation. The origin of this constraint is in the tool itself, since it uses public data mostly from census surveys. Some of the information can still date from the year 2000 and the indicator makes no restrictions on the use of outdated data nor restricts the combined use of variables measured in different years. The BRIC also presents problems for the its adequacy, as reported by Frazier et al. (2013) and Singh-Peterson et al. (2014) in scenarios or regions other than the United States. It is also important to point out that, due to the calculation method, values without data negatively impact the results, as observed for the sub-component institutional resilience. Furthermore, due to utilization of scales, the lack of data or the use of inconsistent data prior to the normalization may significantly affect the results of other regions, causing inconsistent outcomes. It is important to notice that the PBR’s are not homogeneous; the regions may consist of mixed smaller areas (e.g. neighborhoods) that might present population from upper, middle and lower classes. The analysis made through the participatory budget regions point of view is an important step to the whole city analysis, allowing to focus at the major problems of the city, even though the intern heterenogeity still exists.
Prominence was given to three constraints considered more significant to or impacting on the result of the city resilience. They were detailed and adjusted according to the concepts studied in the TOC, providing insights to improve not only the city’s resilience, but also the application and reapplication of BRIC to other cities and/or regions. It is believed that, if the TOC’s five focusing steps process is applied as suggested in the work, the tool may satisfactorily assist in increasing the resilience of Porto Alegre and other cities as well.
In general, the indicator shows positive results regarding the increase in Porto Alegre urban resilience. The identification of three main points to be observed in the future may serve as future problems for the development of new research is a contribution of this work. (a) The conduct and development of a clear and defined risk mitigation policy for the city of Porto Alegre and for participatory budgeting regions, (b) the need to treat Ilhas (islands) as an independent PBR equal to other regions, and (c) the improvement of the BRIC indicator to provide a more reliable adaptation to local realities, such as replacing the specific USA variables, mainly in the institutional and infrastructure levels, with other variables – sustained by literature research or empirical validation – that would better reflect the reality of Porto Alegre (e.g.: access to basic public services as water supply and sewage, violence indicators and afforestation around edifications). The combination of these points would allow the creation of a robust and credible tool to assist and support local management decisions aiming an increased resiliency of Porto Alegre as a whole and over time.
Appendix A
BRIC Variables
| Category | Variable | Suggestion/adjustment for PoA | Source | Condition | |
|---|---|---|---|---|---|
| 1. Social Resilience | |||||
| 1.1 | Educational equality | Absolute negative percentage difference between the population with undergraduate degrees and population with less education than high school | IBGE (2010)* | ✔ | |
| 1.2 | Age | Non-elderly population | ObservaPoa (2010) | ✔ | |
| 1.3 | Access to transportation | % of the population owning a vehicle/% of households with at least one vehicle | IBGE (2010)* | ✔ | |
| 1.4 | Communication capacity | % of the population with a telephone/% of households with a telephone service | IBGE (2010)* | ✔ | |
| 1.5 | Linguistic competence | % of the population that does not speak English as a second language/% of the population that speak English proficiently | % of non-functional illiterate people responsible per household (from the total of responsible people per household) | ObservaPoa (2000) | ! |
| 1.6 | Special needs | % of the population without sensory, physical or mental disability | ObservaPoa (2010) | ✔ | |
| 1.7 | Medical coverage | Population covered by health insurance/Non-elderly population covered by health insurance | ✘ | ||
| 2. Economic Resilience | |||||
| 2.1 | Housing capital | % of own homes/% of homes occupied by the owner | IBGE (2010)* | ✔ | |
| 2.2 | Employability | % of employed population/% of the employed workforce | IBGE (2010)* | ✔ | |
| 2.3 | Income and equality | GINI coefficient/negative GINI coefficient | ObservaPoa (2010) | ✔ | |
| 2.4 | Single sector employment dependency | % of the population employed in agriculture, fishing, forestry and extractive industries/% of workers not employed in agriculture, fishing, forestry, extractive industries and tourism | IBGE (2010)* | ✔ | |
| 2.5 | Employability | % of female labor force/Absolute negative difference between average male and female income | IBGE (2010)* | ✔ | |
| 2.6 | Size of business | Grees ratio for small business | Porto Alegre Labour Observatory (2012)* | ✔ | |
| 2.7 | Access to health care | Number of doctors per 10,000 inhabitants | ✘ | ||
| 3. Institutional Resilience | |||||
| 3.1 | Mitigation | % of the population covered by a recent disaster mitigation plan/Average spending per capita in mitigation projects | Investments related to environmental studies and mitigation of natural disaster risks | SMGL (2012, 2013)* | ! |
| 3.2 | Flood coverage | % of households covered by NFIP policies (National Flood Insurance Program) | ✘ | ||
| 3.3 | Municipal services | % of municipal spending on police, fire and medical emergencies | Investment related to demands for health per 10,000 inhabitants | DataPoa (2012, 2013) | ! |
| 3.4 | Mitigation | % of the population participating in CRS (Community Rating System for Flood) | ✘ | ||
| 3.5 | Political fragmentation | Number of governments and special districts/Number of governments and special districts per 10,000 inhabitants | Number of civic organizations requesting actions in the PB Investment Plan per 10,000 inhabitants | DataPoa (2012, 2013) | ! |
| 3.6 | Previous disaster experiences | Number of paid disaster declarations/Disaster declaration divided by the number of losses caused by the disaster | ✘ | ||
| 3.7 | Mitigation and social connectivity | % of the population covered by some corporate citizen plan/% of the population in communities with citizen corporations | ✘ | ||
| 3.8 | Mitigation | % of the population in StormReady Communities | ✘ | ||
| 4. Infrastructure Resilience | |||||
| 4.1 | Type of housing | % of not mobile homes/% of homes are not prefabricated | Percentage of population living in slums | IBGE (2010)* | ! |
| 4.2 | Shelter capacity | % of vacant rentable real state/% of units that are vacant for rent (real estate) | ✘ | ||
| 4.3 | Medical capacity | Number of hospital beds per 10,000 inhabitants | Number of basic health units per 10,000 inhabitants | DataPoa (2013)* | ✘ |
| 4.4 | Evacuation potential | Main roads for evacuation per 10,000 inhabitants | Percentage of paving surrounding households | IBGE (2010)* | ! |
| 4.5 | Quality of housing construction | % of houses not built before 1970 and after 1994/% of houses built up to 1970 or after 2000 | Houses built using masonry | IBGE (2010)* | ! |
| 4.6 | Need for shelters | Number of hotels/motels per square mile/Hotels/motels per 10,000 inhabitants | SMIC (2016)* | ✔ | |
| 4.7 | Recovery | Number of public schools per square mile/Public schools per 10,000 inhabitants | INEP (2014)* | ✔ | |
| 5. Community Capital | |||||
| 5.1 | Adherence to the location | Net international migration/% of non-native population who came to the USA in the last 5 years | Number of international emigrants per 1,000 inhabitants | IBGE (2010)* | ! |
| 5.2 | Adherence to the location | % of the population born in a state who still resides in the same state/% of the population born in the current residence state | % of the resident population born in the city | IBGE (2010)* | ! |
| 5.3 | Political engagement | % of voters in 2004/% of population with voting age who participated in the presidential election | % of the population participating in regional participatory budgeting assemblies | ObservaPoa (2015) | ! |
| 5.4 | Social capital – religion | Number of religious adherents per 10,000 inhabitants/People affiliated to a religious organization per 10,000 inhabitants | ✘ | ||
| 5.5 | Social capital – civic engagement | Number of civic organizations per 10,000 inhabitants | SMIC (2016)* | ✔ | |
| 5.6 | Social capital – law | Number of law civic organizations per 10,000 inhabitants | Number of solidary economic enterprises | Porto Alegre Labor Observatory (2012)* | ! |
| 5.7 | Innovation | % of the population employed in creative occupations | IBGE (2010)* | ✔ | |
Source: Prepared by the author.
*: data adjusted to budget regions.
✔: variable equal to the original;
!: adjusted/changed variable;
✘: variable not found/available;
/(following description): variable description presented in the second version of the BRIC.
References
Resilient Cities. 2016. “100 RC.” http://www.100resilientcities.org/#/-_/.Search in Google Scholar
Arnall, Alex. 2015. “Resilience as Transformative Capacity: Exploring the Quadripartite Cycle of Structuration in a Mozambican Resettlement Programme.” Geoforum 66: 26–36.10.1016/j.geoforum.2015.08.015Search in Google Scholar
Avritzer, Leonardo 2002. “Modelos de Deliberação Democrática: Uma Análise Do Orçamento Participativo No Brasil.”. In Democratizar a Democracia: Os Caminhos Da Democracia Participativa. Vol. 1, 561–97.Search in Google Scholar
Bambara, G., L. Peyras, H. Felix, and D. Serre. 2015. “Developing a Functional Model for Cities Impacted by a Natural Hazard: Application to a City Affected by Flooding.” Natural Hazards and Earth System Science 15 (3): 603–615.10.5194/nhess-15-603-2015Search in Google Scholar
Barnard, Alan, and Raimond E. Immelman. 2013. “Estudo de Caso Sobre Implementações Holísticas Da TOC: Constatações No Setor Público E Privado.” In Handbook Da Teoria Das Restrições, edited by James F. Cox III and John G. Schleier, 469–513. Porto Alegre: Bookman.Search in Google Scholar
Bhamra, Ran, Samir Dani, Kevin Burnard. 2011. “Resilience: the concept, a literature review and future directions.” International Journal of Production Research 49 (18): 5375–5393.10.1080/00207543.2011.563826.Search in Google Scholar
Boin, Arjen, Louise K. Comfort, and Chris C. Demchak. 2010. “The Rise of Resilience.” Designing Resilience 1–12.10.2307/j.ctt5hjq0c.5Search in Google Scholar
Cauchick Miguel, Paulo A., and Rui Sousa. 2012. “O Método Do Estudo de Caso Na Engenharia de Produção.” In Metodologia de Pesquisa Em Engenharia de Produção E Gestão de Operações. 2. ed., 131–48. Rio de Janeiro: Elsevier.Search in Google Scholar
Chou, Ying-Chyi, Ching-Hua Lu, and Ya-Yun Tang. 2012. “Identifying Inventory Problems in the Aerospace Industry Using the Theory of Constraints.” International Journal of Production Research 50 (16): 4686–4698.10.1080/00207543.2011.631598Search in Google Scholar
Christopherson, Susan, Jonathan Michie, and Peter Tyler. 2010. “Regional Resilience: Theoretical and Empirical Perspectives.” Cambridge Journal of Regions, Economy and Society 3 (1): 3–10.10.1093/cjres/rsq004Search in Google Scholar
Čiegis, Remigijus, and Edmunds Jasinska. 2006. “Theory of Constraints and Its Usage to Evaluate the Governmental Support for Business.” Engineering Economics 49 (4): 57–62.Search in Google Scholar
Cutter, Susan L., Lindsey Barnes, Melissa Berry, Christopher Burton, Elijah Evans, Eric Tate, and Jennifer Webb. 2008. “A Place-Based Model for Understanding Community Resilience to Natural Disasters.” Global Environmental Change 18 (4): 598–606.10.1016/j.gloenvcha.2008.07.013Search in Google Scholar
Cutter, Susan L., Christopher G. Burton, and Christopher T. Emrich. 2010. “Disaster Resilience Indicators for Benchmarking Baseline Conditions.” Journal of Homeland Security and Emergency Management 7 (1): 1–22. DOI: 10.2202/1547-7355.1732.Search in Google Scholar
Cutter, Susan L., Kevin D. Ash, and Christopher T. Emrich. 2014. “The Geographies of Community Disaster Resilience.” Global Environmental Change 29: 65–77.10.1016/j.gloenvcha.2014.08.005Search in Google Scholar
Desouza, Kevin C., and Trevor H. Flanery. 2013. “Designing, Planning, and Managing Resilient Cities: A Conceptual Framework.” Cities 35: 89–99.10.1016/j.cities.2013.06.003Search in Google Scholar
Dyer Jr., G. W., and A. L. Wilkins. 1991. “Better stories, no better constructs, to generate better theory: a rejoinder to Eisenhardt.” Academy of Management Review 16 (3): 613–619.10.5465/amr.1991.4279492Search in Google Scholar
Dieleman, Hans. 2013. “Organizational Learning for Resilient Cities, through Realizing Eco-Cultural Innovations.” Journal of Cleaner Production 50: 171–80.10.1016/j.jclepro.2012.11.027Search in Google Scholar
Dresch, Aline, Daniel Pacheco Lacerda, José Antônio Valle Antunes, and Jose Antonio Valle Antunes Junior. 2015. Design Science Research: Método de Pesquisa Para O Avanço Da Ciência E Tecnologia. 1st ed. Porto Alegre: Bookman.10.1007/978-3-319-07374-3Search in Google Scholar
Ellram, Lisa M. 1996. “The Use of the Case Study Method in Logistics Research.” Journal of business logistics 17 (2): 93–138.Search in Google Scholar
Frazier, Tim G., Courtney M. Thompson, Ray J. Dezzani, and Danielle Butsick. 2013. “Spatial and Temporal Quantification of Resilience at the Community Scale.” Applied Geography 42: 95–107.10.1016/j.apgeog.2013.05.004Search in Google Scholar
Lemos, Frederico Pacheco. 2011. “A experiência do Fórum Social Mundial e sua importância para a mobilização social.” Perspectiva Sociológica 6: 252–261. 10.33025/rps.v0i10.1397Search in Google Scholar
Furtado, Jorge. 1989. Ilha Das Flores. Brasil: Casa de Cinema de Porto Alegre.Search in Google Scholar
Gerchmann, Léo. 2004. “Consultoria Coloca Porto Alegre Entre as 24 ‘cidades Do Futuro’ No Mundo.” FOLHA DE S.PAULO.Search in Google Scholar
Gibson, Carl A., and Michael Tarrant. 2010. “A ‘Conceptual Models’ Approach to Organisational Resilience.” The Australian Journal of Emergency Management 25 (2): 6–12.Search in Google Scholar
Goldratt, Eliyahu M. 1988. “Computerized Shop Floor Scheduling.” International Journal of Production Research 26 (3): 443–455.10.1080/00207548808947875Search in Google Scholar
Goldratt, Eliyahu M. 2010. “Introduction to TOC – My Perspective.” In Theory of Constraints Handbook, edited by J. F Cox III and J. G Schleier Jr. 1st ed., 3–9. New York: McGraw-Hill.Search in Google Scholar
Gonzatto, Marcelo. 2015. “Cheia Atinge 2 Mil Pessoas Nas Ilhas de Porto Alegre – Zero Hora.” Zero Hora.Search in Google Scholar
Google Maps. 2016. “Regiões Do Orçamento Participativo.” Google.Search in Google Scholar
Hill, Edward, Howard Wial, and Harold Wolman. 2008. “Exploring Regional Economic Resilience.” Working Paper, Berkley IURD, no. June: 1–22.Search in Google Scholar
Hollnagel, Erik, David D. Woods, and Nancy Leveson. 2006. Resilience Engineering: Concepts and Precepts. Hampshire: Ashgate.Search in Google Scholar
Hudson, Ray. 2010. “Resilient Regions in an Uncertain World: Wishful Thinking or a Practical Reality?” Cambridge Journal of Regions, Economy and Society 3 (1): 11–25.10.1093/cjres/rsp026Search in Google Scholar
IBGE. 2010. “Censo Demográfico.” Instituto Brasileiro de Geografia E Estatística.Search in Google Scholar
Kim, Seonmin, Victoria Jane Mabin, and John Davies. 2008. “The Theory of Constraints Thinking Processes: Retrospect and Prospect.” International Journal of Operations & Production Management 28 (2): 155–184.10.1108/01443570810846883Search in Google Scholar
Lacerda, Daniel Pacheco, Aline Dresch, Adriano Proença, and José Antonio Valle Antunes Júnior. 2013. “Design Science Research: Método de Pesquisa Para a Engenharia de Produção.” Gestão & Produção 20: 741–61.10.1590/S0104-530X2013005000014Search in Google Scholar
Marshall, N., and P. Marshall. 2007. “Conceptualizing and Operationalizing Social Resilience within Commercial Fisheries in Northern Australia.” Ecology And Society 12 (1): 1.10.5751/ES-01940-120101Search in Google Scholar
Masten, A. S. 2001. “Ordinary Magic. Resilience Processes in Development.” The American Psychologist 56 (3): 227–238.10.1037/0003-066X.56.3.227Search in Google Scholar
Miles, S. B., and S. E. Chang. 2008. “ResilUS – Modeling Community Capital Loss And Recovery.” The 14th World Conference on Earthquake Engineering, Não paginado.Search in Google Scholar
Norris, Fran H., Susan P. Stevens, Betty Pfefferbaum, Karen F. Wyche, and Rose L. Pfefferbaum. 2008. “Community Resilience as a Metaphor, Theory, Set of Capacities, and Strategy for Disaster Readiness.” American Journal of Community Psychology 41 (1–2): 127–50.10.1007/s10464-007-9156-6Search in Google Scholar
Participatory Budgeting Project. 2016. https://www.participatorybudgeting.org/what-is-pb/.Search in Google Scholar
Paton, Douglas. 2007. “Measuring and Monitoring Resilience in Auckland.” GNS Science Report 2007 (18): 88.Search in Google Scholar
Paula, Gabrielle de, Luís Felipe Abreu, and Yamini Benites. 2015. “Ilha Dos Marinheiros: À Margem de Porto Alegre.” Agência Pública.Search in Google Scholar
Pickett, Steward T. A., Brian McGrath, M. L. Cadenasso, and Alexander J. Felson. 2014. “Ecological Resilience and Resilient Cities.” Building Research & Information 42 (2): 143–157.10.1080/09613218.2014.850600Search in Google Scholar
PMPA. n.d. “Orçamento Participativo.” Prefeitura Municipal de Porto Alegre.Search in Google Scholar
Pretorius, Pieter. 2014. “Introducing in-between Decision Points to TOC ’ S Five Focusing Steps.” International Journal of Production Research 52 (2): 496–506.10.1080/00207543.2013.836612Search in Google Scholar
Programa de Cidades Sustentáveis. 2016. “Orçamento Participativo.” http://www.cidadessustentaveis.org.br/boas-praticas/orcamento-participativo-op.Search in Google Scholar
Robbins, W.A. 2011. “Process Improvement in the Public Sector: A Case for the Theory of Constraints.” Journal of Government Financial Management 60 (2): 40–46.Search in Google Scholar
Ronen, Boaz, and Shimeon Pass. 2013. “Gerenciamento de Serviços.” In Handbook Da Teoria Das Restrições, edited by James F. Cox III and John G. Schleier, 867–80. Porto Alegre: Bookman.Search in Google Scholar
Sander, Isabella. 2015. “Porto Alegre Tenta Se Reerguer Após Enchente.” Jornal Do Comércio.Search in Google Scholar
Seville, Erica, David Brunsdon, Andre Dantas, Jason Le Masurier, Suzanne Wilkinson, John Vargo. 2008. “Organisational Resilience: Researching the Reality of New Zealand Organisations.” Journal of Business Continuity & Emergency Planning 2 (2): 258–266. Search in Google Scholar
Shah, Anwar. 2007. Participatory Budgeting, edited by Anwar Shah. New York: The World Bank.10.1596/978-0-8213-6923-4Search in Google Scholar
Sherrieb, Kathleen, Fran H. Norris, and Sandro Galea. 2010. “Measuring Capacities for Community Resilience.” Social Indicators Research 99 (2): 227–247.10.1007/s11205-010-9576-9Search in Google Scholar
Singh-Peterson, Lila, Paul Salmon, Natassia Goode, and John Gallina. 2014. “Translation and Evaluation of the Baseline Resilience Indicators for Communities on the Sunshine Coast, Queensland Australia.” International Journal of Disaster Risk Reduction 10: 116–26.10.1016/j.ijdrr.2014.07.004Search in Google Scholar
Souza, Dalva Inês De, Deise Margô Müller, Maria Angélica Thiele Fracassi, and Solange Bianco Borges Romeiro. 2013. “Manual de Orientações Para Projetos de Pesquisa.” Fundação Escola Técnica Liberato Salzano Vieira Da Cunha.Search in Google Scholar
Starr, R., J. Newfrock, M. Delurey. 2003. “Enterprise Resilience: Managing Risk in the Networked Economy.” Strategy and Business (30): 70–79. http://www.boozallen.com/media/file/Enterprise_Resilience_Report.pdf.Search in Google Scholar
Stevenson, Joanne R., John Vargo, Vivienne Ivory, Chris Bowie, and Suzanne Wilkinson. 2015. “Resilience Benchmarking & Monitoring Review.” Resilience to Nature’s Challenges.Search in Google Scholar
Sun, Hongyi, and Jonathan D. Linton. 2014. “Structuring Papers for Success: Making Your Paper More like a High Impact Publication than a Desk Reject.” Technovation 34 (10): 571–573.10.1016/j.technovation.2014.07.008Search in Google Scholar
Tarabusi, Enrico Casadio, and Giulio Guarini. 2013. “An Unbalance Adjustment Method for Development Indicators.” Social Indicators Research 112 (1): 19–45.10.1007/s11205-012-0070-4Search in Google Scholar
Taylor, Lloyd J., Brian J. Moersch, and Geralyn McClure Franklin. 2003. “Applying the Theory of Constraints to a Public Safety Hiring Process.” Public Personnel Management. 32 (3): 367–382.10.1177/009102600303200304Search in Google Scholar
The World Bank. 2010. “The World Bank.” http://beta.worldbank.org/pt/news/press-release/2010/05/13/america-latina-avanca-mas-persiste-distancia-em-relacao-aos-paises-ricos.Search in Google Scholar
Tulasi, Ch. Lakshmi, and A Ramakrishna Rao. 2012. “Review on Theory of Constraints.” International Journal of Advances in Engineering & Technology 3 (1): 334–344.Search in Google Scholar
UNISDR. 2014. “Disaster Resilience Scorecard for Cities.” The United Nations Office for Disaster Reduction, no. Version 1.5: 56.Search in Google Scholar
UNISDR. 2015. “Disaster Resilience Scorecard for Cities.” The United Nations Office for Disaster Reduction.Search in Google Scholar
Vale, Lawrence J. 2014. “The Politics of Resilient Cities: Whose Resilience and Whose City?” Building Research & Information 42: 37–41.10.1080/09613218.2014.850602Search in Google Scholar
Wadhwa, Gary. 2013. “Visão Viável Para Sistemas de Saúde.” In Handbook Da Teoria Das Restrições, edited by James F. Cox III and John G. Schleier, 924–80. Porto Alegre: Bookman.Search in Google Scholar
Walsh, Daniel P. 2013. “Ambientes Complexos.” In Handbook Da Teoria Das Restrições, edited by James F. Cox III and John G. Schleier, 1075–1094. Porto Alegre: Bookman.Search in Google Scholar
Weichselgartner, J., and I. Kelman. 2014. “Challenges and opportunities for building urban resilience.” A|Z ITU Journal of the Faculty of Architecture 11 (1): 20–35. Search in Google Scholar
Woods, David D. 2015. “Four Concepts for Resilience and the Implications for the Future of Resilience Engineering.” Reliability Engineering & System Safety 141: 5–9.10.1016/j.ress.2015.03.018Search in Google Scholar
Yin, Robert K. 2013. Case Study Research: Design and Methods., 5th ed. California: SAGE Publications .Search in Google Scholar
Zero Hora. 2011. “Porto Alegre Terá Cinco Jogos Pela Copa Do Mundo de 2014 – Zero Hora.” Zero Hora.Search in Google Scholar
©2017 Walter de Gruyter GmbH, Berlin/Boston