
Abstract
The electrohydrodynamic atomization (EHDA) process is a method of forming liquid droplets or jets in a solution under an electric field. Molecular dynamics simulations were used in this study to reveal the EHDA dripping mode at a microscopic level. In this study, we investigated whether a liquid contains ions under the influence of a 1 V·nm−1 electric field that affects the dipole direction of water molecules to explore the cause of the dripping mode. It was hypothesized that the presence of ions would disrupt the local electric field distribution, causing liquid rupture. Furthermore, we observed the jetting behavior under varying ion concentrations and identified jetting instability. To solve this problem, the pre-load voltage method was used to control the distribution of ions in the solution, thus effectively increasing the ion concentration at the nanotube opening. In this study, we also investigated the movement behavior of ions in solution under different pre-load voltages, leading to a stable dripping mode under different ion concentrations. This study offers microscale mechanism research perspectives for EHDA and can be used in future studies for parameter setting and optimization.
1 Introduction
Electrohydrodynamic atomization (EHDA) is also known as electrospray or electrospinning, depending on the specific application. EHDA involves the use of a voltage electric field applied to a liquid that is delivered through a nozzle, which causes the fluid to form highly charged aerosols of droplets having a specific size range. In this process, the electric field overcomes the surface tension of the liquid and forces it into a cone shape, which is called the “Taylor cone” [1,2]. As this cone is elongated and deformed, it ultimately ejects a very fine-charged spray. The droplets, which are highly charged, are then directed toward a substrate by manipulating the electric field and deposited as a uniform layer on the substrate. EHDA has several applications in fields such as EHD printing [3], material sciences, biological research, and analytical chemistry [4,5,6,7].
Injection of EHDA can be divided into two modes based on the geometric shape of the liquid at the nozzle outlet [8]: (i) dripping mode (only liquid fragments are ejected from the nozzle) and (ii) jetting mode (liquid is continuously ejected from the nozzle). Rai et al. [9] found that, unlike the neutral properties of the droplets in the AC spray, the charge carried by the droplets in the DC spray increased or decreased sharply with the change in the electric spray mode. According to Wang et al. [10], the transition of jet fragmentation is significantly influenced by the flow rate. In the stable cone jet mode, an increase in the liquid flow rate or a decrease in the electric potential leads to a proportional increase in the droplet size. Li et al. [11] reported that as the electric potential increases, the droplet diameter decreases and the gas–liquid contact interface area significantly increases. As the electric potential increases, the specific charge increases, which can uniformly distribute the charged droplets within the nozzle. The typical modes are shown in Figure 1.

The typical EHDA modes.
The jetting mode refers to a spraying technique in electrostatic spraying that has been utilized in various industrial applications. Examples of these applications include paint and print spraying, core–shell structured nanoparticles, and thin catalyst layers [12,13,14]. Additionally, the jetting mode has shown its effectiveness in producing high-performance thermal barrier coatings and polymer microspheres as microcarrier matrices for fabric coating [10].
In the dripping mode, high electric charge sprays in the range of several to tens of micrometers or even nanometers can be generated [15]. However, droplets with sizes ranging from tens to hundreds of micrometers are usually much smaller than the nozzle diameter and are frequently used in many industrial fields, especially in inkjet technology, due to their fast and efficient operation, relatively low cost, and ability to print highly complex patterns on a large scale [16]. Fortunately, in a certain voltage range and wider flow rate, the microdroplet leaking mode can be observed. For a fixed capillary, the equivalent diameter range of microdroplets is from 0.05d 0 to 0.85d 0 [17]. If a capillary with a much smaller diameter can be adopted, smaller droplets can be atomized. Moreover, the diameter and generation frequency of monodisperse droplets can be controlled via the flow rate and applied voltage [18]. This means that monodisperse droplets with diameters in the range of tens to hundreds of micrometers can be completely ejected from the capillary.
The current state of research shows that the majority of studies are focused on the jetting mode [11,19,20]. Extensive research has been carried out to understand the dynamics and macroscopic physical mechanisms involved in the formation, evolution, and fracture instability of conical and simple jets. Atomization characteristics of stable jets have also been studied in detail [19,21,22,23]. However, previous studies have focused less on the micro-mechanisms of the dripping mode.
Molecular dynamics (MD) simulation is a significant tool for studying and analyzing the behavior and interactions of atoms and molecules at the atomic level [24,25]. The simulation allows scientists to investigate phenomena that are difficult to observe experimentally, such as the movement of atoms, bond formation and breaking, and chemical reactions in real-time at the atomic level [26,27,28]. In recent years, MD simulations have been utilized by some researchers to investigate the behavior of liquids under electric fields [29,30]. Song et al. [31] used MD to establish a fusion model of two liquid droplets under an electric field. The study showed that when the electric field increases to 0.80 V·nm−1 or remains above 0.80 V·nm−1, a strong electric field causes the entire fragmentation process of the liquid droplet, and ion jets occur before the droplets contact. Zheng et al. [32] proposed that in the nano-scale electrospray system, the sensitivity of ion distribution to the two types of forces, namely electric field stress and surface tension, is higher than that in the macro-scale electrospray systems. Li et al. [33] suggested that with the increase of NaCl ion concentration, the size of ethanol droplets increases gradually. The study also depicted that the movement of cations and jet rupture are interrelated.
The main problems in the theoretical research of EHDA using MD models include the following: the model did not consider the solution extrusion behavior caused by changes in the diameter of the guide nozzle; the influence of electric field on ions was only considered without considering the jet model; and the electric field setting relied on macroscopic empirical formulas and was not simulated under different voltages.
In conclusion, many studies have been conducted on EHDA, yet some problems remain. Earlier studies have primarily focused at the macroscopic level, relying upon fluid mechanics continuity equations that inadequately address microscopic mechanisms. Although most of the studies were focused on the EHDA jetting mode, a few studies have examined the dripping mode. At the nanoscale, the problems that need to be addressed are how the electric field affects the jetting behavior and how the jetting behavior can be improved. In this study, we proposed a method for analyzing the microscale EHDA dripping mode to address these problems. We modeled the EHDA process using MD simulations, with NaCl solution as the liquid medium, cylindrical CNTs as nozzles, and an external electric field as a driving force. Simulation results showed that the ion effects on hydrogen bonds led to the disintegration of sprayed fluids, as verified in recent studies. Moreover, some results that have not been mentioned in earlier studies were observed, such as the variability of ion concentration under microscale conditions that make the dripping mode highly unstable. To enhance spray stability, in this study, we have proposed a pre-load voltage method that led to a more stable dripping mode spray behavior.
2 MD simulation model and method
2.1 Experimental platform
This study aims to utilize MD to explain macroscopic experimental phenomena. Figure 2 shows the schematic diagram of the experimental platform, which features a high-voltage power supply capable of outputting an adjustable voltage of 0–3,000 V under computer control. The system is equipped with liquid and pressure regulation via a syringe pump. The liquid is drawn out of a capillary tube and deposited onto the substrate via an electric field. The whole jetting process is captured by a high-speed camera. We have adopted a new method that utilizes three voltage rings to control the loading of electric fields. The two upper rings form the pre-voltage, while the two lower rings form the externally applied electric field. By connecting different voltage sources to the top and bottom rings, we can achieve the loading method described in this study. Various jetting modes and instability in the process were observed in the experiment as shown in Figure 3. A previous study has explored the reasons for different modes of production from a macroscopic analytical perspective. To further elucidate the principles of liquid droplet rupture and stable dripping mode production through a microscopic approach, an MD simulation model is established in this study.

(a) The EHDA experimental platform and (b) the voltage loading method.

Development process of EHDA: (a) dripping mode and (b) jetting mode.
2.2 Model construction
The EHDA spraying model was established using the LAMMPS software series [34]. The model is shown in Figure 4. The simulation box was set at 10 nm × 10 nm × 50 nm. An aqueous NaCl solution was filled between two carbon nanometer plates, containing water molecules, Na ions, and Cl ions. The carbon nanometer plate on the left was able to move freely to accommodate subsequent relaxing processes. The water molecules were modeled using the SPC/E model, which has been widely applied in electrolyte aqueous solutions [35,36,37]. The hydrogen–oxygen bond length of water was set as 1 Å. The hydrogen–oxygen–hydrogen bond angle was set as 109.47°, and the charge for hydrogen was set as 0.4238e. There were 16,140 water molecules in total. The Na atoms were set as positively charged and the Cl atoms as negatively charged. The ions were randomly added to the aqueous solution to reduce the simulation time, and ion molality was determined by the number of ions. The masses of the atoms we used are shown in Table 1.

The simulation model.
Atomic weight of atoms
| Atom type | H | O | Na | Cl | Cu |
|---|---|---|---|---|---|
| Atomic mass units (%) | 1.00797 | 15.9994 | 12.01115 | 35.453 | 63.546 |
In order to reduce the number of atoms and reference a model from the previous study for establishing a single-walled carbon nanotube [32], the nozzle diameter was set at 3.7 nm. The copper substrate was composed of two layers of Cu atoms to collect the liquid. A monolayer graphene sheet was constructed. Next, a circular hole was cut out at the central position of the graphene sheet, based on the nozzle diameter. Then, excess atoms were removed from the edge portion to eliminate any extra carbon atoms inside the nozzle. Subsequently, the graphene sheet was duplicated and the atom positions at the top of the carbon nanotube were relocated to the location of the left circular hole in the graphene sheet. The electric field direction was along the positive X-axis. Boundary conditions were set as periodic boundary conditions (PBC) in the x, y, and z directions [28,38,39]. In MD simulation, PBC are commonly used to calculate properties of bulk gases, liquids, crystals, or mixtures. One common application of PBC is to simulate solvated macromolecules in a bath of explicit solvent. Additionally, the Born–von Karman boundary conditions represent PBC for a specific system. From a technical perspective, PBC necessitate that the unit cell is a shape that can perfectly tile into a three-dimensional crystal [40]. Consequently, a spherical or elliptical droplet cannot be utilized. The most common and intuitive choice is a cube or rectangular prism, although this can be computationally expensive due to the unnecessary presence of solvent molecules in the corners, which are far from the central macromolecules. To overcome this issue, a commonly employed alternative is the truncated octahedron, which requires less volume. In recent years, the PBC have been applied in research related to nanotubes and microchannel fluids [41,42].
The timestep was set as 1 fs. The system was allowed to equilibrate under NPT conditions for 2 ns, and then an electric field was applied. Under the influence of the electric field, the liquid can be pulled out of the pipeline to form a Taylor cone, which ultimately becomes a liquid droplet. The radial distribution function (RDF) of O–H in the equilibrium process from 50 to 250 ps is shown in Figure 5. The first peak gradually increases with the equilibrium process and eventually stabilizes at about 110. The system tends to stabilize after 200 ps.

The RDF of O–H in the equilibrium process.
2.3 Potential and force computing in the simulation
The interatomic interaction force was calculated using the standard 12/6 Lennard-Jones (LJ) potential field [43]:
where r ab is the distance between atoms A and B, σ and ε are the LJ parameters between atoms, and the LJ parameters C 12 and C 6 can be expressed as
The electric field force during the movement of the electric current fluid consists of three parts: the electric field force generated by the polarization of water molecules, the interaction force between ions, and the electric field force generated by the external environment. The expression for the electric potential is given as follows:
where
The polarizing electric field force of water molecules and the electric field force of ions can be determined based on the electric field intensity of each atom:
where
where erfc and erf are error functions and complementary error function terms, respectively. Previous studies have shown that this method produces results with a high degree of similarity to the results obtained using Ewald summation.
The capillary wave fluctuation method [45] is a technique used to calculate the surface tension of liquids by MD simulations. This method is based on the idea that height fluctuations of the liquid–vapor interface are correlated with the surface tension of the liquid:
where P yy and P zz are the diagonal elements of the pressure–stress tensor, L x is the length of the cell in the x direction, and the initial factor of 1/2 arises because there are two fluid interfaces in the cell.
3 Results and discussion
3.1 EHDA dripping process
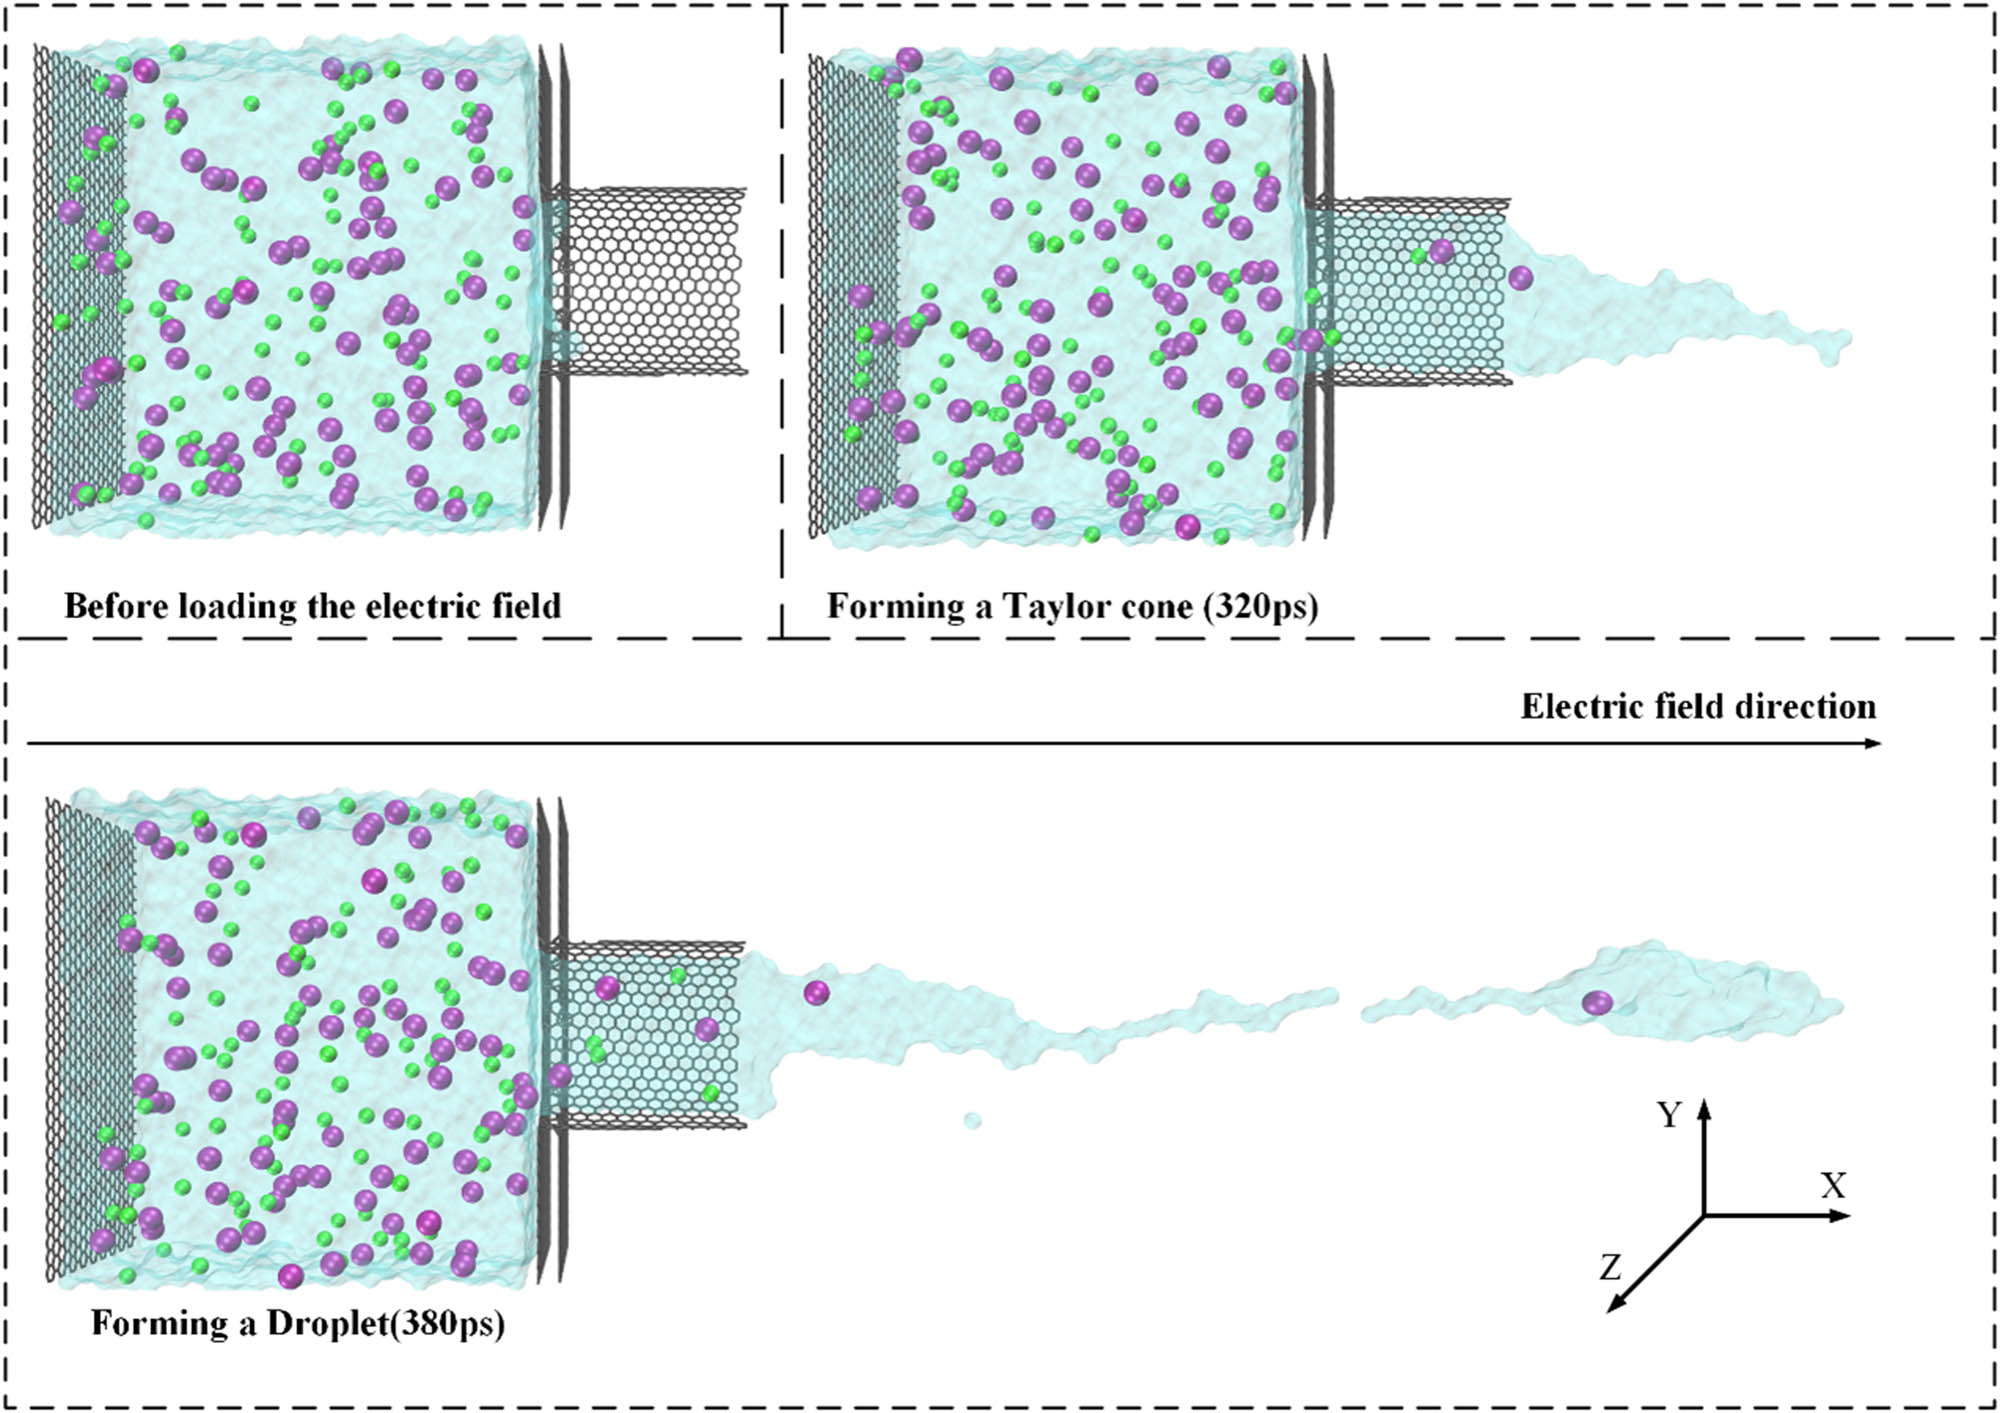
The complete process of the dripping mode is shown in Figure 6. The simulation results can be post-processed and rendered using VMD software. After applying the electric field, the liquid is pulled out of the nanotube and it forms a Taylor cone under the action of an electric field force. If the droplet does not break, the liquid will develop into a jet under the driving force of the electric field, which is known as the jetting mode. If the Taylor cone breaks and forms droplets, it is called the dripping mode.
The dripping process of EHDA simulation.
The loaded electric field should be able to pull the liquid out of the nanotube and form a Taylor cone. The voltage can be calculated at the macro level. At the nanoscale, as shown in Figure 7, under a field strength of <0.8 V·nm−1, the electric field cannot pull the liquid out of the nanotube, while at a field strength >2 V·nm−1, Na ions can overcome the force of water molecules and migrate out of water molecule clusters [31]. In this section, we chose voltages of 0.2, 0.4, 0.6, 0.8, and 1 V·nm−1, and calculated the position of the liquid in the direction of the X-axis at different times. It is known that when the strength of the electric field is <0.8 V·nm−1, the liquid will eventually stay at the nanotube mouth and cannot be pulled out. Based on existing research and simulation results, we chose 1 V·nm−1 as the simulation condition in this section.

The time-dependent changes in the solution under different electric field strengths.
To simulate different concentrations of NaCl solution, several Na and Cl ions were added to the water. As shown in Figure 8, a Na ion can be seen in the Taylor cone under high ion concentrations, while the Taylor cone did not contain Na ions under low ion concentrations. Under high ion concentrations after the liquid formed a Taylor cone, it broke and sprayed out in the form of droplets, which is known as the dripping mode, while under low ion concentrations, the liquid formed a continuous jet, which is known as the jetting mode.

Na ions in a Taylor cone.
3.2 Influence of ions on the orientation and atomic stress of water molecule dipole moments
When water molecules are subject to an electric field force, their dipole directions change. In order to explain the effect of the dipole moment change on the EHDA process, two angles, α and β, are defined as shown in Figure 9. α is the angle between the dipole moment direction of the water molecule and the X-axis (electric field direction), and β is the angle between the dipole moment direction of the water molecule and the line connecting oxygen and Na ions in the water molecule.

Diagram of α and β angles.
The dipole moment direction of the water molecule cluster in the Taylor cone was analyzed and calculated. The α angle distribution diagram of 134 water molecules near Na ions was obtained, as shown in Figure 10. For comparison, we analyzed the α angles under the same position and low ion concentrations and obtained the statistical diagram of the overall distribution with the distance of Na ions and the statistical diagram of α angles.

The α angle distribution.
Under the action of an electric field in the X-axis direction, water molecules rotated due to the electric field force. Most of the dipole moment directions of water molecules and electric field direction had an α angle of <90° as shown in Figure 11. After the addition of Na ions, due to the positive charge of Na ions, oxygen atoms were attracted and hydrogen atoms were repelled, leading to a change in the dipole moment direction of the water molecules. To further analyze the effect of Na ions on the dipole moment direction of water molecules, we calculated the accumulated frequency of the dipole moment direction of water molecules at different distances around high Na ion concentrations and the angle β between Na ions and oxygen atoms. As shown in Figure 12, a water shell was formed around Na ions under the influence of an electrostatic force.

Counts at different α angles.

Cumulative frequency of Na ions.
The development process of the jetting mode in EHDA is a continuous balance of liquid surface tension and electric field force. The development process increases with the increase of liquid surface tension and electric field force. It was observed that the liquid flows along the nozzle wall, forming a depression in the central region, which significantly influences the formation of the Taylor cone and the injection direction. However, under high-field conditions, the impact of capillary effects diminishes, resulting in the rapid formation of the Taylor cone. In other words, there exists a competitive relationship between capillary phenomena and the formation of the Taylor cone, where the development speed depends on the magnitude of the electric field. We calculated the liquid surface tension and electric field force under high ion concentrations, as explained in Section 2. The calculation results are shown in Figure 13.

Changes in the forces during the process of droplet breakup.
In order to further analyze the influence of electric fields on the jetting mode, we conducted seven sets of control experiments at logarithmic ion charge numbers of 100, and under different electric fields of 1.2, 1.4, 1.6, 1.8, 2.0, 2.2, and 2.4 V·nm−1. We calculated the atomic stress in the x-direction and plotted stress cloud maps and curves as shown in Figure 14. From the cloud maps and Figure 14b, we can observe three stages of the jetting process: the initial stage where the electric field starts to pull the solution out of the nozzle, followed by the formation of a Taylor cone in the pipeline, causing the nozzle exit not to come into contact with the solution anymore. Finally, in the jetting stage, the ejection of droplets causes the Taylor cone to undergo a rebound resulting in crescent-shaped oscillations. The vibration of the solution in the pipeline leads to increased local stress. From Figure 14c, we can clearly see the significant impact of the applied field strength on the jetting mode. In the initial stage, the higher voltage field strength causes ions to move more rapidly, resulting in more intense jetting behavior. In the stress distribution, it is evident that oscillations along the x-direction become more pronounced when the voltage exceeds 2.0 V·nm−1, which typically occurs only during the jetting process. In the jetting stage, a higher voltage field strength increases the force on the ions and simultaneously increases the atomic stress received by the nozzle.

Atomic stress in the x-direction. (a) Cloud map of stress at N = 100 and E = 1.2 V·nm−1. (b) Changes in the stress with the jetting process at N = 100 and E = 1.2 V·nm−1. (c) Atom stress under different electric fields.
When the electric field strength is ≤0.8 V·nm−1, the solution will not be drawn out of the nozzle. When the electric field strength is ≥1.0 V·nm−1 but ≤1.6 V·nm−1, the injection is in dripping mode. When the electric field strength is ≥1.6 V·nm−1 but ≤2.0 V·nm−1, the injection is in jetting mode. When the electric field strength ≥2.0 V·nm−1, the injection is in the multi-jet mode. This is consistent with the trend of injection modes presented in Jiyang et al. [46].
Before the droplet broke, the electric field force and surface tension increased synchronously, and the liquid pulled out of the nanotube mouth to form a Taylor cone. Then, the electric field force suddenly decreased, and the liquid broke. The distribution of the electric field force at the liquid breakage was affected by the presence of Na ions. As mentioned earlier, the presence of Na ions affected the dipole moment direction of water molecules, and the change in the dipole moment direction affected the electric field force on other molecules, ultimately leading to the breakpoint and the formation of the dripping mode. Under different ion concentrations, N = 50, 100, 150, 200, 250, and 300 could all sprout droplets, and it was realized that at least one Na ion must be included in the Taylor cone before the droplet breaks. The calculated results are shown in Figure 15.

The moment of droplet fragmentation under different ionic concentrations.
From the previous section, we concluded that to achieve the dripping mode, at least two conditions must be met: first, an appropriate voltage must be selected to enable the liquid to form a Taylor cone at the nanotube mouth; second, at least one Na ion must be included in the Taylor cone. From the analysis of Figure 15, although the dripping mode could be achieved under different ion concentrations, the formation time and the size of the clusters were different. Especially under low ion concentrations, larger clusters were formed. The time for the Taylor cone fracture ranges from 100 to 200 ps, and it is not directly related to the ion concentration. In other words, the ion concentration has a certain influence on the stability of jetting.
The fact that Na ions are required in the Taylor cone for droplet rupture does not mean that Na ions will always be present in the Taylor cone under higher ion concentrations. This is because although ions are uniformly distributed in the solution, it is still uncertain whether ions exist near the nanotube mouth. Even if the ion concentration in the solution is low, the dripping mode can still occur if Na ions are present near the nanotube mouth. Conversely, even when the solution concentration is high, the jetting mode may occur if no Na ions are present near the nanotube root.
3.3 Effect of the pre-load voltage method
If a stable dripping mode is desired, the ion concentration in the nanotube mouth needs to be controlled, which means that the ions in the solution need to be directed toward the vicinity of the nanotube mouth before injection. Generally, external electric fields, pH adjustment, osmotic pressure regulation, temperature control, and other methods can be used to control the directional movement of ions in a solution. In this study, we used the external electric field method to achieve the electrical balance of the solution, and then the injection was executed to obtain the dripping mode. Therefore, it is necessary to determine the strength of the equilibrium electric field.
The electric field strength that drives ions to move in the solution depends on the charge and dielectric constant in the solution. The calculation method for the electric field strength is discussed in Section 2, and the dielectric constant was also analyzed in this study [47]. According to the research results, a field strength of at least 2.5 V·nm−1 is required to drive sodium ions to move. Therefore, the ion logarithm N was set to 100, and the equilibrium electric field strengths were set as 4, 6, 8, and 10 V·nm−1. During simulation, the molar concentration distribution of Na ions was observed along the X-axis in the solution under different electric field strengths. The results are shown in Figure 16. At 500 ps, the ion concentration at the root of the nanotube reached at least 2 mol·L−1 and up to 3.5 mol·L−1. At 1,000 ps, the ion concentration at the root of the nanotube reached at least 3.1 mol·L−1 and up to 4.5 mol·L−1.

The distribution of the ion concentration under different electric field strengths: (a) 0.6 V·nm−1, (b) 0.8 V·nm−1, (c) 1.0 V·nm−1, and (d) 1.2 V·nm−1.
Sodium ions can be controlled to move by the loading voltage so that Na ions can be gathered at the nanotube orifice. In this study, we used 8 V·nm−1 as the pre-load voltage. After applying a pre-load voltage for 500 ps, we reset the injection voltage of EHDA to 1 V·nm−1 and then started injection of the liquid. The results are shown in Figure 17. It was observed that after this method, the ejected clusters contained one Na ion, and the cluster size was closer to the one that was before using the voltage balance method. It was observed from the comparison that, especially under low ion concentration conditions, the size of the ejected clusters was much smaller than those without the pre-load voltage. Under a pre-load voltage, the ion concentration near the nanotube orifice in a solution under low ion concentrations is actually far higher than the average ion concentration. The time for Taylor cone fracture ranges from 40 to 60 ps. This method can be used to achieve the stable dripping mode of EHDA under different ion concentrations.

The solution fragmentation process after using a pre-load voltage method.
4 Conclusions
The MD method provides a way to analyze the motion behavior of solution atoms under an electric field at the microscopic scale, which is very effective in revealing the EHDA injection mechanism at the nanoscale. This research study was conducted to reveal the dripping mode formation mechanism of EHDA by establishing a nanoscale EHDA injection model. We used NaCl solution as the electrically driven fluid in this study and it was observed that under an external electric field, the dipole moment of water molecules is affected by the electric field force and there is a large cluster of water molecules rotating, which pulls out of the nanotube and forms a Taylor cone. The presence of ions leads to the formation of a water shell around the ions, affecting the dipole moment direction of water molecules and changing the local electric field, ultimately causing liquid breakage and resulting in the dripping mode. We conducted simulations on the injection behavior under different ion concentrations. Unstable injection behavior under different ion concentrations was revealed, and most importantly, it was found that the jetting mode may occur under low ion concentrations. In order to solve this problem, we used the method of pre-load voltage to control the concentration distribution of ions in the solution. The time for Taylor cone fracture was between 85 and 97 ps, and the number of water molecules in the droplet cluster was between 52 and 74. It was found that even under low ion concentrations, stable dripping mode injection behavior could still be achieved.
The use of MD for the study of EHDA is highly necessary. The research results presented can provide parameter references for nanoscale EHDA experiments. A multiscale simulation computational model can be established by combining MD models with traditional CFD models to establish the research scale from the nanometer to millimeter level.
Currently, the research on the dripping mode of EHDA is still insufficient. We have provided an effective and feasible research idea. However, there is still a lot of work to be done in this direction, including the type of solution, fluid properties, and selection of nanomaterials.
Acknowledgments
Researchers would like to thank Electromechanical Integrated Manufacturing of High-performance Electronic Equipments, Xidian University for funding the publication of this project.
-
Funding information: This work was supported in part by the National Natural Science Foundation of China (Grant 52035010), in part by Shaanxi Key Industry Chain Project (Grant 2020ZDLGY14-08), in part by the National 111 Project (Grant B14042), and in part by Natural Science Basic Research Program of Shaanxi (Program 2023-JC-QN-0407 and 2023-JC-YB-320).
-
Author contributions: Dongqiao Bai: conceptualization, methodology, writing - original draft preparation. Jin Huang: writing - review and editing, supervision. Jianjun Wang: formal analysis, visualization, project administration. Shan Jiang: resources, supervision. Hongxiao Gong: validation, software, visualization. Chaoyu Liang: data curation, investigation. All authors have accepted responsibility for the entire content of this manuscript and approved its submission.
-
Conflict of interest: The authors state no conflict of interest.
-
Data availability statement: The datasets generated and/or analysed during the current study are available from the corresponding author on reasonable request.
References
[1] Melcher, J. and G. Taylor. Electrohydrodynamics: a review of the role of interfacial shear stresses. Annual Review of Fluid Mechanics, Vol. 1, No. 1, 1969, pp. 111–146.10.1146/annurev.fl.01.010169.000551Search in Google Scholar
[2] Yarin, A. L., S. Koombhongse, and D. H. Reneker. Taylor cone and jetting from liquid droplets in electrospinning of nanofibers. Journal of Applied Physics, Vol. 90, No. 9, 2001, pp. 4836–4846.10.1063/1.1408260Search in Google Scholar
[3] Gong, H., J. Huang, J. Wang, C. Liang, W. Guo, and R. Cao. Characterization of electrohydrodynamic drop-on-demand injection of viscoelastic fluids in pulsed voltage. Journal of Manufacturing Processes, Vol. 94, 2023, pp. 255–265.10.1016/j.jmapro.2023.03.053Search in Google Scholar
[4] Rezvanpour, A., W. B. Krantz, and C.-H. Wang. Scaling analysis of the electrohydrodynamic atomization (EHDA) process for pharmaceutical particle fabrication. Chemical Engineering Science, Vol. 80, 2012, pp. 81–90.10.1016/j.ces.2012.06.007Search in Google Scholar
[5] Laohakunakorn, N., B. Gollnick, F. Moreno-Herrero, D. G. A. L. Aarts, R. P. A. Dullens, S. Ghosal, et al. A Landau-Squire nanojet. Nano Letters, Vol. 13, No. 11, 2013 Nov, pp. 5141–5146.10.1021/nl402350aSearch in Google Scholar PubMed PubMed Central
[6] Choi, K. H., H. B. Kim, K. Ali, M. Sajid, G. Uddin Siddiqui, D. E. Chang, et al. Hybrid surface acoustic wave-electrohydrodynamic atomization (SAW-EHDA) for the development of functional thin films. Scientific Reports, Vol. 5, 2015 Oct, id. 15178.10.1038/srep15178Search in Google Scholar PubMed PubMed Central
[7] De Bartolomeis, A. and A. Shokrani. Electrohydrodynamic atomization for minimum quantity lubrication (EHDA-MQL) in end milling Ti6Al4V titanium alloy. Journal of Manufacturing and Materials Processing, Vol. 4, No. 3, 2020, p. 70.10.3390/jmmp4030070Search in Google Scholar
[8] Jaworek, A. and A. Krupa. Classification of the modes of EHD spraying. Journal of Aerosol Science, Vol. 30, No. 7, 1999, pp. 873–893.10.1016/S0021-8502(98)00787-3Search in Google Scholar
[9] Rai, P., N. Gautam, H. Chandra, and V. Kumar. Generation of micro/nano scale particles and capsules by Electro hydrodynamic Atomization (EHDA) Process. Materials Today: Proceedings, Vol. 18, 2019, pp. 4374–4383.10.1016/j.matpr.2019.07.401Search in Google Scholar
[10] Wang, Q., Z. Wang, S. Yang, B. Li, H. Xu, K. Yu, et al. Experimental study on electrohydrodynamic atomization (EHDA) in stable cone-jet with middle viscous and low conductive liquid. Experimental Thermal and Fluid Science, Vol. 121, 2021, id. 110260.10.1016/j.expthermflusci.2020.110260Search in Google Scholar
[11] Li, Y., Z. Wang, Q. Kong, B. Li, and H. Wang. Sulfur dioxide absorption by charged droplets in electrohydrodynamic atomization. International Communications in Heat and Mass Transfer, Vol. 137, 2022, id. 106275.10.1016/j.icheatmasstransfer.2022.106275Search in Google Scholar
[12] Grace, J. and J. Marijnissen. A review of liquid atomization by electrical means. Journal of Aerosol Science, Vol. 25, No. 6, 1994, pp. 1005–1019.10.1016/0021-8502(94)90198-8Search in Google Scholar
[13] Maktabi, S. and P. R. Chiarot. Electrohydrodynamic printing of organic polymeric resistors on flat and uneven surfaces. Journal of Applied Physics, Vol. 120, No. 8, 2016, p. 084903.10.1063/1.4961421Search in Google Scholar
[14] Chanda, S. and D. S. Bajwa. A review of current physical techniques for dispersion of cellulose nanomaterials in polymer matrices. Reviews on Advanced Materials Science, Vol. 60, No. 1, 2021, pp. 325–341.10.1515/rams-2021-0023Search in Google Scholar
[15] Lee, M. W., N. Y. Kim, and S. S. Yoon. On pinchoff behavior of electrified droplets. Journal of Aerosol Science, Vol. 57, 2013, pp. 114–124.10.1016/j.jaerosci.2012.09.003Search in Google Scholar
[16] Singh, M., H. M. Haverinen, P. Dhagat, and G. E. Jabbour. Inkjet printing—process and its applications. Advanced Materials, Vol. 22, No. 6, 2010, pp. 673–685.10.1002/adma.200901141Search in Google Scholar PubMed
[17] Hijano, A., I. Loscertales, S. Ibáñez, and F. Higuera. Periodic emission of droplets from an oscillating electrified meniscus of a low-viscosity, highly conductive liquid. Physical Review E, Vol. 91, No. 1, 2015, id. 013011.10.1103/PhysRevE.91.013011Search in Google Scholar PubMed
[18] Wang, Z., L. Xia, and S. Zhan. Experimental study on electrohydrodynamics (EHD) spraying of ethanol with double-capillary. Applied Thermal Engineering, Vol. 120, 2017 Jun, pp. 474–483.10.1016/j.applthermaleng.2017.04.013Search in Google Scholar
[19] Jaworek, A., A. Sobczyk, and A. Krupa. Electrospray application to powder production and surface coating. Journal of Aerosol Science, Vol. 125, 2018, pp. 57–92.10.1016/j.jaerosci.2018.04.006Search in Google Scholar
[20] Agostinho, L., B. Bos, A. Kamau, S. Brouwer, E. Fuchs, and J. Marijnissen. Simple-jet mode electrosprays with water. Description, characterization and application in a single effect evaporation chamber. Journal of Aerosol Science, Vol. 125, 2018, pp. 237–250.10.1016/j.jaerosci.2018.04.010Search in Google Scholar
[21] Connacher, W., N. Zhang, A. Huang, J. Mei, S. Zhang, T. Gopesh, et al. Micro/nano acoustofluidics: materials, phenomena, design, devices, and applications. Lab on a Chip, Vol. 18, No. 14, 2018, pp. 1952–1996.10.1039/C8LC00112JSearch in Google Scholar PubMed
[22] Borra, J.-P. Review on water electro-sprays and applications of charged drops with focus on the corona-assisted cone-jet mode for High Efficiency Air Filtration by wet electro-scrubbing of aerosols. Journal of Aerosol Science, Vol. 125, 2018, pp. 208–236.10.1016/j.jaerosci.2018.04.005Search in Google Scholar
[23] Huang, X., X. Luo, Y. Han, W. Li, Y. Lai, and L. Teng. Deformation and breakup of water droplets containing polymer under a DC electric field. AIChE Journal, Vol. 68, No. 10, 2022, id. e17786.10.1002/aic.17786Search in Google Scholar
[24] Liang, C., J. Huang, W. Guo, and H. Gong. Low temperature co-sintering simulation and properties analysis of 3D printed SiO2B2O3 nanoparticles based on molecular dynamics simulation. Computational Materials Science, Vol. 210, 2022, id. 111447.10.1016/j.commatsci.2022.111447Search in Google Scholar
[25] Hollingsworth, S. A. and R. O. Dror. Molecular dynamics simulation for all. Neuron, Vol. 99, No. 6, 2018, pp. 1129–1143.10.1016/j.neuron.2018.08.011Search in Google Scholar PubMed PubMed Central
[26] Goel, S., X. Luo, A. Agrawal, and R. L. Reuben. Diamond machining of silicon: a review of advances in molecular dynamics simulation. International Journal of Machine Tools and Manufacture, Vol. 88, 2015, pp. 131–164.10.1016/j.ijmachtools.2014.09.013Search in Google Scholar
[27] Perilla, J. R., B. C. Goh, C. K. Cassidy, B. Liu, R. C. Bernardi, T. Rudack, et al. Molecular dynamics simulations of large macromolecular complexes. Current Opinion in Structural Biology, Vol. 31, 2015, pp. 64–74.10.1016/j.sbi.2015.03.007Search in Google Scholar PubMed PubMed Central
[28] Hospital, A., J. R. Goñi, M. Orozco, and J. L. Gelpí. Molecular dynamics simulations: advances and applications. Advances and Applications in Bioinformatics and Chemistry, Vol. 8, 2015, pp. 37–47.10.2147/AABC.S70333Search in Google Scholar PubMed PubMed Central
[29] Banerjee, N., A. Sen, P. S. Ghosh, A. R. Biswas, S. Sharma, A. Kumar, et al. Prediction and simulation of mechanical properties of borophene-reinforced epoxy nanocomposites using molecular dynamics and FEA. Reviews on Advanced Materials Science, Vol. 62, No. 1, 2023, id. 20220322.10.1515/rams-2022-0322Search in Google Scholar
[30] Ni, H., J. Zhu, Z. Wang, H. Lv, Y. Su, and X. Zhang. A brief overview on grain growth of bulk electrodeposited nanocrystalline nickel and nickel-iron alloys. Reviews on Advanced Materials Science, Vol. 58, No. 1, 2019, pp. 98–106.10.1515/rams-2019-0011Search in Google Scholar
[31] Song, F., H. Niu, J. Fan, Q. Chen, G. Wang, and L. Liu. Molecular dynamics study on the coalescence and break-up behaviors of ionic droplets under DC electric field. Journal of Molecular Liquids, Vol. 312, 2020, id. 113195.10.1016/j.molliq.2020.113195Search in Google Scholar
[32] Zheng, F., S. Zhang, J. Mo, H. Yi, S. Zhang, H. Yu, et al. Ion concentration effect on nanoscale electrospray modes. Small, Vol. 16, No. 24, 2020, id. 2000397.10.1002/smll.202000397Search in Google Scholar PubMed
[33] Li, Y., Z. Wang, B. Li, J. Mingdong, and K. Yu. Molecular dynamics simulation of ethanol electrohydrodynamic atomization: Microscopic mechanism of the operating parameter effects. Journal of Molecular Liquids, Vol. 379, 2023, id. 121602.10.1016/j.molliq.2023.121602Search in Google Scholar
[34] Plimpton, S., P. Crozier, and A. Thompson. LAMMPS-large-scale atomic/molecular massively parallel simulator. Sandia National Laboratories, Vol. 18, 2007, id. 43.Search in Google Scholar
[35] Guissani, Y. and B. Guillot. A computer simulation study of the liquid–vapor coexistence curve of water,”. The Journal of Chemical Physics, Vol. 98, No. 10, 1993, pp. 8221–8235.10.1063/1.464527Search in Google Scholar
[36] van der Spoel, D., P. J. Van Maaren, and H. J. Berendsen. A systematic study of water models for molecular simulation: derivation of water models optimized for use with a reaction field. The Journal of Chemical Physics, Vol. 108, No. 24, 1998, pp. 10220–10230.10.1063/1.476482Search in Google Scholar
[37] B. Guillot. A reappraisal of what we have learnt during three decades of computer simulations on water,”. Journal of Molecular Liquids, Vol. 101, No. 1–3, 2002, pp. 219–260.10.1016/S0167-7322(02)00094-6Search in Google Scholar
[38] Hou, D., D. Li, J. Yu, and P. Zhang. Insights on capillary adsorption of aqueous sodium chloride solution in the nanometer calcium silicate channel: A molecular dynamics study. The Journal of Physical Chemistry C, Vol. 121, No. 25, 2017, pp. 13786–13797.10.1021/acs.jpcc.7b04367Search in Google Scholar
[39] Hou, D., T. Li, and P. Wang. Molecular dynamics study on the structure and dynamics of NaCl solution transport in the nanometer channel of CASH gel. ACS Sustainable Chemistry & Engineering, Vol. 6, No. 7, 2018, pp. 9498–9509.10.1021/acssuschemeng.8b02126Search in Google Scholar
[40] Atilhan, M. and S. Aparicio. Molecular dynamics simulations of mixed deep eutectic solvents and their interaction with nanomaterials. Journal of Molecular Liquids, Vol. 283, 2019, pp. 147–154.10.1016/j.molliq.2019.03.068Search in Google Scholar
[41] Liang, X., H. Li, J. Dou, Q. Wang, W. He, C. Wang, et al. Stable and biocompatible carbon nanotube ink mediated by silk protein for printed electronics. Advanced Materials, Vol. 32, No. 31, 2020, id. 2000165.10.1002/adma.202000165Search in Google Scholar PubMed
[42] Karimi, M., K. Abrinia, K. M. Hamdia, S. M. Hashemianzadeh, and M. Baniassadi. Effects of functional group type and coverage on the interfacial strength and load transfer of graphene-polyethylene nanocomposites: A molecular dynamics simulation. Applied Physics A, Vol. 128, No. 4, 2022, id. 341.10.1007/s00339-022-05427-xSearch in Google Scholar
[43] A. Rahman. Correlations in the motion of atoms in liquid argon. Physical Review, Vol. 136, No. 2A, 1964, id. A405.10.1103/PhysRev.136.A405Search in Google Scholar
[44] Wolf, D., P. Keblinski, S. Phillpot, and J. Eggebrecht. Exact method for the simulation of Coulombic systems by spherically truncated, pairwise r− 1 summation. The Journal of Chemical Physics, Vol. 110, No. 17, 1999, pp. 8254–8282.10.1063/1.478738Search in Google Scholar
[45] Thompson, P. A., W. Brinckerhoff, and M. O. Robbins. Microscopic studies of static and dynamic contact angles. Journal of Adhesion Science and Technology, Vol. 7, No. 6, 1993, pp. 535–554.10.1163/156856193X00844Search in Google Scholar
[46] Jiyang, L., W. Tiantian, L. Xiangxiang, W. Fuming, Y. Hui, and H. Wenping. Flexible Sensors Based on Electrohydrodynamic Jet Printing. Progress in Chemistry, Vol. 34, No. 9, 2022, id. 1982.Search in Google Scholar
[47] Sofos, F., T. E. Karakasidis, and D. Spetsiotis. Molecular dynamics simulations of ion separation in nano-channel water flows using an electric field. Molecular Simulation, Vol. 45, No. 17, 2019, pp. 1395–1402.10.1080/08927022.2019.1637520Search in Google Scholar
© 2023 the author(s), published by De Gruyter
This work is licensed under the Creative Commons Attribution 4.0 International License.