Generating Correlated data based on dependent variable in R
Last Updated :
02 Jul, 2024
Generating correlated data is a common requirement in statistical simulations, Monte Carlo methods, and data science research. This involves creating datasets where the variables exhibit specified correlations, often based on a dependent variable. In this article, we will delve into the theory behind correlated data generation, and walk through practical examples using R Programming Language.
Theory Behind Correlated Data Generation
Correlation is a statistical measure that expresses the extent to which two variables are linearly related. A positive correlation means that as one variable increases, the other also increases, while a negative correlation means that as one variable increases, the other decreases.
To generate correlated data, especially when we have a dependent variable, we often use techniques like:
- Multivariate Normal Distribution: This is the most common method for generating correlated continuous variables. It uses a covariance matrix to define the correlations among variables.
- Copulas: Copulas are functions that allow us to couple multivariate distribution functions to their one-dimensional margins. They are powerful in generating correlated data from different types of distributions.
- Linear Transformation: This involves generating uncorrelated data and then applying a linear transformation to introduce the desired correlations.
Generating Correlated Data Using Multivariate Normal Distribution
We will focus on generating correlated data using the Multivariate Normal Distribution approach, as it is straightforward and widely applicable.
Step 1: Load Necessary Libraries
First we will install and load the required libraries.
R
# Load the necessary library
library(MASS)
Step 2: Define the Mean Vector and Covariance Matrix
The mean vector represents the means of the variables, and the covariance matrix represents the covariances (and variances) among the variables.
R
# Define the mean vector
mean_vector <- c(50, 30)

# Define the covariance matrix
cov_matrix <- matrix(c(10, 5, 5, 8), nrow = 2)
Step 3: Generate the Correlated Data
Now we will Generate the Correlated Data.
R
# Generate correlated data
set.seed(123)
correlated_data <- mvrnorm(n = 100, mu = mean_vector, Sigma = cov_matrix)

# Convert to a data frame
correlated_df <- data.frame(correlated_data)
names(correlated_df) <- c("Variable1", "Variable2")
Step 4: Visualize the Correlated Data
Now we will visualize the Correlated Data.
R
# Load ggplot2 for visualization
library(ggplot2)

# Create a scatter plot
ggplot(correlated_df, aes(x = Variable1, y = Variable2)) +
  geom_point() +
  labs(title = "Scatter Plot of Correlated Data",
       x = "Variable 1",
       y = "Variable 2") +
  theme_minimal()
Output:
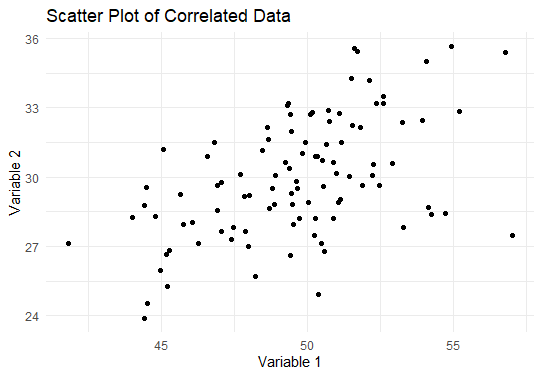
Generating correlated data based on dependent variable in R
Example 2: Generating Correlated Data Based on a Dependent Variable
Suppose we want to generate a dataset where one variable is dependent on another.
Step 1: Define the Relationship
Let’s assume we have a linear relationship between the dependent variable y and the independent variable x:
y=3+2x+ϵ
where ϵ is normally distributed noise.
Step 2: Generate the Independent Variable
Now we will Generate the Independent Variable.
R
# Generate the independent variable x
set.seed(123)
x <- rnorm(100, mean = 5, sd = 2)
Step 3: Generate the Dependent Variable
Now we will Generate the Dependent Variable.
R
# Generate the dependent variable y
epsilon <- rnorm(100, mean = 0, sd = 1)
y <- 3 + 2*x + epsilon

# Combine into a data frame
dependent_df <- data.frame(x = x, y = y)
Step 4: Visualize the Relationship
Now we will Visualize the Relationship.
R
# Create a scatter plot with a regression line
ggplot(dependent_df, aes(x = x, y = y)) +
  geom_point() +
  geom_smooth(method = "lm", se = FALSE, color = "blue") +
  labs(title = "Scatter Plot with Regression Line",
       x = "Independent Variable (x)",
       y = "Dependent Variable (y)") +
  theme_minimal()
Output:
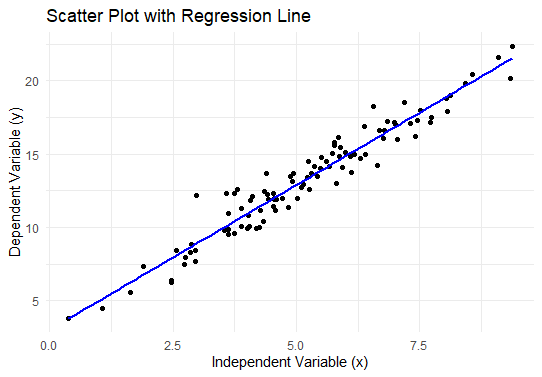
Generating correlated data based on dependent variable in R
Conclusion
In this article, we discussed the theory and methods for generating correlated data based on a dependent variable in R. We used the Multivariate Normal Distribution to create correlated variables and demonstrated how to generate a dependent variable based on an independent variable with a specified linear relationship. Visualizations were created using ggplot2 to illustrate the relationships.
Please Login to comment...