Comprehensive Overview of Hierarchical Clustering: Agglomerative and Divisive Approaches, Dendrogram Visualization, and Practical Considerations
Hierarchical clustering is a method of cluster analysis that builds a hierarchy of clusters. This technique can be visualized as a tree-like diagram called a dendrogram, where the root represents the entire dataset, and the leaves represent individual data points. There are two main approaches to hierarchical clustering: agglomerative (bottom-up) and divisive (top-down).
Agglomerative Hierarchical Clustering:
Agglomerative hierarchical clustering starts with each data point as a single cluster and iteratively merges the closest clusters until only one cluster remains. The general steps are as follows:
Initialization:
Begin with each data point as a singleton cluster.
2. Compute Similarity/Dissimilarity:
Calculate the similarity or dissimilarity (distance) between each pair of clusters or data points. Common distance measures include Euclidean distance, Manhattan distance, or other similarity metrics.
3. Merge Closest Clusters:
Merge the two clusters (or data points) with the smallest dissimilarity into a new cluster.
Update the dissimilarity matrix to reflect the distances between the new cluster and the remaining clusters.
4. Repeat:
Repeat steps 2 and 3 until only one cluster remains, forming a dendrogram.
Divisive Hierarchical Clustering:
Divisive hierarchical clustering takes the opposite approach. It starts with the entire dataset as one cluster and recursively splits it into smaller clusters until each data point is a separate cluster. The general steps are as follows:
Initialization:
Start with all data points in a single cluster.
2. Compute Similarity/Dissimilarity:
Calculate the similarity or dissimilarity between data points in the cluster.
3. Split Cluster:
Identify the data points or subclusters within the current cluster that are least similar to each other.
Split the cluster into two or more smaller clusters.
4. Repeat:
Recursively apply steps 2 and 3 to each newly created cluster until each data point is in its own cluster, forming a dendrogram.
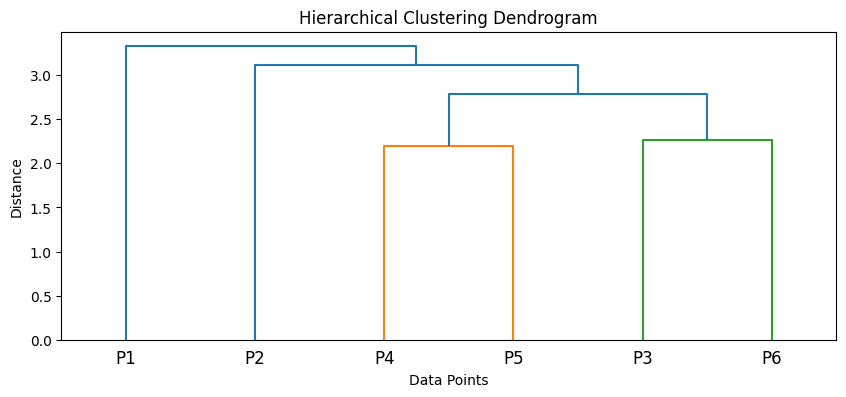
Dendrogram:
The result of hierarchical clustering is often visualized as a dendrogram, which is a tree diagram that illustrates the hierarchy of clusters. The height at which branches merge in the dendrogram represents the dissimilarity at which clusters are combined. The longer the branch, the less similar the clusters are.
Linkage Methods:
In both agglomerative and divisive clustering, the choice of linkage method (how to measure dissimilarity between clusters) can affect the results. Common linkage methods include:
Single Linkage: Uses the minimum distance between any two points in the two clusters.
Complete Linkage: Uses the maximum distance between any two points in the two clusters.
Average Linkage: Uses the average distance between all pairs of points in the two clusters.
Ward’s Method: Minimizes the variance within each cluster.
Practical Considerations:
Number of Clusters:
The dendrogram does not explicitly specify the number of clusters. The appropriate number of clusters is often determined by cutting the dendrogram at a certain height.
Computational Complexity:
Agglomerative hierarchical clustering can be computationally expensive, especially for large datasets, as the dissimilarity matrix needs to be updated at each iteration.
Hierarchical clustering is versatile and can be applied to various types of data. The choice between agglomerative and divisive methods and the linkage criteria depends on the characteristics of the dataset and the goals of the analysis.
Explanation:
: Computes the pairwise Euclidean distances between data points.
: Converts the condensed distance matrix to a square distance matrix.
: Performs hierarchical/agglomerative clustering using the single-linkage method.
: Plots the dendrogram.
Dendrogram:
The dendrogram will represent the hierarchy of cluster mergers

In the dendrogram, the vertical lines represent cluster mergers, and the height at which they occur corresponds to the dissimilarity between the merged clusters