ders 8 Quantile-Regression.ppt
- 1. Quantile Regression Assoc Prof Ergin Akalpler erginakalpler@csu.edu.tr
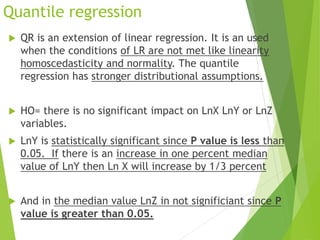
- 2. Quantile regression QR is an extension of linear regression. It is an used when the conditions of LR are not met like linearity homoscedasticity and normality. The quantile regression has stronger distributional assumptions. HO= there is no significant impact on LnX LnY or LnZ variables. LnY is statistically significant since P value is less than 0.05. If there is an increase in one percent median value of LnY then Ln X will increase by 1/3 percent And in the median value LnZ in not significiant since P value is greater than 0.05.
- 3. Regression is a statistical method broadly used in quantitative modeling. Multiple linear regression is a basic and standard approach in which researchers use the values of several variables to explain or predict the mean values of a scale outcome. However, in many circumstances, we are more interested in the median, or an arbitrary quantile of the scale outcome.
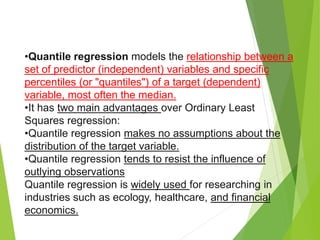
- 4. •Quantile regression models the relationship between a set of predictor (independent) variables and specific percentiles (or "quantiles") of a target (dependent) variable, most often the median. •It has two main advantages over Ordinary Least Squares regression: •Quantile regression makes no assumptions about the distribution of the target variable. •Quantile regression tends to resist the influence of outlying observations Quantile regression is widely used for researching in industries such as ecology, healthcare, and financial economics.
- 5. Quantile Regression Linear vs non-linear model Why QR Graphical representation Application Practical example
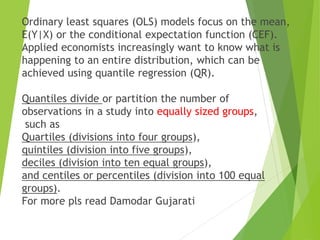
- 6. Ordinary least squares (OLS) models focus on the mean, E(Y|X) or the conditional expectation function (CEF). Applied economists increasingly want to know what is happening to an entire distribution, which can be achieved using quantile regression (QR). Quantiles divide or partition the number of observations in a study into equally sized groups, such as Quartiles (divisions into four groups), quintiles (division into five groups), deciles (division into ten equal groups), and centiles or percentiles (division into 100 equal groups). For more pls read Damodar Gujarati
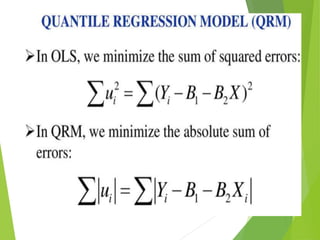
- 7. Linear Regression is used to relate the Conditional Mean to predictors. Quantile Regression relates specific quantiles to predictors. Particularly useful with non-normal data Makes use of different loss function than Ordinary Least Squares – Uses linear programming to estimate
- 8. Standard linear regression techniques summarize the average relationship between a set of regressors and the outcome variable based on the conditional mean function E(y|x). This provides only a partial view of the relationship, as we might be interested in describing the relationship at different points in the conditional distribution of y. Quantile regression provides that capability. Analogous to the conditional mean function of linear regression, we may consider the relationship between the regressors and outcome using the conditional median function Qq(y|x), where the median is the 50th percentile, or quantile q, of the empirical distribution.
- 9. Concept of non-linearity Nonlinearity is a term used in statistics to describe a situation where there is not a straight-line or direct relationship between an independent variable and a dependent variable. In a nonlinear relationship, changes in the output do not change in direct proportion to changes in any of the inputs. Nonlinearity is a mathematical term describing a situation where the relationship between an independent variable and a dependent variable is not predictable from a straight line.
- 10. What is nonlinear model? In general nonlinearity in regression model can be seen as: Nonlinearity of dependent variable ( y ) Nonlinearity within independent variables (x’s)
- 11. How to detect nonlinearity? 1. Theory – in many sciences we have theories about nonlinear relations within some phenomenon. For example: in economics Laffer curve shows a nonlinear relations between taxation and the hypothetical resulting levels of government revenue 2. Scatterplot – when looking at the plot you can see that data points are not linear or not linear.
- 12. 3. Seasonality in data – i.e. in agriculture, building industry we often have seasonality within the data 4. Estimated model does not fit the data well or does not fit. it at all; the estimated β’s are not significant – this might suggest nonlinearity How to detect nonlinearity?
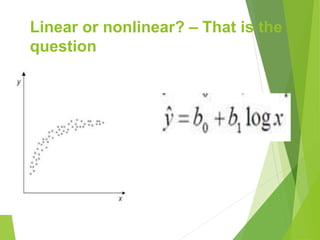
- 13. Linear or nonlinear? – That is the question
- 14. Linear or nonlinear? – That is the question
- 15. Linear or notlinear? – That is the question
- 16. Linear or nonlinear? – That is the question
- 17. Why Quantile Regression? Quantile regression allows us to study the impact of independent variables on different quantiles of dependent variable's distribution, It provides a complete picture of the relationship between Y and X. Robust to outliers in y observations. Estimation and inferences are distribution-free. Analysis of distribution rather than average Quantile regression allows for effects of the independent variables to differ over the quantiles. 17
- 18. Introduction 18 First proposed by Koenker and Bassett (1978), quantile regression is an extension of the classical least squares estimation. OLS regression only enables researchers to approximate the conditional mean and median located at the centre of the distribution. Quantile regression is applied when an estimate of the various quantiles in a population is desired.
- 19. Cont.. Classical linear regression estimates the mean response of the dependent variable dependent on the independent variables. There are many cases, such as skewed data, multimodal data, or data with outliers, when the behavior at the conditional mean fails to fully capture the patterns in the data.
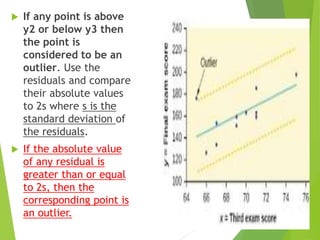
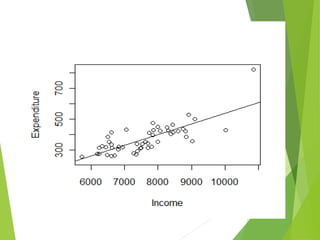
- 20. Outliers Info : Outliers: in regression are observations that fall far from the "cloud" of points. These points are especially important because they can have a strong influence on the least squares line. If the absolute value of any residual is greater than or equal to 2s (2st. dev.), then the corresponding point is an outlier.
- 21. If any point is above y2 or below y3 then the point is considered to be an outlier. Use the residuals and compare their absolute values to 2s where s is the standard deviation of the residuals. If the absolute value of any residual is greater than or equal to 2s, then the corresponding point is an outlier.
- 22. Cont.. Common regression methods measure differences in outcome variables between populations at the mean (i.e., ordinary least squares regression), or a population average effect after adjustment for other explanatory variables of interest. The Quantile regression (QR) method is more robust to outliers (Oliveira et al., 2013). These are often done assuming that the regression coefficients are constant across the population. In other words, the relationships between the outcomes of interest and the explanatory variables remain the same across different values of the variables.
- 23. Cont.. The distribution of Y, the “dependent” variable, conditional on the covariate X, may have thick tails. The conditional distribution of Y may be asymmetric. Regression will not give us robust results. Outliers are problematic, the mean is pulled toward the skewed tail. OLS are sensitive to the presence of outliers.
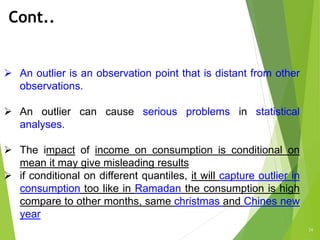
- 24. Cont.. 24 An outlier is an observation point that is distant from other observations. An outlier can cause serious problems in statistical analyses. The impact of income on consumption is conditional on mean it may give misleading results if conditional on different quantiles, it will capture outlier in consumption too like in Ramadan the consumption is high compare to other months, same christmas and Chines new year
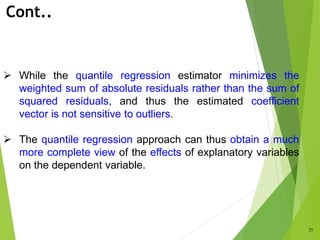
- 25. Cont.. 25 While the quantile regression estimator minimizes the weighted sum of absolute residuals rather than the sum of squared residuals, and thus the estimated coefficient vector is not sensitive to outliers. The quantile regression approach can thus obtain a much more complete view of the effects of explanatory variables on the dependent variable.
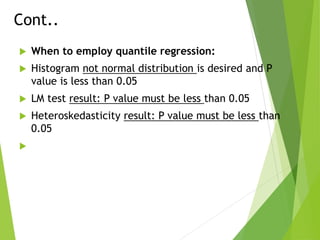
- 26. Cont.. When to employ quantile regression: Histogram not normal distribution is desired and P value is less than 0.05 LM test result: P value must be less than 0.05 Heteroskedasticity result: P value must be less than 0.05
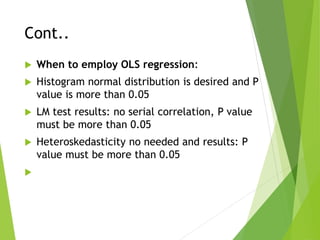
- 27. Cont.. When to employ OLS regression: Histogram normal distribution is desired and P value is more than 0.05 LM test results: no serial correlation, P value must be more than 0.05 Heteroskedasticity no needed and results: P value must be more than 0.05
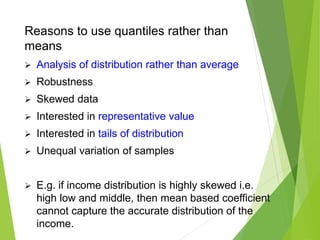
- 28. Reasons to use quantiles rather than means Analysis of distribution rather than average Robustness Skewed data Interested in representative value Interested in tails of distribution Unequal variation of samples E.g. if income distribution is highly skewed i.e. high low and middle, then mean based coefficient cannot capture the accurate distribution of the income.
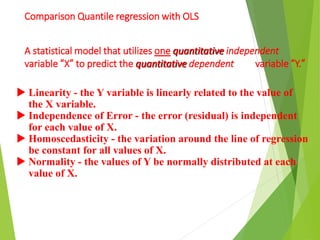
- 29. Comparison Quantile regression with OLS A statistical model that utilizes one quantitative independent variable “X” to predict the quantitative dependent variable “Y.” Linearity - the Y variable is linearly related to the value of the X variable. Independence of Error - the error (residual) is independent for each value of X. Homoscedasticity - the variation around the line of regression be constant for all values of X. Normality - the values of Y be normally distributed at each value of X.
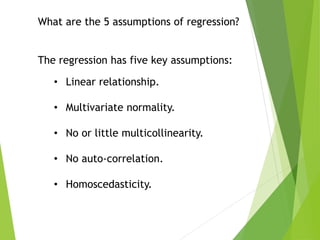
- 30. What are the 5 assumptions of regression? The regression has five key assumptions: • Linear relationship. • Multivariate normality. • No or little multicollinearity. • No auto-correlation. • Homoscedasticity.
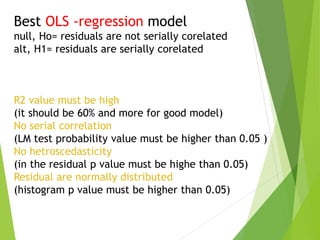
- 31. Best OLS -regression model null, Ho= residuals are not serially corelated alt, H1= residuals are serially corelated R2 value must be high (it should be 60% and more for good model) No serial correlation (LM test probability value must be higher than 0.05 ) No hetroscedasticity (in the residual p value must be highe than 0.05) Residual are normally distributed (histogram p value must be higher than 0.05)
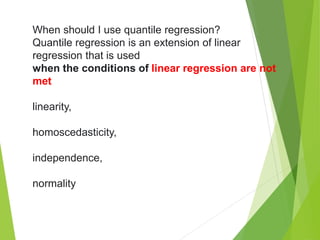
- 32. When should I use quantile regression? Quantile regression is an extension of linear regression that is used when the conditions of linear regression are not met linearity, homoscedasticity, independence, normality
- 33. Best quantile regression model null, Ho= residuals are serially corelated alt, H1= residuals are serially corelated R2 value is not the relevant for QR (How “Variability explained" (as measured in terms of variances, anyway) is essentially a least-squares concept; Important is to find what is an appropriate measure of statistical significance or possibly goodness of fit among variables.) serial correlation (LM test probability value must be less than 0.05 ) No hetroscedasticity (in the residual p value must be less than 0.05) Residual are not normally distributed (histogram p value must be less than 0.05)
- 34. Quantile regression r squared value meaning The goodness of fit of quantile regression: The pseudo or (spurious) R squared value is assumed to be 29 % the adjusted R squared value is 27%. So 27 percent variation in the conditional median in LnX is due to LnY. Quasi Least squared statistic value is 29.34 and probability value is less than 0.05 which indicates that model is stable.
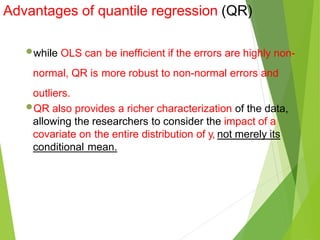
- 35. Advantages of quantile regression (QR) •while OLS can be inefficient if the errors are highly non- normal, QR is more robust to non-normal errors and outliers. •QR also provides a richer characterization of the data, allowing the researchers to consider the impact of a covariate on the entire distribution of y, not merely its conditional mean.
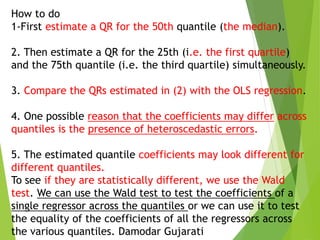
- 36. How to do 1-First estimate a QR for the 50th quantile (the median). 2. Then estimate a QR for the 25th (i.e. the first quartile) and the 75th quantile (i.e. the third quartile) simultaneously. 3. Compare the QRs estimated in (2) with the OLS regression. 4. One possible reason that the coefficients may differ across quantiles is the presence of heteroscedastic errors. 5. The estimated quantile coefficients may look different for different quantiles. To see if they are statistically different, we use the Wald test. We can use the Wald test to test the coefficients of a single regressor across the quantiles or we can use it to test the equality of the coefficients of all the regressors across the various quantiles. Damodar Gujarati
- 38. 38 0 .1 .2 .3 .4 Fraction -20 0 20 40 60 netinterestmargin As we see that the shape of interest margin is leptokurtic which is not captured by normal distribution-based models the mean is pulled toward the skewed tail.
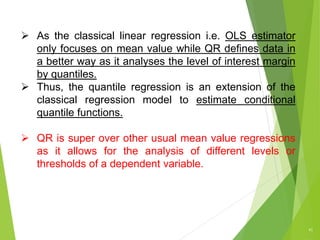
- 41. 41 As the classical linear regression i.e. OLS estimator only focuses on mean value while QR defines data in a better way as it analyses the level of interest margin by quantiles. Thus, the quantile regression is an extension of the classical regression model to estimate conditional quantile functions. QR is super over other usual mean value regressions as it allows for the analysis of different levels or thresholds of a dependent variable.
- 42. 42 Thank YOU eakalpler@gmail.com erginakalpler@csu.edu.tr YouTube: ERGIN FIKRI AKALPLER watch your related course videos
Editor's Notes
- What is IF? - Risk sharing, Profit and Loss sharing, justice and social welfare
- What is IF? - Risk sharing, Profit and Loss sharing, justice and social welfare
- What is IF? - Risk sharing, Profit and Loss sharing, justice and social welfare
- What is IF? - Risk sharing, Profit and Loss sharing, justice and social welfare
- What is IF? - Risk sharing, Profit and Loss sharing, justice and social welfare
- What is IF? - Risk sharing, Profit and Loss sharing, justice and social welfare

