Bruce Edmonds (2006)
The Emergence of Symbiotic Groups Resulting from Skill-Differentiation and Tags
Journal of Artificial Societies and Social Simulation
vol. 9, no. 1
<https://www.jasss.org/9/1/10.html>
For information about citing this article, click here
Received: 12-Jun-2005 Accepted: 18-Aug-2005 Published: 31-Jan-2006
 Abstract
- This paper presents a evolutionary simulation where the presence of 'tags' and an inbuilt specialisation in terms of skills result in the development of 'symbiotic' sharing within groups of individuals with similar tags. It is shown that the greater the number of possible sharing occasions there are the higher the population that is able to be sustained using the same level of resources. The 'life-cycle' of a particular cluster of tag-groups is illustrated showing: the establishment of sharing; a focusing-in of the cluster; the exploitation of the group by a particular skill-group and the waning of the group. This simulation differs from other tag-based models in that is does not rely on either the forced donation of resources to individuals with the same tag and where the tolerance mechanism plays a significant part. These 'symbiotic' groups could provide the structure necessary for the true emergence of artificial societies, supporting a division of labour similar to that found in human societies.
- Keywords:
- Evolution, Tags, Group, Symbiosis, Specialisation, Emergence
 Introduction
- 1.1
- Sometimes when one is good at a certain activity one is necessarily not so good at others. That is to say that there can exist trade-offs between different abilities. In biological terms this might be the result of complex physical limitations — for example, if a species has a physique suitable for running very fast over small distances, this might limit the amount of fat its members can store to allow for survival in lean times. In sociological cases this sort of trade-off might result from the amount of time that is necessary to acquire a certain skill — for example, one may not have time to learn to become a skilled musician and a skilled painter. Thus in an ecology one might have a variety of species, each of which is best adapted to exploit a different aspect of a particular environment. Similarly in our society one observes that people do not develop the same profession/skills but that there seems to be a spontaneous differentiation, so that in any locality many different skills possessed by different people are available.
- 1.2
- When this sort of complementary differentiation is present, a special kind of cooperation is possible, namely that where individuals with different skills contribute to the others any excess in what they produce/gather. In this case each individual (or kind) effectively contributes the skills that they are specialised in to others and benefits from other's special skills in return. In biology, when this relation has evolved into a stable relationship, this is called "symbiosis"[1]. This sort of complementarity is very advanced in human societies; people are encouraged to specialise in terms of the skills in which they most excel, resulting in a huge range of careers and skills whose products/services are shared and traded in elaborate ways.
- 1.3
- However it is difficult to see how such complementary sharing could arise in an open evolutionary setting. The problem is this: from the point of view of an individual it is always better (at least in the short term) not to share the results of one's labours but at the same time to accept those shared by others. Thus, at any moment, those that are not sharing should do better than those who share, and hence produce more offspring (or be copied more by others). Thus it is difficult to see how groups of cooperatively sharing individuals could arise or be maintained. This can lead to a "tragedy of the commons" (Hardin 1968) and is often represented in models by "prisoner's dilemma" game (Axelrod 1984).
- 1.4
- This paper proposes how such complementary cooperation could arise, using a mechanism called "tags". Tags are observable cues that can be used to fallibly recognise types of individuals (Holland 1993). They do not have any significant bearing on the abilities or behaviour of the individual. One can imagine a room full of people who do not know each other but are randomly given different coloured badges to wear, but who are able to exchange the badge for another if they wish. Although these badges may be initially arbitrary it may (in the absence of other significant socially observable cues) allow the people to self-organise. Thus the colours may come to acquire a significance — a significance that would emerge from the social processes in the room.
- 1.5
- There has now been a sequence of models which show that the presence of such tags can enable the evolution of temporary cooperating 'groups' of individuals with similar tags, even when there is a possibility of being invaded by selfish individuals who do not share or cooperate (Hales 2000, Riolo et al. 2001, Hales 2001).
- 1.6
- Basically what happens is this:
- a small "seed" collection of cooperative individuals with similar tags arises somehow;
- these out-perform the others due to their efficient cooperation and hence are grow in numbers as a result of evolution;
- eventually defectors arise in the group (or invades from outside);
- these defectors do even better than the others in that group and hence is preferentially reproduce until they comes to dominate that group;
- now the group does not do so well compared to other cooperative groups because there is little or no sharing and so the group dies.
- 1.7
- Thus this paper seeks to establish how tags can facilitate the development of (temporary) groups of complementary individuals in an evolutionary setting where individuals are not equipped with great cognitive abilities (to support contracts or elaborate foresight for example) and where individuals are not forced to cooperate (in the sense that it is never the case that the structure of the model forces donation regardless of the individuals involved). This mechanism relies upon the existence of specialised skills, tags and the possibility of donation.
- 1.8
- This model is important because this sort of process may allow the emergence some of the basic group infrastructure that, in turn, may facilitate the development of more sophisticated societies within an evolutionary setting. Thus the techniques and results in this paper can be seen as another step towards the full emergence of an artificial society.
 Model Setup
- 2.1
- The main assumption that drives this model is that there are a number of different kinds of 'nutrition' (or 'product') which different individuals are specialised in gathering (or producing). However, although each individual only gathers one kind of resource they all require some of all the kinds of resource in order to survive and reproduce. Thus in order to thrive individuals have to be given resources by other individuals that have them, otherwise they cannot reproduce and soon 'starve to death'. Thus it is a basic assumption of this model that individuals are specialised to a very significant extent — this drives the dynamics in the model. What has to be shown is that, given this, the individuals can still survive in an evolutionary setting.
- 2.2
- This is a discrete time simulation, with a variable number of individuals[2], which "reproduce" and "die". There are a fixed number of discrete nutrient types. In the environment there is a constant supply of nutrition, each unit of which is allocated (by a stochastic distribution process) to be one of these types. Each individual has a specific (fixed) skill — they can only gather units of nutrient of the kind associated with their skill.
- 2.3
- Each individual has the following attributes:
- its special skill;
- a tag value;
- a tolerance value;
- and the amount of each kind of resource it has.
- 2.4
- There is no physical space in the model, only a (one-dimensional) social 'space' determined by the similarity (or otherwise) of the individual's tags[3]. Thus one can imagine that the model represents one location or niche which they all inhabit. In this niche there is a limited amount of nutrition of each kind that is available to the whole population — thus if the individuals in one group is fitter than those in another it will grow at the other's expense. This means that in this model, one group tends to dominate all others at any one time. Clearly if the model were elaborated to include many niches then groups could thrive in parallel.
- 2.5
- Each time period each individual:
- gathers its share of the resource determined by its skill and adds this to its store;
- is randomly 'paired' with a number of other individuals — if the difference in tag values is strictly less than its tolerance value[4] and it has an excess in any of its resource stores it gives a share of its resource to the individual it is paired with (resources degrade on transfer — thus the value of resources received in a donation event is only 0.95 of what is given);
- all individuals are 'taxed' a certain amount from all stores to represent consumption;
- finally individuals survive, die or reproduce depending upon the state of their stores.
- 2.6
- Each time period, a small number of new individuals are added to the population (arriving from elsewhere) before step 1. At creation, individuals are given some (low level of) initial resources of each kind. If an individual reaches a certain age or the level of one of its resources falls to zero that individual dies. If an individual achieves a certain minimum level in all of its resource stores it will reproduce (once in cycles where it can) — the initial stores in the offspring are subtracted from those of the parent. The skill, tag and tolerance values are inherited from the parent, although there is a probability that the tag and/or tolerance values of its offspring are mutated by the addition of Gaussian random noise.
- 2.7
- Individuals only donate if their resource level reaches a minimum, which is higher than the minimum level necessary for reproduction, and they only donate from the excess over that amount. There is a maximum size to the reservoirs of individuals (how much of each type of resource they can store); anything gathered or received above this is simply lost. There is also a maximum tolerance level above which the tolerance values of individuals can not extend above.
- 2.8
- Thus individuals continually appear (arrive or are born), donate, consume resources, (possibly) reproduce, and die (of starvation or old age). The population level is thus variable — determined by the available resources and the efficiency of the sharing.
- 2.9
- A more complete and more technical description of the model is given in the appendix.
 General Results
-
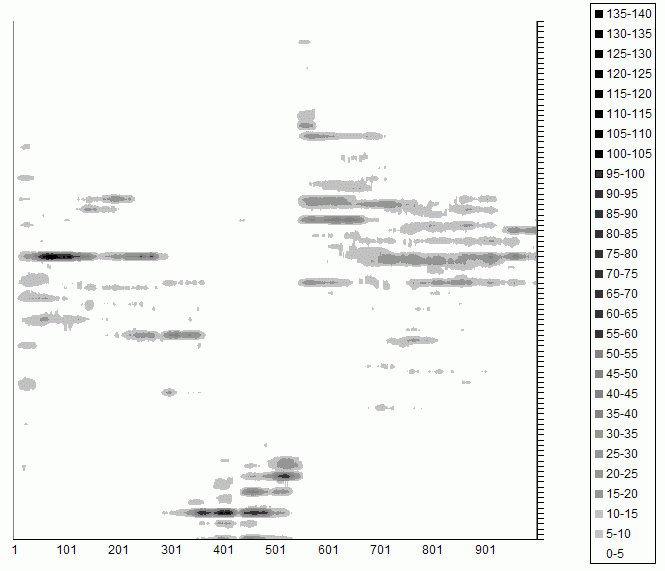
Figure 1. Tag Groups in a Single Run of the Simulation: the vertical axis are the tag values from 0 to 1; the horizontal axis is time; the shade indicates the number of individuals with that tag at that time - 3.1
- The rising and falling of tag groups is illustrated in Figure 1 which is a histogram of tag values over the first 1000 time cycles of a simulation (collected over each 0.01 of tag values and taken every 10 iterations in time). At the start a number of tag groups form but one gains initial dominance. This dominant cluster of groups then loses out to another cluster between generation 200 and 300. This is, in turn, supplanted by the cluster at the bottom between generation 300 and 400. Interestingly this group at the bottom seems to have seeded other groups near to it, but the whole cluster fails around generation 550, allowing a new cluster of groups to arise (towards the top), a sort of "mass extinction" event where the bottom "ecosystem" of individuals fails.
- 3.2
- The number of food types that are necessary for life and reproduction is the most critical factor — more food types means that more diverse groups need to be built up and maintained. Thus as the number of food types increases the time the population is in a low, unviable state increases. As with other tag models, there is a critical level of pairings necessary for the group-formation process to "take off". The next most critical factor is the maximum level of tolerance that individuals can have — if this is bigger, then on the whole, it is more likely that there will be more individuals with a higher tolerance and hence more donation occurs.
- 3.3
- Figure 2, Figure 3 and Figure 4 show the proportion of time the population is in a non-viable state for 2, 3 and 4 food types respectively. Thus a low value indicates a high donation rate and larger population. Each is an average over 25 runs covering the time from 500 to 1000 iterations and covers parameter settings, number of pairings of: 1, 2, 3, 4, 5, and 6 and maximum tolerances of: 0.05, 0.10 0.15, 0.20 and 0.25. The maximum tolerance is the upper bound for tolerance values and the number of pairings is the number of individuals each is paired with each cycle (each of which may result in transferences of more than one resource type).
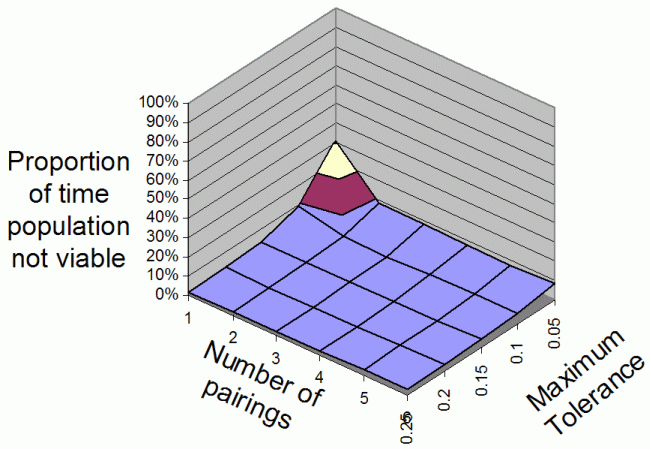
Figure 2. The average proportion of iterations that the population is non-viable overall range of Number Of Parings and Maximum Tolerances for 2 food types 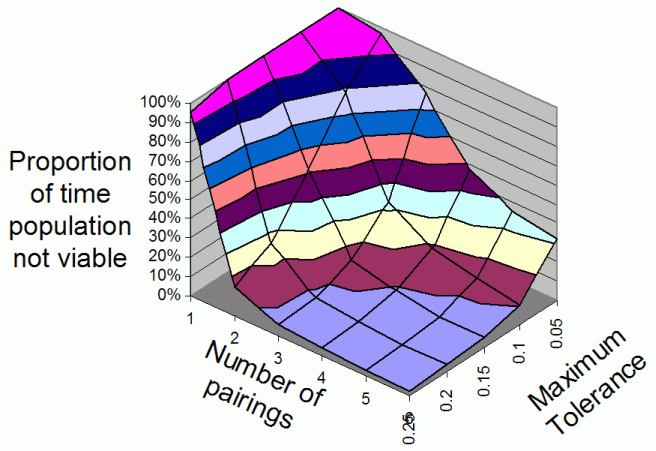
Figure 3. The average proportion of iterations that the population is non-viable overall range of Number Of Parings and Maximum Tolerances for 3 food types 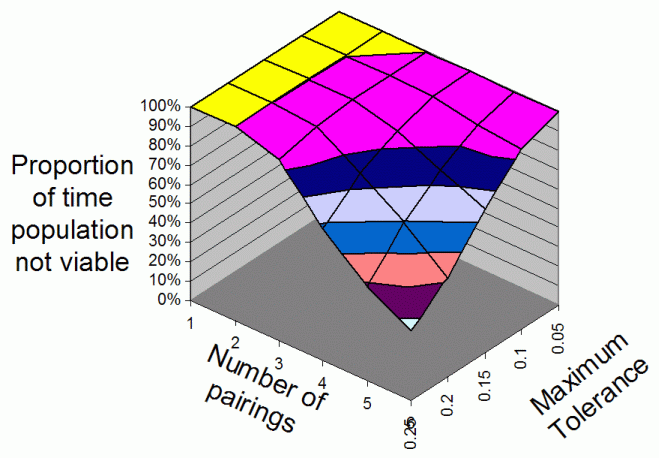
Figure 4. The average proportion of iterations that the population is non-viable overall range of Number Of Parings and Maximum Tolerances for 4 food types - 3.4
- To summarise the above results: the population is more often in a viable state (i.e. with enough donation to allow for reproduction and hence a reasonable population) when:
- the number of food types is lower;
- the number of pairings is higher;
- the maximum tolerance is higher.
- 3.5
- The effect of many of the other parameters are obvious. Increasing: DonationBenefit, NumFood or decreasing: DonationCost, FoodOfTypeAboveWhichIsExtra, FoodOfTypeBelowWhichTagDies, FoodOfTypeNecessaryForReproduction, or FoodUsageRate improves the viability of a population. The levels of InitialPopSize, MaxNumNew, InitialFood, ProbMutVal do not seem to be critical but have to be at least at a minimal level. The speed at which the group "life cycle" process occurs is determined by ProbMutVal (this is thus inversely related to MaxTime if the cycles are to be observed). SdMut needs to be commensurate with MaxTol for the processes to occur.
- 3.6
- Perhaps not so obvious is the result of increasing MaxTagAge or MaxReservoir; doing this decreases the viability of populations because it allows selfish individuals to survive longer with their destructive effect without cooperation from others. Increasing these thus shortens the "predator-prey" phase discussed below.
 Case Study: The Life Cycle of a Symbiotic Groups
- 4.1
- In order to give a better idea of the dynamics in this model, I will look at a particular run of this simulation, chosen to illustrate some of the processes occurring. The example was chosen with a view to clarity of exposition.
- 4.2
- The parameters for this run were as follows (see the Appendix for their explanation, though their names are indicative):
DonationBenefit=0.95; DonationCost=1.0; MaxTime=450; FoodOfTypeAboveWhichIsExtra=5.0; FoodOfTypeBelowWhichTagDies=0.0; FoodOfTypeNecessaryForReproduction=4.0; FoodUsageRate=0.25; InitialFood=1.0; InitialPopSize=100; MaxNumNew=2; MaxReservoir=7.5; MaxStartAge=0; MaxTagAge=15; MaxTol=0.1; NumFood=200; NumFoodTypes=3; NumPairings=6; ProbMutVal=0.05; SdMut=0.05.
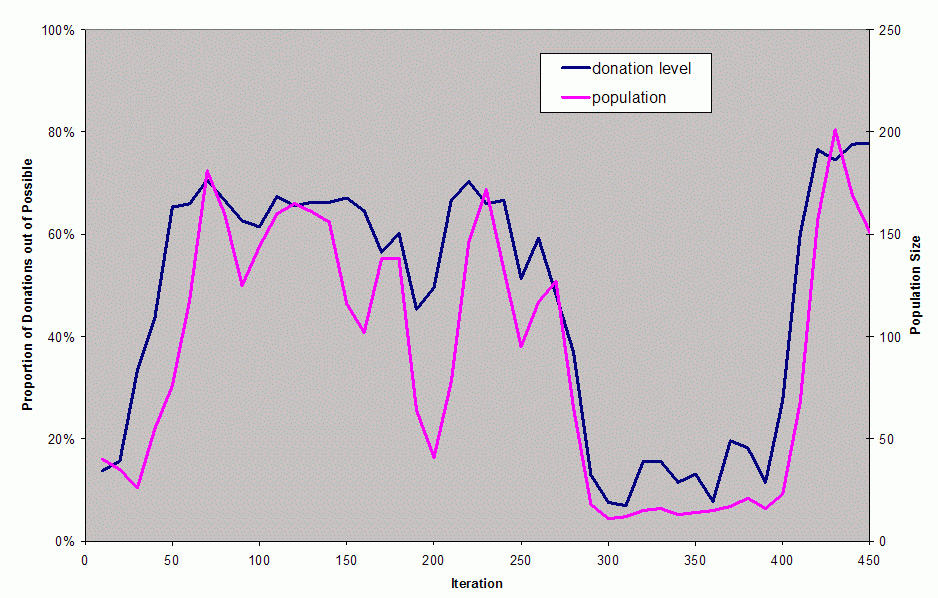
Figure 5. The population and donation level in first 450 iteration of this simulation - 4.3
- Figure 5 shows the population and donation level in the first 450 iterations of this simulation. The population is the total number of individuals and the donation level is the total number of times that a donation occurred out of all possible donation occasions. From a low beginning, the donation level builds to around 60% by iteration 50 and then roughly remains there until iteration 250 after which it collapses. The levels stay low for 200 iterations. The process starts again at around iteration 400, with donation and population levels climbing back up. Changes in the donation level anticipate changes in the population level, since the redistribution of resources is the only way a larger population can be sustained.
- 4.4
- Figure 6 is a bit more informative. It shows the variation in the sizes of the subpopulations of individuals with different skills over the first 450 cycles of the simulation.
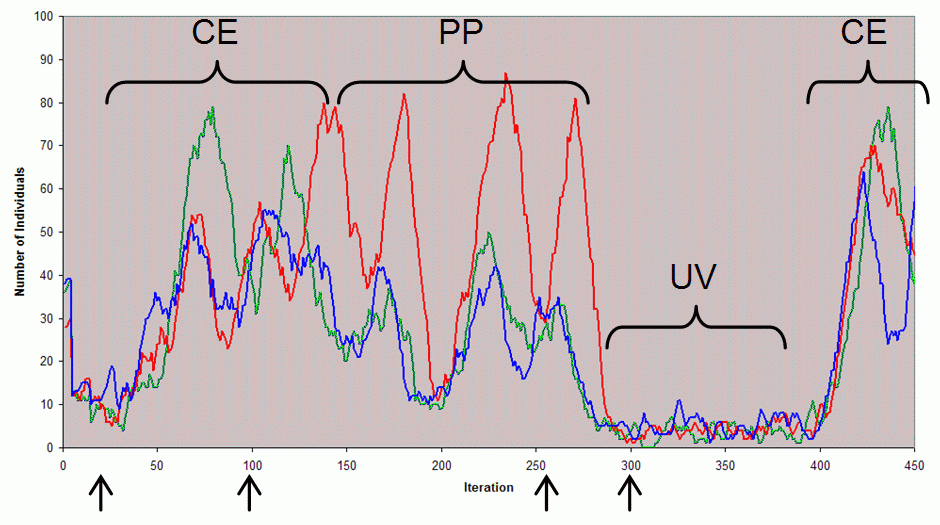
Figure 6. The number of individuals with each of the three skills (red, green and blue) in a sample run, illustrating some of the phases that can occur. CE — coexistence: this is when there co-existing cooperative populations have been established exhibiting minor oscillations (illustrated at iteration 100 in Figure 8); PP — predator-prey: this is where parasites have arisen and thus predator-prey dynamics increasingly dominate until the population become unviable again (illustrated at iteration 260 in Figure 9); UV — unviable: this is when the population is not in a self-sustaining state (illustrated at iteration 300 in Figure 10). The arrows show the timing of snapshots of the populations that are illustrated in the following figures - 4.5
- In the following population profiles, each individual is shown as a coloured line. The centre of the line represents the value of its tag and the length of the line each side of this central cross indicates the value of its tolerance. Thus an individual will (if paired with it and having excess resources) donate to another whose centre is within the bounds indicated by the extent of the line. The different skills are indicated by the different colours (red, green and blue). The age of the individual is indicated by its position on the age axis (individuals of the same age are staggered so they can be distinguished). Unviable individuals (ones who do not receive donations) can only get to age 4 before they die. Thus individuals of ages 5-14 must have received some donations of all types.
- 4.6
- Figure 7 shows the profile of the population at iteration 20. We can see two possible viable groupings: one around tag value 0.1 and one around value 0.9. The group around 0.9 will dominate, because it has become better established and the dynamics are of a winner-take-all kind (the more in the group, the more likely it is that the random pairing will result in intra-group donations and hence individuals in the group will be more likely to reproduce, resulting in a larger group etc.).
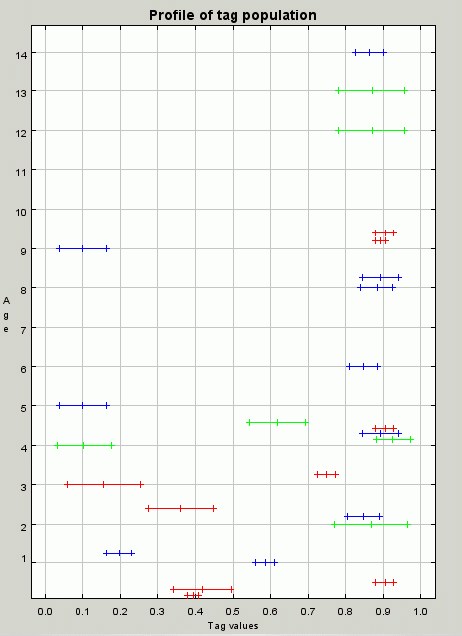
Figure 7. A profile of the population at iteration 20. The population is just beginning to organise into groups with those with tag values around 0.9 and 0.1 being candidates, having all three skills and all being within the tolerance range of each other. The cluster around 0.9 will win out due to resource competition and the self-reinforcing nature of the groups in this model - 4.7
- By iteration 100 the group at tag value 0.9 is well established — this is shown in Figure 8. There are individuals of all colours there and their tags are within each others' tolerances.
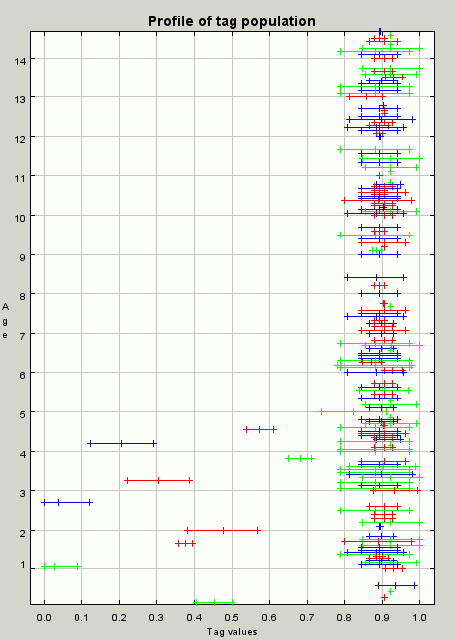
Figure 8. A profile of the population at iteration 100. A profile of the population at iteration 100 showing the cluster of individuals with tag and tolerance values around 0.9 that allow for the effective redistribution of resources - 4.8
- By iteration 260 (Figure 9), the group has been "infected" by individuals which do not donate to the rest of the group, either because they have a zero-tolerance or due to the fact that they have a low tolerance and are "off centre" so the others' tag value do not lie within its range. The appearance of many of these heralds the emergence of classic predator-prey dynamics — if the there are many with other skills that donate the parasites will increase in number, depriving the others of resources — if there are very few others the parasites will not receive in donations enough of the other resources they need so that their numbers will decrease. After a few of these cycles the parasites happen to wipe out all the others and hence themselves.
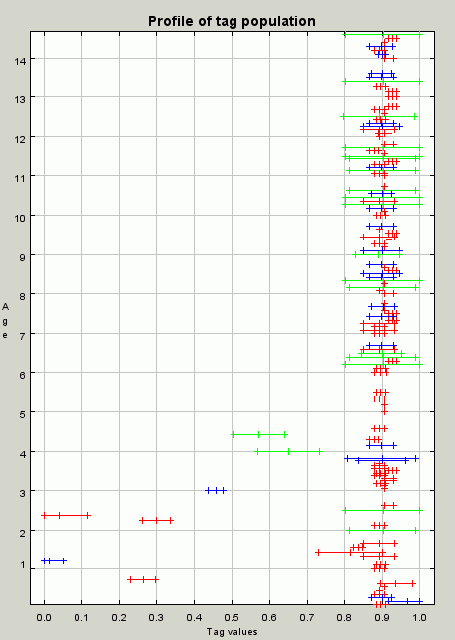
Figure 9. A profile of the population at iteration 260. Although there are still cooperating individuals but there are also parasites (some of the smaller tolerance red individuals). These will soon kill of the group and themselves so that the population becomes unviable again - 4.9
- By iteration 300 (Figure 10) there is no viable population left. In particular there are no individuals with the "green" skill so that it is not possible for any individual to reproduce because none will receive that nutrition type. If there were not the 2 new random individuals entering the population at each iteration, the population would then be (and would remain) zero. Larger populations (caused by a greater food supply) does not seem to be effective in avoiding this catastrophe, but higher mutation rates (so that parasites appear more quickly but so that it is also more likely that a new group will form by chance before the old one is wiped out) or a larger maximum tolerance value greatly extends the time populations can last without new entrants.
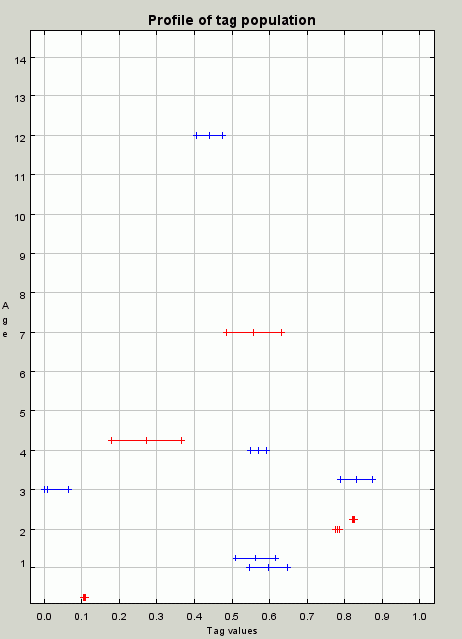
Figure 10. A profile of the population at iteration 300. There are no skills left of the green type and so the population is unviable A QuickTime movie of the profiles in this run, every 10 iterations, is available here.
 Discussion
- 5.1
- There are several points to note here. No claim is made here that the processes described here occur in observed societies (although it is plausible that related ones might). In particular, that one can not infer anything about the workings of society from this computational model (computation → society). Rather the direction of inference is intended to be the other way around: to explore some ways of organising adaptive and decentralised computation which have been loosely suggested by some ideas of how society might be working (society → ideas → computation). An example which takes this further is Hales and Edmonds (2005) which moves towards an application of tag models towards their use in P2P systems, work that has been further developed by David Hales, e.g. (2005). Thus interesting questions, for example how donation itself might have developed in societies or ecosystems, are not addressed.
- 5.2
- Although I have talked about "groups" in this paper, group membership is not explicitly determined in the model and is, in fact, not sharply definable. Whether one individual will donate to another is completely determined by its tolerance value, but each individual will have a different subset to whom it is willing to donate. Thus some "group members" will only donate to a very restricted subset of those near them, or to none at all. Others outside the group may only be the recipients of donations though a chain of intermediaries because tolerant individuals on the edge of the group may donate to individuals well outside it. Thus the grouping is a phenomena that we project upon the dynamics of the model. However the self-reinforcing nature of the dynamics in this model mean that identifiable bunches of individuals do develop which persist over the medium term[5]. Further that this group model of what is occurring in terms of group "birth", "growth", "seeding" and "death" does help us understand and predict the dynamics of this model. Thus interpreting the behaviour of this model in terms of groups gives us a description that has persistent referents, as well as being consistent and useful. Thus these groups exist in the same sense that an individual human exists — the limits of a person are not precise, they are a collection of cells some of which are dead (outer skin) and some of which have different genomes (by mutation) as well as chemicals, some of which are at different stages of being adsorbed or excreted, but a person still exists as a separate entity in all sensible meanings of the word "exist"[6].
- 5.3
- There are two possible interpretations of this model: in terms of social and biological phenomena. Of the two, I think the biological interpretation is stronger — humans are simply not randomly paired, donating excess if their tags are similar. However, the aim of developing this model is to move towards the sorts of self-organisation that is observed in human societies — for more about this see the concluding discussion.
- 5.4
- The model shows that this mechanism is does not produce viably cooperating groups over the long term without some entrants from outside (the "new" entrants in the model). This is unsurprising as the "tag mechanism" is predicated on the possibility of new seed groups forming to replace those that are "dying". This model is of a single niche which results in a "winner takes all" dynamics where the (currently) most successful individuals take a greater share of the limited resources and hence reproduces (on the whole) more than others resulting in its kind taking a greater share etc. Thus it is difficult in this model for step (a) listed in the introductory section to occur whilst other groups exist. This could be "fixed" by expanding the model to have multiple niches and a slow rate of migration between them or by arranging that there are many more types of food (and corresponding skills) than necessary food types — this would allow for different cooperating groups to develop in parallel. Both of these extensions are eminently plausible when considering more realistic environments and problems.
 Related Work
- 6.1
- The idea of tags was introduced by John Holland (1993, 1995). This idea was developed by (among others) Rick Riolo (1997, 2001, etc.); and David Hales (2000, 2001, etc.). In 2001 the paper in Nature by Riolo, Cohen and Axelrod (Riolo et al 2001) exposed tags to wider audience, however that model was flawed (Roberts and Sherrat 2002, Edmonds and Hales 2003). Further work has focussed on fixing these flaws, exploring the conditions under which tags work and has started working towards applications (Hales and Edmonds 2005). This paper is part of this development.
- 6.2
- There now have been quite a number of models showing how tags can facilitate the emergence of cooperation between groups of individuals with similar tags. The model exhibited here is different in that: (a) no individuals are forced (by the model design) to cooperate with individuals with identical tags; (b) the tolerance mechanisms whereby the range of difference which is tolerated within groups is necessary and active; and (c) there is no 'magic' increase in the value of donated resources from donor to recipient.
- 6.3
- The model presented here follows that of Riolo et al. (2001), in that it uses for a tag the intensity of a single continuous variable. Tag comparisons are thus a simple matter of taking the absolute difference in tag values. This eases the display (and hence analysis) of the distributions of values that result, also in many tag models, whether one uses a continuous space of tag values, or a sufficiently large binary space seems not to make significant difference to the results. However as Roberts and Sherratt (2002) and Edmonds and Hales (2003) showed this model relies upon the fact that individuals are forced to donate to others with an identical tag, and that the tolerance does not play any significant part (contrary to the interpretation in Sigmund and Nowak 2001).
- 6.4
- Takahashi (2000) (and the tag-based variants discussed in Edmonds and Hales 2003) concerned themselves with a model of generalised exchange where resource sharing resulted, but these outcomes depend on the fact that the value of a donation to a recipient is greater than the cost to a donor. That is to say that every donation has the result of increasing the resources available to the model. There is a possible (but rather forced) interpretation of this, that somehow the resource is more useful to the recipient than the donor, which could be for a variety of reasons (e.g. it was excess to the donor's needs), but this increase in value occurs regardless of who the recipient is. The model in this paper can be seen as an attempt to provide a coherent story behind the difference in value, by specifying different resource needs.
 Towards the Emergence of Complex Artificial Societies
- 7.1
- What has been described above shows how, in a certain setting, cooperative groups of individuals with similar tags can come into being, persist for a while and dwindle out of existence. This provides some of the 'group infrastructure' for more complex social structure to develop. However in order for this to occur more is needed. Essentially the groups need to be able to spawn new groups with characteristics that are similar to that of the original group, before they are infected with defectors. If, in addition to this process, the characteristics that are transmitted from group to group were potentially complex, then all the conditions necessary for the evolution of groups would be present. Presumably those groups that were more successful at resisting infection by defectors and at 'seeding' new groups with similar characteristics as itself would (under suitable conditions) would be more successful at seeding new groups, thus allowing for a continual process of selection and reproduction of groups that are identifiable entities in their own right (identifiable via the tags). Although evolution continues to act at the individual level, the fitness of each individual depends crucially upon the state of the group it is a member of, so if it were also the case that seeded groups had the characteristics of the groups they were seeded from (carried by the individuals who migrated out of the original group) then it would be meaningful to talk of 'group selection'[7].
- 7.2
- Such a process would accord with the social intelligence hypothesis (Kummer et al. 1997) and that group cultures are highly adapted to the immediate environment they inhabit (Reader 1988). The social intelligence hypothesis posits that the success of our species results more as a result of our social abilities rather than our intellectual abilities. In particular it includes a sophisticated ability to imitate others, so that skills suitable in a certain environment can spread throughout a population. This suggests that our survival may have depended upon the fact that we have socially adapted as groups to inhabit a large variety of different ecological niches, such as the Tundra and the Kalahari. The cultures developed in different groups and passed down culturally within and throughout those groups are responsible for their members ability to survive and reproduce. This model can be seen as a step forward to capturing the development of such cultural plasticity[8].
 Notes
Notes
-
1This is inevitably somewhat of a gloss on symbiosis. Typically in symbiosis what is used by one species is a by-product of the other rather than the excess being distributed.
2The individuals are too simple to be called 'agents', though happen to be simulated as separate objects with rules. One can well imagine their dynamics occurring in creatures without anything we would call cognition.
3In other tag models different ways of representing tags have been used (including multi-dimensional binary and continuous vectors and integers) — in the models that have been tried this does not seem to significantly change the results.
4It is important that the relation is strict ('<') rather than not ('≤') as this allows for totally selfish individuals to exist — otherwise (as documented in Edmonds and Hales 2003) individuals have no option but to donate to clones of themselves.
5Indeed, the self-creation and regulation of "group" identity here might allow one to claim that the groups are autopoetic (Maturana and Valera 1980).
6The existence of emergence, such as observed in these cases, calls into question the assumption that a finer level of description has any sort of precedence over descriptions at higher levels. What is of more importance are the properties of persistence, continuity, usefulness, identifiably, predictability etc. As Anderson (1972) put it: "more is different".
7A review of the literature on group selection is Wilson and Sober (1994)
8For background on these ideas see Barkow et al. (1992).
 Acknowledgements
- Thanks to David Hales, who has done the lion's share of the work on tags and with whose feedback and advice I developed this model, to Emma Norling for reimplementing the model in Java/Repast and to all those who attended the Evolving Artificial Societies day of the Socially Inspired Computing symposium at AISB 2005 for their questions and comments. Also to the many others with whom I have discussed these issues, including the participants of MABS, M2M, ESOA and ESSA.
 Appendix: More about the model
-
Sources
- A.1
- The model structure of tags and tolerances in a [0,1] range comes from Riolo et al. (2001). The motivation for improving on this model came from Edmonds and Hales (2003, Edmonds and Hales 2005). The nutrition structure that was added on was suggested by reading texts on evolution and symbiosis, including Margulis and Sagan (1986).
Structure
- A.2
- There are fixed number of nutrition types and corresponding skills for gathering that type. There is a fixed amount of nutrition units distributed in each iteration, though each is allocated to a random nutrition type.
- A.3
- There is a variable population of individuals, each of which is characterised by the following characteristics: a tag value (a real from [0,1]); a tolerance value (a real from [0,1]); a skill type (an integer); for each nutrition type: a reservoir holding an amount of that resource (a real), and an age (an integer).
Resource Flow
- A.4
- Resources are broadly conserved within each nutrition type. It enters via distribution (as well as via new non-reproduced entrants) and leaves via the life tax, the excess above the storage limit of individuals and with the death of individuals.
- A.5
- This principally enters the model via the direct distribution of units in the form of the different nutrition types. These are randomly distributed in units of 1 to these different types, then all those individuals who posses the appropriate skill gather that resource kind, equally sharing that resource.
- A.6
- Also new individuals (the initial population, the 2 new individuals that enter the population each time, and the progeny of individuals that reproduce) are given a fixed amount in each reservoir (intialFood). In the case of reproduction these amounts are subtracted from the corresponding reservoirs of the parent, so that reproduction does not increase the value of resources.
- A.7
- Each individual is now randomly paired with a fixed number (numPairings) of other individuals, without replacement. In each pairing event an amount of resource (maybe of several types) may be transferred from giver to recipient, if some conditions are satisfied. These conditions are: (1) The recipient must be one of those randomly chosen that time; (2) the difference in tag values must be strictly less than the tolerance of the giver; and (3) the giver must have more than a set amount (foodOfTypeAboveWhichIsExtra) in the corresponding reservoir. For each unit that is donated, donationCost is subtracted from the giver but only donationBenefit given to the recipient. The excess in the reservoir is shared equally among all recipients who qualify.
- A.8
- The individuals' reservoirs can only store up to a fixed maximum (maxResevoir). Above that resources are simply lost.
- A.9
- Each unit of time, a 'life tax' (of foodUsageRate) is subtracted from each reservoir of each individual.
- A.10
- If an individual has accumulated more than a fixed amount (foodOfTypeNecessaryForReproduction) in all of their reservoirs then they reproduce. The resources in the offspring are subtracted from the parent.
- A.11
- If an individual has less than a fixed amount (foodOfTypeBelowWhichTagDies) in any reservoir then it dies, also if it has reached its maximum age (maxTagAge). Resources of those that die are lost.
Dynamics
- A.12
- Once going, mutation can occur in tag or tolerance values. Apart from such mutation the main changes are in the number of individuals with particular skills and tags that results from their success in getting enough nutrition of all types so as (a) not to prematurely die and (2) to reproduce. The fact that all individuals will eventually die (if only because they reach the maximum age) makes the whole system more dynamic.
Initialisation
- A.13
- For the initial population, and the two entrants each iteration are given a random skill (one of 1, ... numFoodTypes), a random tag value (from [0, 1]), a random tolerance (from [0, MaxTol]), a zero age and initialFood in each of its reserves.
Algorithm
Generate individuals, giving them all initialFood in each resource
and each an independent randomly chosen skill, tag and tolerance
For each generation
    Add maxNumNew new individuals (with random tags)
    Units of resource are randomly distributed among nutrition types -
    individuals with a skill equally share in that type
    For each individual, D
        For each pairing from 1 to numPairings
            Randomly choose another individual without replacement, O
            For each resource type, R
                If
                    D has more of R than foodOfTypeAboveWhichIsExtra
                    and the absolute difference between D's and O's tag
                    is strictly less than D's tolerance
                Then
                    Subtract donationCost in R from D
                    Add donationBenefit in R to O
            Next resource type
        Next pairing
    Next individual
    For each individual
        subtract foodUsageRate from each resource
        If any resource < foodOfTypeBelowWhichTagDies then it dies
        If
            all resources > foodOfTypeNecessaryForReproduction
        Then
            replicate individual (with possible mutation),
            subtracting new progeny's resources from parent
    Next individual
Next generation
Figure A1. Algorithm Intended interpretation
- A.14
- There are two possible interpretations for this simulation: one biological and one social. In the biological interpretation: the individuals have the skills genetically encoded and a variety of nutritional needs; these individuals also have a genetically determined ability to recognise those with a similar tag to themselves and excrete/make available some of their nutritional excess; the simulation shows how, in such a situation, symbiotic relationships might arise. In the social interpretation: individuals choose to develop one of a set of skills and may share the results of applying these skills with others if they judge them similar enough to themselves (in terms of socially observable signals); skills may change and be passed on to their offspring.
Details Necessary for the Simulation to Run but not thought Important
- A.15
- Exactly how the population is initialised is not thought to be important, in trial runs with (for example) a population with zero tolerance, cooperative groups did eventually form and the processes described above take place, but this took longer to "get going" (assuming sufficient mutation rates). Similarly starting with a zero population gave essentially the same results (but took longer to get going).
- A.16
- The tags, tolerances and comparison could represented be represented in a number of different ways without significantly changing the results — for example, earlier versions of this model used multi-dimensional binary tags, and hamming distances for tag comparison (or a second bit-string which indicated in which positions the tags had to be the same), and did not significantly change the result. However it is important that: there is some similarity comparison; different tag groups van develop; that tags can change (e.g. by mutation); and that individuals are not forced to donate by the tag structure.
- A.17
- The exact reproduction scheme (e.g. roulette wheel) is also not important, as long as: there is some symmetry-breaking mechanisms to start the process in a population of equally unsuccessful individuals (Edmonds and Hales 2003); and that fitter populations are preferentially reproduced.
Parameters
- A.18
- Below is an explanation of each of the major parameters, giving its name, its range (if this is varied), its default value and a brief explanation.
- DonationBenefit (default value 0.95)
- DonationCost: (default value 0.95) — the proportion of a donation that the donee receives
- MaxTime: [1...∞] (default value 1000) — the number of iterations the simulation runs for
- FoodOfTypeAboveWhichIsExtra: (default value 5.0) — if an individual has more than this of any type of resource it may donate this
- FoodOfTypeBelowWhichTagDies: (default value 0.0) — if any resource reaches this level the individual dies
- FoodOfTypeNecessaryForReproduction: (default value 4.0) — if all resources of an individual are above this level it will reproduce
- FoodUsageRate: (default value 0.25) — the amount subtracted from all resources held by all individuals as the life tax
- InitialFood: (default value 1.0) — how much new individuals (either born, initial population or new entrants) have in each of their stores
- InitialPopSize: [0,... 100] (default value 100) — the size of the initial population
- NumNew: [0,... 2] (default value 2) — how many new entrant enter the population each iteration
- MaxReservoir: [5, 20] (default value 7.5) — the most that an individual can store of each type of resource
- MaxTagAge: [15, 30] (default value 15) — the age at which individuals die (if they have not died of starvation before)
- MaxTol: [0.1, 1] (default value 0.1) — the maximum tolerance value that individuals can have
- NumFood: [200, ∞] (default value 200) — how much food is distributed into the model each iteration
- NumFoodTypes: [1,...,4] (default value 3) — how many different types of resource are available and necessary for survival and reproduction
- NumPairings: [1,...,10] (default value 6) — the number of times each individual is randomly paired with others for possible donation
- ProbMutVal: [0, 1] (default value 0.05) — the probability that the tag and tolerance values are mutated during reproduction (independently for each)
- SdMut: [0, 1] (default value 0.05.) — the standard deviation of the Gaussian noise that is added to a value that is mutated
Description of variations
- A.19
- There are many possible variations to this model. In this paper the following parameters have been varied: number of food types; number of pairings; maximum tolerance; and maximum reservoir. Other investigations have varied the following parameters: the number of new entrants; the mutation probability; the standard deviation of the mutation Gaussian noise; the initial population size; and donation cost. Also different ways of representing the tags and tolerances have been tried.
Verification of Code
- A.20
- This model was reimplemented in Java by Emma Norling. Although we got similar results to the SDML version we did not finish 'docking' these models to check it 100% (as in Edmonds and Hales 2003), but we got very similar results from both models. The results were broadly compatible with what we have found in other tag-based models. It has to be noted that David Hales tried to reproduce the results of (an earlier version of) the SDML version in Java but did not manage to reproduce them.
Software Environment and Code
- A.21
- This model was first implemented in SDML version 4.1. This is language freely available for academic use, but is currently unsupported. The code for this can be obtained from the author by email, but takes some knowledge of SDML to run.
- A.22
- The results in this version of this paper are from an implementation in Java/Repast programmed by Emma Norling. The code for this is attached (FoodModel.java and TaggedAgent.java). It requires the Repast and Colt Random libraries to run.
 References
-
ANDERSON, P. W. (1972) More is Different, Science, 177:393-396
AXELROD, R. (1984) The Evolution of Cooperation, Basic Books, New York.
BARKOW, J. H., Cosmides, L. & Tooby, J. (Eds.), (1992) The adapted mind: evolutionary psychology and the generation of culture. Oxford University Press.
EDMONDS, B. and Hales, D. (2003) Replication, Replication and Replication - Some Hard Lessons from Model Alignment. Journal of Artificial Societies and Social Simulation 6(4). https://www.jasss.org/6/4/11.html
EDMONDS, B. and Hales, D. (2005) Computational Simulation as Theoretical Experiment, Journal of Mathematical Sociology, 29:1-24.
HALES, D. (2000) Cooperation without Space or Memory: Tags, Groups and the Prisoner's Dilemma. In Moss & Davidsson, (eds.) Multi-Agent-Based Simulation. LNAI 1979:157-166. Springer. Berlin, 2000.
HALES, D. (2001) Tag Based Co-operation in Artificial Societies. PhD Thesis, Department of Computer Science, University of Essex, UK, 2001.
HALES, D. (2004) Understanding Tag Systems by Comparing Tag Models. Second Model-to-Model Workshop (M2M2) at the Second European Social Simulation Association Conference (ESSA'04) Valladolid, Spain 16-19th Sept 2004.
HALES, D. (2005) Choose Your Tribe! - Evolution at the Next Level in a Peer-to-Peer Network. University of Bologna, Dept. of Computer Science, May 2005, Technical Report UBLCS-2005-13. http://www.cs.unibo.it/pub/TR/UBLCS/ABSTRACTS/2005.bib
HALES, D. and Edmonds, B. (2005) Applying a socially-inspired technique (tags) to improve cooperation in P2P Networks, IEEE Transactions in Systems, Man and Cybernetics, 35:385-395.
HARDIN, G. (1968) The Tragedy of the Commons, Science, 162:1243-1248.
HOLLAND, J. (1993) The Effect of Labels (Tags) on Social Interactions. SFI Working Paper 93 10 064. Santa Fe Institute, Santa Fe, New Mexico, USA.
HOLLAND, J. (1995) Hidden order : how adaptation builds complexity Reading, MA: Addison-Wesley.
KUMMER, H., Daston, L., Gigerenzer, G. & Silk, J. (1997) The social intelligence hypothesis. In Weingart et. al (eds.), Human by Nature: between biology and the social sciences. Hillsdale, NJ: Lawrence Erlbaum Associates, 157-179.
MARGULIS, L. and Sagan, D. Microcosmos: Four Billion Years of Evolution from Our Microbial Ancestors. Summit Books, New York, 1986.
MATURANA, H. R. and Varela, F. J. (1980) Autopoiesis and cognition : the realization of the living. Boston studies in the philosophy of science; v.42, Kluwer Academic.
READER, J. Man on Earth. London: Collins, 1988.
RIOLO, R. (1997). The effects of tag-mediated selection of partners in evolving populations playing the iterated Prisoner's Dilemma. Santa Fe Institute Working Paper, 97-02-016. http://www.cscs.umich.edu/pub/papers/icga97-ipd.ps
RIOLO, R. L., Cohen, M. D. and Axelrod, R. (2001) Evolution of cooperation without reciprocity. Nature, 411:441-443.
ROBERTS, G. and Sherratt, T. (2002) Does similarity breed cooperation? Nature 418:499-500.
SIGMUND, K. and Nowak, M. A. (2001) Evolution - Tides of tolerance. Nature 414:403.
TAKAHASHI, N. (2000) The Emergence of Generalized Exchange. American Journal of Sociology 105:1105-1134,.
WILSON, D.S. & Sober, E. (1994) Reintroducing group selection to the human behavioural sciences. Behavioral and Brain Sciences 17(4): 585-654.
Return to Contents of this issue
© Copyright Journal of Artificial Societies and Social Simulation, [2006]
