Location via proxy:   [ UP ]  
[Report a bug]   [Manage cookies]                
Article

Collembola Diversity across Vegetation Types of a Neotropical Island in a River Delta

by
Maria Geovana de Mesquita Lima
1,*,
Bruna Maria da Silva
1,
Rudy Camilo Nunes
1,2,
Alexandre de Oliveira Marques
1,3,
Gleyce da Silva Medeiros
1,
Fúlvio Aurélio de Morais Freire
1,3,
Clécio Danilo Dias da Silva
1,
Bruna Winck
4 and
Bruno Cavalcante Bellini
1,*
1
Department of Botany and Zoology, Biosciences Center, Federal University of Rio Grande do Norte, Natal 59078-970, Brazil
2
Biodiversity and Biotechnology Research Group of North Center Piaui, Federal Institute of Education, Science and Technology of Piaui, Pedro II 64255-000, Brazil
3
Laboratory of Ecology and Evolution of Crustaceans (LABEEC), Federal University of Rio Grande do Norte (UFRN), Natal 59078-900, Brazil
4
ECOSYS—Ecologie Fonctionnelle et Écotoxicologie des Agroécosystèmes, University Paris-Saclay, INRAE—Institut National de Recherche pour l’Agriculture, l’Alimentation et l’Environnement, AgroParisTech, 91120 Palaiseau, France
*
Authors to whom correspondence should be addressed.
Diversity 2024, 16(8), 445; https://doi.org/10.3390/d16080445
Submission received: 10 July 2024 / Revised: 24 July 2024 / Accepted: 25 July 2024 / Published: 27 July 2024
(This article belongs to the Section Animal Diversity)

Abstract

:
Springtails, vital for ecosystem assessment, are often overshadowed by taxonomy-focused research, which mostly neglects their ecology and distribution, particularly in the Neotropical Region. The objective of this study was to identify how environmental factors, especially vegetation types, affect the availability of food resources for epiedaphic Collembola and influence their diversity patterns in three vegetation types (riparian forest, mangrove, and restinga) in the Canárias Island, in Delta do Parnaíba Environmental Protection Area, Brazil (APADP). We collected samples along 200 m transects in each vegetation type during the dry and rainy seasons. After, specimens were sorted, counted and identified. Alpha (species richness, Shannon, Simpson, and Pielou indices) and beta diversity (Whittaker index) were analyzed, along with environmental factors’ influence through Redundancy Analysis (RDA). We sampled a total of 5346 specimens, belonging to three orders, eight families, 23 genera, 31 morphospecies, and one nominal species. Species abundance was positively influenced by soil moisture, plant richness, and leaf litter. The riparian forest sheltered a higher species richness and diversity, and its biotic and abiotic factors likely enhanced the food resource availability, including vegetal organic matter, fungi, and bacteria. These results provide the first taxonomic and ecological data on the Collembola fauna in the APADP.

1. Introduction

Collembola (springtails) are among the most abundant and diversified lineages of soil hexapods, distributed across different trophic niches [1,2]. These organisms play a fundamental role in soil environment health, such as microbial control (fungi and bacteria), organic matter decomposition, nutrient cycling, and trophic interactions [1,3,4,5,6,7]. Due to their sensitivity to environmental changes, some species can be used as bioindicators of soil quality, with their use being more intensified in soil monitoring programs in Europe [8,9,10,11]. Recent studies investigated how these arthropods respond to environmental challenges, including the effects of soil pollution and climate change, as well as exploring their role as indicators of environmental health and their influence on terrestrial ecosystem structure [12,13,14,15].
In Brazil, as well as in other countries in the Neotropical Region, the study of this group has significantly advanced during the last decades [16,17]. However, despite their being key organisms for assessing terrestrial ecosystem quality, most research in the neotropics focuses on taxonomy, with little known about their ecology, diversity, and real distribution in this region [18,19]. The few published ecological studies on Collembola in Brazilian ecosystems reveal a rich fauna influenced by local conditions [20,21,22,23,24]. Despite these advances, much remains unknown, as many of the country’s ecosystems remain unexplored in both taxonomic and ecological research.
Located in the only open sea delta in the Americas, in the northeastern region of Brazil, the “Área de Proteção Ambiental Delta do Parnaíba” (APADP)—Delta do Parnaíba Environmental Protection Area, Brazil, is a transitional zone between complex biogeographical systems of Amazon, semiarid region, and coastal-marine areas. It exhibits remarkable environmental heterogeneity, with vegetation formations from the Cerrado/Caatinga biomes transition, including also mangroves, restingas, and riparian forests [25,26,27]. Due to its diverse ecosystems, the region likely harbors a rich Collembola fauna. However, it has remained unexplored in its most basic aspects, with no recorded species of this group to date.
The density and richness of Collembola in ecosystems are strongly influenced by both biotic and abiotic factors. Abiotic factors, such as temperature and moisture, are crucial determinants for the survival and prosperity of Collembola species in specific environments. Springtails are highly sensitive to low humidity and high temperatures due to their low natural resistance to desiccation [1,21,28,29,30]. Soil temperature also influences metabolic and reproductive rates, with moderate temperatures generally favoring greater species diversity [31]. On the other hand, biotic factors, such as plant richness, affect the availability of essential food resources and micro-habitats, directly impacting Collembola populations [22,32]. Identifying these factors is essential to determine species’ habitat preferences [21,22,33,34,35,36,37].
Therefore, the aim of this study was to identify how different environmental factors like vegetation types, seasonality, and other biotic and abiotic variables may affect the availability of basic food resources (leaf litter) for epiedaphic Collembola, and consequently influence their diversity patterns in three vegetation types of the Canárias Island, the second largest island in the APADP. Based on the bottom-up trophic theory, we hypothesize that a greater availability of food resources, especially during a favorable seasonal period (rainy season), and in locations with a more diverse vegetation, will result in increased diversity, richness, and abundance of Collembola. Additionally, the availability of food resources for Collembola on the island would be primarily influenced by environmental factors such as seasonality and vegetation profile (vegetation types).

2. Materials and Methods

2.1. Studied Area and Sampling Design

The study was conducted on Canárias Island (APADP), located in Maranhão state, in the northeastern region of Brazil (Figure 1). The island is part of an archipelago which forms the largest delta in the Americas, the Parnaíba River Delta. The region is a diverse coastal ecosystem, composed of stable dunes, riparian forests, mangroves, and restinga forests, where temporary lagoons form during the rainy season. It features a wide expanse of low-lying vegetation and shrubbery, creating favorable conditions for the movement of small animals in the sandy soil [38]. Due to the high heterogeneity of the island and its diversity of vegetation formations, the three main distinct vegetation types were selected for specimen collection, aiming to comprehensively capture environmental variability: mangrove, restinga, and riparian forest.
The restinga area is characterized by low-stature vegetation adapted to the typical seasonal flooding conditions of the Delta do Parnaíba. This vegetation forms reticular patterns around flooded areas, developing in topographical depressions that retain water due to the proximity of the water table to the soil surface [39]. The studied riparian forest is located along the shores of “Lagoa da Caiçara”, a perennial freshwater lagoon, characterized by diverse vegetation including trees, shrubs, and grasses. The sampled mangrove, situated at the base of sand dunes, features a vegetation predominantly composed of Rhizophora mangle L., known as the red mangrove [40].
We collected samples along three 200 m transects, each with five sampling sites spaced 50 m apart in each vegetation type (mangrove, riparian forest, and restinga), during the dry (September 2022) and the rainy (June 2023) seasons. The shortest distance between one transect and another was approximately 2.4 km. The distance between the transects and sampling sites, along with the exposure time of the pitfall traps, ensured the principle of independent samples, as the active dispersal capacity of Collembola is limited to very short distances [41,42]. At each sampling site, an area of 5 × 5 m was delimited for measuring environmental parameters. Environmental variables (soil moisture, temperature, pH, and leaf litter thickness) were measured at a single point within this area. Plant richness was assessed across the entire 5 × 5 m plot, while canopy cover was measured using the central pitfall trap of each sampling point as a reference. Soil gravimetric moisture content was determined using wet and dry weight values of soil samples, collected at a depth of 5 cm since we were aiming for the epiedaphic springtails, and dehydrated at 105 °C for 48 h. Grain size and organic matter analyses were performed at EMPARN (Empresa de Pesquisa Agropecuária do Rio Grande do Norte). Leaf litter thickness was measured with a ruler inserted into the litter until reaching the soil surface. Plant richness was recorded in situ through notes and photographs. Soil pH was measured with a portable meter (Akson AK95), and soil temperature with a thermometer (JProlab) inserted at a 5 cm depth. Air temperature and humidity were measured at the soil level with a digital thermo-hygrometer (Incoterm). Canopy cover analysis involved taking photographs at each sampling site center, later processed using ImageJ software [43].

2.2. Collembola Sampling and Taxonomic Identification

Specimens were sampled using pitfall traps, which consisted of disposable 400 mL cups filled with 70% ethanol. At each sampling site, we placed three pitfall traps in a straight line, spaced one meter apart from each other, which remained installed for 48 h. The contents of the three traps from the same sampling site were combined during collection and considered as a single sample. Subsequently, the collected material was sorted, morphotyped, and quantified using a stereomicroscope. Then, the slides were mounted following the procedures of Arlé and Mendonça [44] and Jordana et al. [45] combined, which involve clarifying each specimen using Nesbitt and Arlé solutions, then mounting them on slides in Hoyer’s medium. Glass slides were dried at 50 °C for about five days and were studied using a Leica DM750 optical microscope with phase contrast. Taxonomic identification was carried out using taxonomic keys and descriptions, especially from Salmon [46], Massoud [47], Betsch [48], Jordana et al. [45], Christiansen and Bellinger [49,50], Bretfeld [51], Potapov [52], Bellinger et al. [16], Nunes and Bellini [53], and Nunes et al. [54,55].

2.3. Data Analysis

All statistical analyses were performed using the R software [56] (version 4.3.3).

2.3.1. Environmental Characterization and Species Composition

The biotic and abiotic data matrices were firstly evaluated through exploratory analysis, as proposed by Zuur et al. [57]. According to the same authors, collinear abiotic factors, which presented the Variance Inflation Factor (VIF > 3), were removed from the following analyses. The environmental variables and species abundance were standardized (using the “standardize” and “Hellinger” method, respectively [58], in the “decostand” function), and then transformed into dissimilarity indices by the Euclidean method (using the “vegdist” function from the “vegan” package [59]). Abiotic factors were evaluated for multicollinearity, with those presenting values above ‘3’ being removed from this analysis, following the protocol proposed by Zuur et al. [57].
Individually, the abiotic and biotic indices were compared between the vegetation types, seasons, and the interactions of these factors, through a Permutational Multivariate Analysis of Variance (PERMANOVA; using the “adonis2” function [59]), adjusted with Bonferroni correction, with 9999 permutations. Principal Component Analysis (PCA) and Non-Metric Multidimensional Scaling Analysis (NMDS) were used to visualize the environmental and species composition data in each comparison, respectively. Additionally, an analysis of indicator species for each vegetation type and season was performed (using the “IndVal’’ function from the “labdsv” package [59]. The IndVal index combines species abundance and frequency, ranging from 0 to 100%, to assess fidelity and relative abundance in different habitats and periods [60].

2.3.2. Abundance and Alpha and Beta Diversity

Abundance and alpha and beta diversity of Collembola were compared individually between vegetation types, seasons, and the interaction of these factors through Generalized Linear Mixed Models (GLMM) for the first two indices, and PERMANOVA for the last one. Abundance was quantified by counting the number of specimens of each morphospecies collected. The alpha diversity (richness, Shannon–Weaver, Simpson, and Pielou index) was calculated using “specnumber” and “diversity” functions in the “vegan” package [59]. Species richness was quantified using the rarefaction method, implemented through the “iNEXT” package [61]. The Shannon–Weaver index (H′) is more sensitive to rare species in the community and is suitable for management and conservation programs; the Simpson index is less influenced by rare species; and Pielou’s evenness index (J′) allows assessing the uniformity of species distribution within communities [62]. The univariate models that evaluated abundance and species richness were adjusted to negative binomial type II distribution and Gaussian for the other alpha diversity indices, using the “glmmTMB” package [63]. Subsequently, comparisons that showed significance were tested post hoc and pairwise, using Tukey’s test. Mixed models were employed due to the failure of independence in the response variable, resulting from replicates in each sampling period. According to Zuur et al. [57], this statistical tool can be used by including a covariate (replicate) in the model to reduce or eliminate the effect of this lack of independence. These univariate analyses were validated post hoc for residual distribution using the “DHArma” package [64]. Beta diversity was determined using the “betadiver” function from the “vegan” package [59], through the Whittaker method index. This last metric index assesses the change or rate of species composition turnover from one location or period to another [65,66]. The post hoc pairwise of PERMANOVA was performed using the “pairwise.perm.manova” function of the RVAideMemoire package [67].

2.3.3. Effects of Environmental Variables on the Abundance of Collembola

The abundance of each morphospecies was related to the sampled environmental variables through Redundancy Analysis (RDA). The significance of the multivariate model and axes was verified, and the significance of the environmental variables was tested using the “envfit” function with 9999 permutations.

3. Results

3.1. Epiedaphic Collembola Community in the Canárias Island

In this study, we sampled a total of 5346 specimens of springtails, belonging to three orders, eight families, 23 genera, 31 morphospecies, and one nominal species. During the dry season, 2208 individuals were collected, belonging to three orders, six families, 16 genera, and 20 morphospecies and one nominal species. The highest abundance was observed in the riparian forest (1193), followed by the restinga (935) and the mangrove (80). During the rainy season, the total abundance was 3138 individuals, belonging to three orders, eight families, 19 genera, and 24 morphospecies. Restinga exhibited the highest abundance (1512), followed by mangrove (1335) and riparian forest (291). The richest family and genus in both seasons were Entomobryidae and Lepidocyrtus, respectively. Table 1 summarizes the taxonomic composition and abundance of Collembola in each vegetation type and season. Our study also achieved some level of stabilization in the species richness accumulation of Collembola, as observed in the accumulation curve (Figure 2).

3.2. Collembola Species Composition and Indicator Species

The Collembola assemblage in the riparian forest was predominantly composed of the morphospecies Entomobrya sp.1, Friesea sp.1, Proisotoma sp.1, Arlesia sp.1, Dicranocentrus sp.1, Lepidocyrtus sp.3, and Salina sp.1; while in the restinga and mangrove, Stenognatriopes sp.1 and Seira sp.1 were the dominant morphospecies (Figure 3a; F = 8.85; p = 0.0001). The species composition during the dry period was composed mainly by Hemisotoma sp.1, while during the rainy period, there was dominance of Proisotoma sp.1 (Figure 3b; F = 3.08; p = 0.014). In the riparian forest during the dry period, the assemblage was mostly composed of Entomobrya sp.1, Arlesminthurus sp.1, Sphaeridia sp.1, and Friesea sp.1, while during the rainy period, it was by Lepidocyrtus sp.3, Arlesia sp.1, and Dicranocentrus sp.1. In the restinga, predominance of Seira sp.2 and Stenognatriopes sp.1 was observed during the dry and rainy periods, respectively. In the mangrove, the Collembola assemblage during the dry period was mainly composed of Lepidocyrtus sp.1 and Lepidocyrtus sp.2, and during the rainy period by Pseudosinella sp.2 (Figure 3c; F = 4.13; p = 0.0003). Twelve indicator species of Collembola were observed among the vegetation types, and two during the seasons (Table 2).

3.3. Environmental Characterization of Each Vegetation Type and Seasons

The riparian forest exhibited the highest values of soil moisture, plant richness, silt, and leaf litter, while the restinga showed higher air and soil temperatures, and in the mangrove higher pH and soil temperature values were recorded (Figure 4a; F = 6.61; p = 0.0001). During the rainy season, higher values of plant richness, soil moisture, leaf litter, and air and soil temperature were recorded, while during the dry season, higher values of pH, canopy coverage, and silt were observed (Figure 4b; F = 4.18; p = 0.0004). The interaction between the spatiotemporal factors (vegetation type and seasons) was similar to the pattern described earlier, showing no statistical significance (Figure 4c; F = 1.71; p = 0.0537).

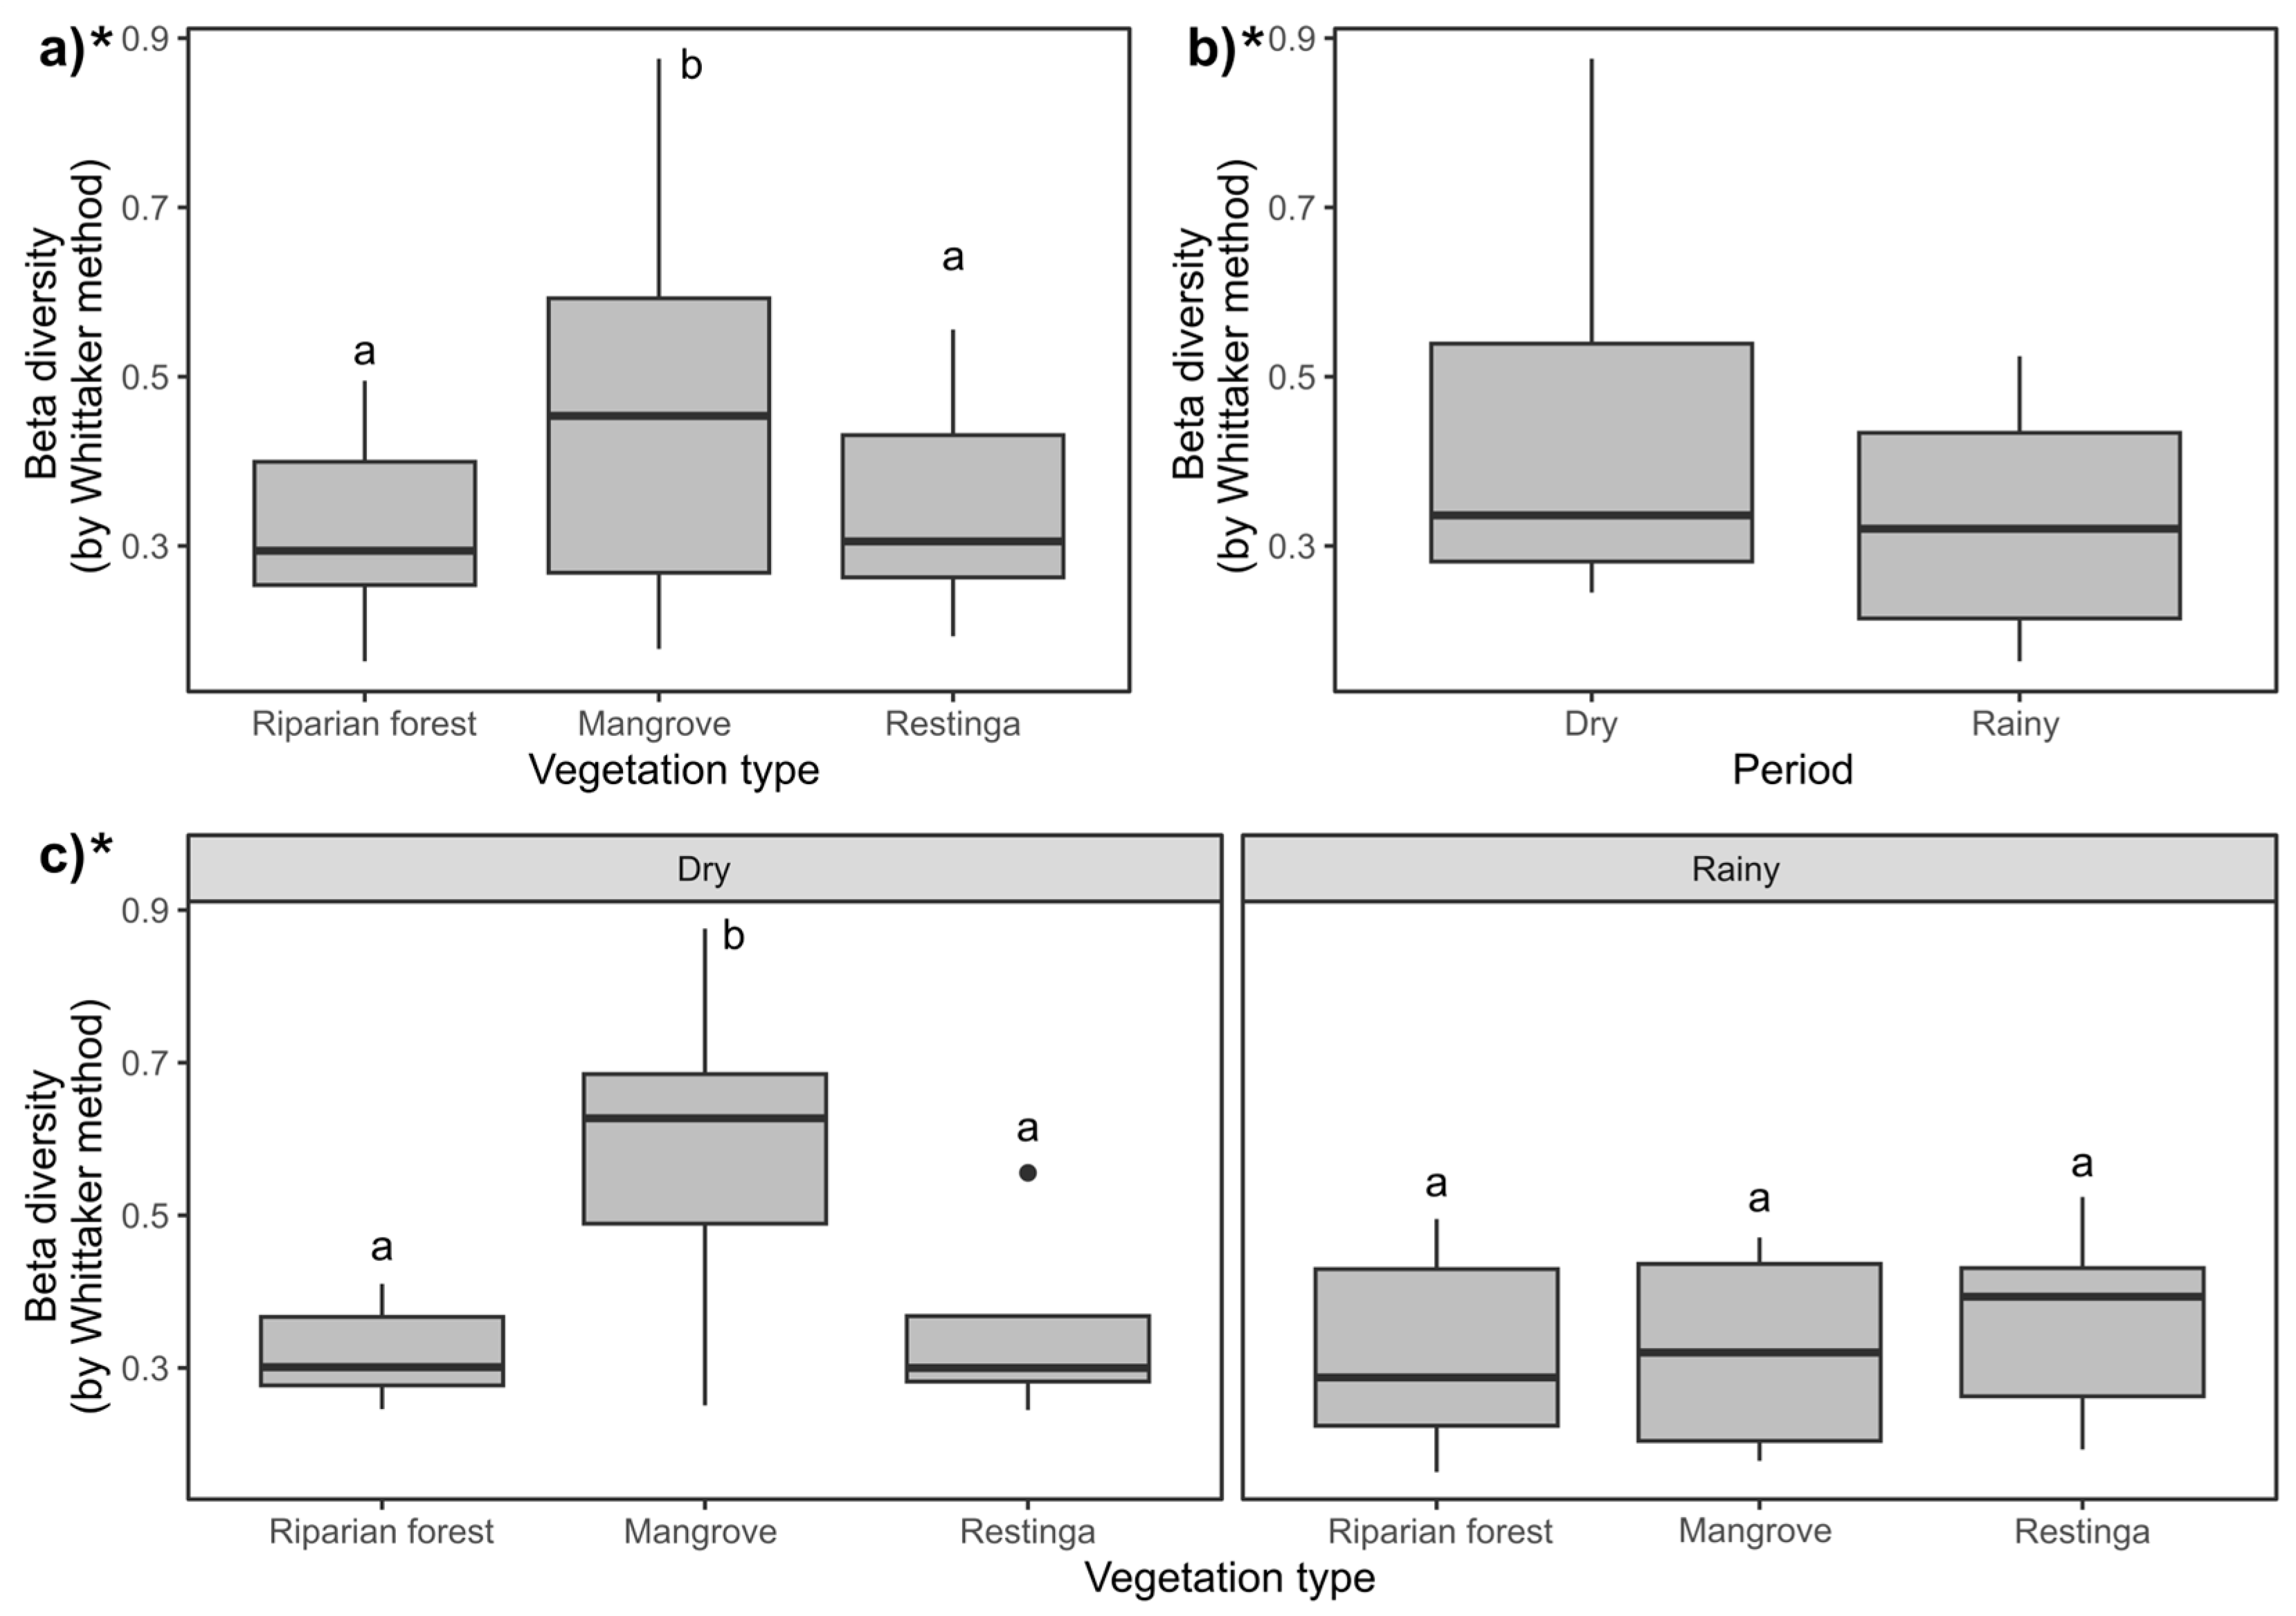
3.4. Abundance and Alpha and Beta Diversity of Collembola

The abundances of Collembola did not differ significantly between vegetation types (Figure 5a; F = 15.80; p = 0.0003) and seasons (Figure 5b; F = 3.91; p = 0.04; despite presenting p < 0.05, Tukey’s post hoc comparison did not endorse such differences). During the dry season, the mangrove exhibited the lowest abundance compared to other areas, being lower than the abundance sampled in the same area during the rainy season (Figure 5c; F = 16.58; p = 0.0002).
The highest species richness was observed in the riparian forest (Figure 6a; F = 21.36; p = 0.00002); however, no significant difference was found between the sampled periods (seasons) (Figure 6b; F = 0.5259; p = 0.46). The same pattern described previously was observed in the interaction of spatiotemporal factors (Figure 6c; F = 5.89; p = 0.052).
The Shannon–Weaver diversity was higher in the riparian forest, while the mangrove and restinga were similar to each other regarding this index (Figure 7a; F = 8.84; p = 0.014). The highest diversity was recorded during the rainy season (Figure 7b; F = 11.81; p = 0.0005). The Shannon–Weaver index showed high values in the riparian forest during the rainy season compared to the other vegetation types in each evaluated season (Figure 7c; F = 15.09; p = 0.0005). Simpson diversity did not differ among the vegetation types (Figure 8a; F = 0.01; p = 0.99) and seasons (Figure 8b; F = 5.77; p = 0.01; despite presenting p < 0.05, Tukey’s post hoc comparison did not endorse such differences). This index, during the rainy season, was higher in the riparian forest than in the mangrove, not differing from the other vegetation types in each evaluated period (Figure 8c; F = 10.66; p = 0.004).
The Pielou index did not differ among the sampled vegetation types (Figure 9a; F = 10.62; p = 0.004) and seasons (Figure 9b; F = 9.27; p < 0.0001; despite presenting p < 0.05, Tukey’s post hoc comparison did not endorse such differences). In the mangrove area, this index was lower during the rainy season, with values lower than those seen in the riparian forest, not differing from the others (Figure 9c; F = 32.93; p < 0.001).
Beta diversity was higher in the mangrove (Figure 10a; F = 8.61; p = 0.0001) and during the dry season (Figure 10b; F = 4.32; p = 0.0019). In the dry season in the mangrove, the highest values of this index were observed (Figure 10c; F = 3.68; p = 0.0006).

3.5. Influence of Environmental Variables on Species Composition

When relating morphospecies abundance to environmental variables in RDA, only RDA axis 1 was significant, explaining 53.5% of the variation (F = 8.82; p = 0.001; Table A3). Owing to this, only the eigenvalues of this axis were considered in this analysis. The abundance of Seira sp.2, Pseudosinella sp.1, and Seira sp.1 were positively associated with soil and air temperatures and pH, and negatively correlated with soil moisture, plant richness, and leaf litter. Dicranocentrus sp.1, Proisotoma sp.1, Lepidocyrtus sp.3, and Salina sp.1 were positively influenced by soil moisture, plant richness, and leaf litter, and negatively affected by soil and air temperatures and pH. Other morphospecies had low explanatory power for the sampled variables (Table A3, Figure 11).

4. Discussion

4.1. First Records of Collembola Fauna from Canárias Island

This study provides the first data on the taxonomic composition of the Collembola fauna in the APADP, as well as for the Parnaíba River Delta itself, where no previous study on springtails has been conducted before. Our data have significantly expanded the record of genera and families in the State of Maranhão, Brazil, as well as the recognition of one nominal species. Until now, Maranhão had records of only three species across its entire extent: Seira dowlingi Wray [68] (Entomobryomorpha, Entomobryidae), Temeritas surinamensis Delamare-Deboutteville and Massoud [69], and Temeritas amazonensis Arlé and Oliveira [69] (Symphypleona, Sminthuridae). With the data from this inventory, Maranhão now has records of 22 further genera, six families, and representatives of the order Poduromorpha, as well as another nominal species, Axelsonia tubifera Strenzke [70] (Entomobryomorpha, Isotomidae).
Species of the order Entomobryomorpha were the most represented in the samples, mainly representatives of Entomobryoidea, the largest superfamily of Collembola, which is currently composed by two families: Entomobryidae and Orchesellidae [71]. All families recorded in this study have been previously recorded in Brazil, as well as most of the genera, except for Megacyphoderus Delamare-Deboutteville [72], which represents the first record of the genus for the Neotropical Region [16,17]. It is worth noting that at least some of the morphospecies obtained in this study are likely new species to science, yet to be described, as already observed by us for Seira Lubbock, Cyphoderus Nicolet [73], Megacyphoderus, Rhynchocyrtus Mendonça and Fernandes [74], and Sminthurides Börner [75] sampled taxa. Thus, it is expected that with the continuation of this study, new taxa will be described for the APADP region.

4.2. Effects of Environmental Variables on Collembola Diversity

The availability of food resources at the base of a food chain (such as plants or decaying organic matter) and physical environmental alterations affect the abundance and population dynamics of consumer organisms at higher trophic levels, acting as bottom-up control forces [76,77,78,79]. Trophic cascade dynamics (both bottom-up and top-down) are crucial for regulating structural and functional changes in ecological communities by interconnecting organism diversity and abundance across various trophic levels [80].
Bottom-up trophic cascades are recognized as indirect effects of plant diversity in higher trophic levels, mediated by herbivorous taxa. Variations in species richness, abundance, productivity, and quality of plants directly impact herbivores, which in turn influence other trophic levels [77]. Therefore, the higher plant richness observed in riparian forest suggests that it may support greater species diversity of springtails, supporting our initial hypothesis. Compared to the other vegetation types, the riparian forest exhibits greater environmental heterogeneity, with higher values of plant richness, soil moisture, and leaf litter density. A heterogeneous environment positively impacts Collembola communities by altering spatial patterns such as microclimatic conditions and structural characteristics of various microhabitats [81,82]. This diversity supports the establishment and persistence of Collembola by offering a greater number of microhabitats for shelter, protection from predators, and enhanced food availability and variety. Consequently, such environments foster higher richness and abundance of soil organisms [83]. Thus, the combination of these factors influences not only the availability of food resources but also the habitat quality for soil mesofauna.
Previous studies have sought to understand how environmental factors affect the Collembola community in Neotropical environments. The results demonstrated a positive relationship between certain environmental variables and Collembola assemblages, such as greater and more heterogeneous vegetation cover, optimal temperatures, and soil moisture, and the Collembola communities [20,21,22,23,24,37]. These findings partially corroborate the results of this study, which identified a positive influence of soil moisture, leaf litter, and plant richness on the epiedaphic Collembola community.
The feeding behavior of Collembola species varies among their different forms. Those inhabiting the soil surface (epiedaphic) are typically detritivorous [84,85], meaning they mostly consume soil microbes, plant decaying material, and other organic matter from the soil. Consequently, higher plant diversity is usually associated with a greater variety of food resources, providing habitat and sustenance for a range of springtails species. This relationship could explain the strong influence of plant richness on Collembola abundance observed in this study, since it contributes to the production of a more heterogeneous leaf litter, also able to support a wider range of soil fungi and bacteria species, which aligns with various Collembola feeding habits, either directly or indirectly [22,32,86,87].
Soil moisture was the primary influencing factor on Collembola abundance in this study. Moisture is a determining factor for springtails, as the majority of this fauna has low desiccation tolerance, leading to an expected reduced abundance and richness under conditions of elevated temperature and decreased water availability. This may be associated with their morphophysiological characteristics, such as small body size, thin exoskeleton, and physiological difficulty in retaining water [16,34,88]. Furthermore, this variable is determinant for the structure of soil communities, and when altered, it can affect directly or indirectly the availability of certain food resources at the base of the food chain [29]. Together with temperature, soil moisture not only determines the ideal habitat for springtails but also influences reproduction and growth rates of individuals, as well as their vertical distribution along the soil profile [31]. Thus, water availability can be considered one of the key factors in sustaining soil-dwelling fauna, as it not only favors the increase in organic matter availability in soils through enhanced plant production, but also supports the maintenance and reproduction of microorganisms such as fungi and bacteria, which are also relevant energy sources for Collembola [89,90,91]. Therefore, low humidity levels affect the availability of these resources and the survival of most species, favoring the maintenance only of those that have adaptations to more drastic environmental conditions.
Despite the overall sensibility of springtails to high temperatures [1], some species are adapted to these conditions to some extent, as we observed in mangrove and restinga. Among the morphospecies with higher resilience to adverse conditions were two Seira and one Pseudosinella Schäffer taxa. The tolerance of Seira to inhabit dry and hot environments has already been observed in areas such as the Caatinga, the main semiarid domain seen in Brazil, possibly making it one of the richest and most abundant genera in the northeastern region of the country [17,21,22,92]. Its high resilience is often associated with morphophysiological characteristics, such as a dense covering of chaetae, scales, and body pigmentation, which provide protection against dehydration and ultraviolet radiation [20,21,23,50].
The mangrove showed the greatest variations in abundance and high values of beta diversity. This implies that, compared to the other ecosystems herein studied, this environment has a more distinct species composition, which may result from unique environmental conditions. In mangroves, seasonal fluctuations and the circadian variation of the tide primarily cause changes in soil salinity and temperature, leading to alterations in the local fauna composition, which tends to show adaptations to endemic conditions [93,94,95,96,97]. An example of adaptation to intertidal zones is found in the genus Axelsonia Börner, recorded in the Mangrove with the species A. tubifera, which includes species from marine zones with commensal habits, such as living in the gill chambers of terrestrial crabs [98]. However, during the rainy season, the fauna of the mangrove resembled that of other ecosystems, which can be attributed to the modifications in this environment. During this period, the island undergoes intense changes in its conditions, with large parts, including the surrounding areas of the mangrove, becoming submerged. In this scenario, some taxa of soil mesofauna, such as springtails, may exhibit remarkable flexibility in their responses to the flooding. Instead of significant changes in their species composition (some taxa emerging while others disappear), the primary expected change is in the relative dominance of the existing species [99]. So we believe that, although the mangrove fauna may look similar to that of other ecosystems during floods, this resemblance is likely due to changes in the relative dominance of the species already present, rather than drastic changes in species composition. This adjustment in dominance reflects the organisms’ ability to adapt to environmental changes, allowing the community structure to remain at least partially stable even in the face of significant disturbances.
Our findings provide an early view into the environmental characteristics and their impact in Collembola diversity in APADP. However, it is worth noting the limitations of this study, as it was conducted over a single year. The effects of environmental factors on biological communities can vary widely in terms of both time and space, occurring over short or long periods and ranging from small local scales to the global scale [100,101]. Thus, a one-year survey study may not fully capture the interannual variations inherent in these ecosystems, influenced by phenomena such as climatic fluctuations, seasonal changes, and anthropogenic activities. While our findings are valuable, further longitudinal studies are needed to validate them and deepen our understanding of ecological dynamics in the sampled island. We would also like to emphasize that, while our data corroborate other studies, highlighting the importance of soil moisture and vegetation richness in saline environments [37,102], it is important to acknowledge that other unassessed factors, such as the salinity levels in the mangrove, could influence the data we obtained.

4.3. Contributions to Local Conservation

Previous studies supported that springtails can be considered potential bioindicators of soil conditions across different types of ecosystems and vegetation [103,104,105]. They are found at various depths, influenced by multiple factors, and exhibit more immediate responses to environmental changes, especially due to their small size. Consequently, they can provide early information about soil health and environmental quality by indicating balance or disturbance [105]. Thus, in this study, we provide a list of potential indicator morphospecies for each vegetation type, which can be used in conservation strategies for the areas studied (see Table 2 for a detailed list of them). Monitoring their populations may guide conservation efforts and the adjustment of management practices, ensuring the protection and recovery of the studied ecosystems. A species that occupies only one or a few specific habitats may serve as a more robust ecological indicator of environmental changes than a habitat generalist species, due to its greater vulnerability to local or regional extinction [60].
Indicator species can be used for multiple purposes, especially to evaluate the environmental condition, including revealing evidence of habitat degradation [106]. Considering the scenario of APADP, the mangrove is vital for the local island human population, because it provides essential food and economic benefits to the resident families [38]. Therefore, conservation strategies promoting the sustainable use of these habitats are essential to ensure their preservation and continued use. Furthermore, the studied area is an “Área de Proteção Ambiental” (APA)—Sustainable Use Protected Area. This status emphasizes the importance of monitoring environmental conditions, given the presence of various economic activities on the island that can significantly impact the local environment, such as natural resource extraction, intense tourist vehicle traffic, urban expansion, and waste generation by residents. These activities highlight the need for rigorous environmental monitoring and management. In this context, indicator species can serve as a valuable tool for developing conservation strategies that guarantee the sustainability of ecosystems and the well-being of communities that depend on them.

5. Conclusions

The results obtained in this study demonstrate that the distribution patterns of Collembola species in APADP are strongly influenced by spatiotemporal factors, especially vegetation richness, soil moisture, and the rainy season. Our data highlight the importance of environmental heterogeneity in the establishment and persistence of Collembola fauna in the Neotropical Region, as it enhances the availability of food resources and shelters against predators. Additionally, it was observed that local ecological processes shape the species composition in each vegetation type, and changes in these patterns, such as natural disturbances, are expected to lead to shifts in species composition, as observed in the mangrove compared to the restinga and riparian forest, which exhibited higher beta diversity. Given the importance of local ecological processes in shaping species composition, future research should prioritize long-term monitoring to understand the effects of climatic variations and anthropogenic disturbances. Practical applications of these findings include using Collembola as bioindicators for soil health monitoring, supporting restoration efforts, and informing conservation strategies, ultimately contributing to agricultural sustainability and improved ecosystem services.

Author Contributions

Conceptualization, M.G.d.M.L., B.C.B. and R.C.N.; methodology, M.G.d.M.L. and F.A.d.M.F.; software, M.G.d.M.L., A.d.O.M. and C.D.D.d.S.; validation, M.G.d.M.L., B.C.B., F.A.d.M.F. and B.W.; formal analysis, M.G.d.M.L. and A.d.O.M.; investigation, M.G.d.M.L.; resources, B.C.B. and R.C.N.; data curation, M.G.d.M.L., B.M.d.S., R.C.N., B.C.B. and G.d.S.M.; writing—original draft preparation, M.G.d.M.L., A.d.O.M., R.C.N. and B.C.B.; writing—review and editing, A.d.O.M., R.C.N. and B.C.B.; visualization, A.d.O.M., M.G.d.M.L., F.A.d.M.F. and B.W.; supervision, R.C.N. and B.C.B.; project administration and funding acquisition, R.C.N., B.C.B. and M.G.d.M.L. All authors have read and agreed to the published version of the manuscript.

Funding

This research was funded by the National Council for Scientific and Technological Development (CNPq), grant numbers #309114/2021-7 (B.C.B. project) and #442421/2023-0 (A.d.O.M. and F.A.d.M.F. project); and the Coordination for the Improvement of Higher Education Personnel (CAPES), grant number #001 (M.G.d.M.L., B.M.d.S. and C.D.D.d.S. scholarship grants).

Institutional Review Board Statement

Ethical review and approval were not required for this study under Brazilian law, which does not mandate institutional ethics committee permission for taxonomical/ecological studies involving microarthropods.

Data Availability Statement

All the main data are present in the article. The biological material is stored at CC/UFRN, as noted previously.

Acknowledgments

We would like to express our heartfelt gratitude to Domingos Sávio do Santos (Fortaleza), José Aldo de Oliveira, and Claudiana Carvalho da Costa, residents of the sampled island, whose guidance and local knowledge were invaluable for the completion of this project. We would also like to thank Iandra Vitória Bezerra Rodrigues and Ayrla Maria do Nascimento Silva for their support during the collection of biological material, and Paolla Gabryelle Cavalcante de Souza for the assistance with Trogolaphysa and Cyphoderus identification.

Conflicts of Interest

The authors declare no conflicts of interest.

Appendix A

Table A1. Legend of morphospecies abbreviations.
AbbreviationsMorphospecies
Sei_sp3Seira sp.3
Pro_sp.1.1Proisotoma sp.1
Bra_sp.1Brachystomella sp.1
Par_sp.1Parasminthurides sp.1
Tro_sp.1Trogolaphysa sp.1
Arle_sp.1Arlesia sp.1
Cal_sp.2Calvatomina sp.1
Lep_sp3Lepidocyrtus sp.3
Dic_sp.1Dicranocentrus sp.1
Fri_sp.1Friesea sp.1
Sph_sp.1Sphaeridia sp.1
Arlm_sp.1Arlesminthurus sp.1
Ent_sp.1Entomobrya sp.1
Cyp_sp.1Cyphoderus sp.1
Sal_sp.1Salina sp.1
Pro_sp.1Prorastriopes sp.1
Hem_sp.1Hemisotoma sp.1
Lep_sp4Lepidocyrtus sp4
Lep_sp.1Lepidocyrtus sp.1
Pse_sp.1Pseudosinella sp.1
Ste_sp.1Stenognatriopes sp.1
Cyp_sp.2Cyphoderus sp.2
Sei_sp.1Seira sp.1
Sei_sp.2Seira sp.2
Pse_sp.2Pseudosinella sp.2
Meg_sp.1Megacyphoderus sp.1
Lep_sp.2Lepidocyrtus sp.2
Cyp_sp.1Cyphoderus sp.1
Smi_sp.1Sminthurides sp.1
Axe_tubAxelsonia tubífera
Cal_sp.1Calvatomina sp.1
Ryn_sp.1Rynchocyrtus sp.1
Table A2. Descriptive data of biotic and abiotic factors of each vegetation type and season. The data are distributed by replicas in each season (sampling sites). Abbreviations legend: Soil_mois: soil moisture, Plant_rich: plant richness, Canop_cove: canopy cover, Soil_temp: soil temperature, Air_temp: air temperature.
Vegetation TypesSeasonBiotic and Abiotic Factors
pHSoil_m. (%)Plant_rich.Canopy_cov.
(%)
Leaf_litt.
(cm)
Soil_temp.
(°C)
Air_tem.
(°C)
Silt
(G·kg−1)
riparian forestdry5.4512.340027.628.41
riparian forestdry5.562560026.928.16
riparian forestdry6.256.880027.127.811
riparian forestdry4.7351.3490025.827.3104
riparian forestdry5.3414.74002727.716
riparian forestrainy3.453.5404.629.430.45
riparian forestrainy3.9118.6605.829.630.33
riparian forestrainy2.4453.6873317.929.860
riparian forest rainy4.582.5489.48.328.529.10
riparian forestrainy4.5522.7481.22.527.329.419
mangrovedry5.3211.6172.8027.334.711
mangrovedry5.8111.9266026.6326
mangrovedry5.678.1180.8026.730.82
mangrovedry5.534376.63.52730.25
mangrovedry6.744.8166026.1303
mangroverainy5.142.9174.73.929.131.23
mangroverainy5.972741.928.930.54
mangroverainy5.913.9188035.930.418
mangroverainy5.35.6383.43.529.130.14
mangroverainy5.297.71901.529.629.97
restingadry5.430.385783.328.130.59
restinga dry4.231583.51.228.129.81
restingadry5.470.27402.23029.88
restinga dry4.560.1420030.6314
restingadry4.50.982530.928.530.34
restinga rainy5.270.8584.92.328.831.310
restingarainy5.332.3586.44.628.731.28
restinga rainy5.910.940230.133.810
restingarainy5.231202.53034.210
restinga rainy3.7232802.827.732.86
Legends: m. = moisture; rich. = richness; cov. = covering; litt. = litter; temp. = temperature.
Table A3. Results of Redundancy Analysis: ordination of the first two axes, with environmental variables and species abundance. Values in bold indicate statistical significance (p ≤ 0.05).
RDAEigenvalueProp. Exp (%)FPr(>F)
Axis 10.151353.58.82150.001
Axis 20.0564119.93.28810.154
Environmental variablesAxis 1Axis 2R2 (%)Pr(>r)
Air temperature−0.5324−0.267210.35480.0030
Soil temperature−0.62860.297910.48390.0001
Leaf litter0.21850.505690.30350.0066
pH−0.1179−0.491840.25580.0172
Soil moisture0.90910.114980.83960.0001
Silt0.41220.090450.17810.0743
Canopy cover−0.1779−0.247480.09290.2650
Plant richness0.52490.548580.57640.0002
Species RDA 1RDA 2
Dicranocentrus sp.10.4074470.181268
Salina sp.10.192204−0.025743
Seira sp.1−0.1290280.068696
Seira sp.2−0.7231280.204037
Entomobrya sp.10.0584640.008867
Lepidocyrtus sp.10.008595−0.160058
Lepidocyrtus sp.2−0.026549−0.290782
Lepidocyrtus sp.30.2112190.129210
Cyphoderus sp.1−0.009720−0.051714
Cyphoderus sp.2−0.0106480.013956
Cyphoderus sp.30.0078890.001139
Megacyphoderus sp.1−0.0155550.009122
Rynchocyrtus sp.10.005168−0.089422
Lepidocyrtus sp.40.0613970.011687
Trogolaphysa sp.10.1087530.039725
Parasminthurides sp.10.1051910.105027
Sphaeridia sp.10.0851550.096742
Calvatomina sp.1−0.016736−0.166340
Sminthurides sp.1−0.009720−0.051714
Prorastriopes sp.1−0.0132930.055020
Axelsonia tubífera−0.009610−0.286822
Proisotoma sp.10.3381630.077658
Hemisotoma sp.10.1289380.040351
Friesea sp.10.039509−0.004917
Arlesminthurus sp.10.0508040.069783
Calvatomina sp.20.0508040.069783
Stenognathriopes sp.1−0.0106480.013956
Arlesia sp.10.0034550.013956
Brachystomella sp.10.0525880.031370
Pseudosinella sp.1−0.1716060.090981
Pseudosinella sp.2−0.005868−0.008230
Seira sp.3−0.002150−0.009414

References

  1. Hopkin, S.P. Biology of Springtails (Insecta: Collembola), 1st ed.; Oxford University Press: Oxford, MS, USA, 1997; pp. 1–344. [Google Scholar]
  2. Potapov, A.; Bellini, B.C.; Chown, S.L.; Deharveng, L.; Janssens, F.; Kováč, Ľ.; Kuznetsova, N.; Ponge, J. Towards a global synthesis of Collembola knowledge challenges and potential solutions. Soil Organ. 2020, 92, 161–188. [Google Scholar] [CrossRef]
  3. Cassagne, N.; Gers, C.; Gauquelin, T. Relationships between Collembola, soil chemistry and humus types in forest stands. Biol. Fertil. Soils 2003, 37, 355–361. [Google Scholar] [CrossRef]
  4. Castaño-Meneses, G.; Palacios-Vargas, J.G.; Cutz-Pool, L.Q. Feeding habits of Collembola and their ecological niche. Anales Inst. Biol. Ser. Zool. 2004, 75, 135–142. [Google Scholar]
  5. Hoffmann, R.B.; Nascimento, M.S.V.; Diniz, A.A.; Araújo, L.H.A.; Souto, J.S. Diversidade da mesofauna edáfica como bioindicadora para o manejo do solo em Areia, Paraíba, Brasil. Rev. Caatinga 2009, 22, 122–125. [Google Scholar]
  6. Melo, F.V.; Brown, G.G.; Constantino, R.; Louzada, J.N.C.; Luizão, F.J.; Morais, J.W.; Zanetti, R. A importância da meso e macrofauna do solo na fertilidade e como bioindicadores. Bol. Inf. SBCS 2009, 34, 39–43. [Google Scholar]
  7. Berude, M.; Galote, J.K.B.; Pinto, P.H.; Amaral, A.A. A mesofauna do solo e sua importância como bioindicadora. Enciclop. Biosfera 2015, 11, 14–28. [Google Scholar]
  8. Greenslade, P. The potential of Collembola to act as indicators of landscape stress in Australia. Aust. J. Exp. Agric. 2007, 47, 424–434. [Google Scholar] [CrossRef]
  9. Baretta, D.; Ferreira, C.S.; Sousa, J.P.; Cardoso, E.J.B.N. Colêmbolos (Hexapoda: Collembola) como bioindicadores de qualidade do solo em áreas com Araucaria angustifolia. Rev. Bras. Cienc. Solo 2008, 32, 2693–2699. [Google Scholar] [CrossRef]
  10. Nakamori, T.; Fujimori, A.; Kinoshita, K.; Ban-nai, T.; Kubota, Y.; Yoshida, S. mRNA expression of a cadmium-responsive gene is a sensitive biomarker of cadmium exposure in the soil collembolan Folsomia candida. Environ. Pollut. 2010, 158, 1689–1695. [Google Scholar] [CrossRef] [PubMed]
  11. George, P.B.; Keith, A.M.; Creer, S.; Barrett, G.L.; Lebron, I.; Emmett, B.A.; Jones, D.L. Evaluation of mesofauna communities as soil quality indicators in a national-level monitoring programme. Soil Biol. Bioch. 2017, 115, 537–546. [Google Scholar] [CrossRef]
  12. Arenhardt, T.C.P.; Vitorino, M.D.; Martins, S.V. Insecta and Collembola as bioindicators of ecological restoration in the Ombrophilous Dense Forest in Southern Brazil. Florest. Ambient. 2021, 28, e20210008. [Google Scholar] [CrossRef]
  13. Joimel, S.; Chassain, J.; Artru, M.; Faburé, J. Collembola are Among the Most Pesticide-Sensitive Soil Fauna Groups: A Meta-Analysis. Environ. Toxicol. Chem. 2022, 41, 2333–2341. [Google Scholar] [CrossRef] [PubMed]
  14. Lopes, B.C.H.; Amado, E.M.; Oliveira-Neto, M.A.; Almeida, Z.R.; Zeppelini, D. Multixenobiotic response of Collembola to soil contamination, the phisiological basis for bioindicative environmental monitoring. Chemosphere 2024, 349, 140851. [Google Scholar] [CrossRef] [PubMed]
  15. Sanders, S.K.; Martínez-De León, G.; Formenti, L.; Thakur, M.P. How will climate change affect the feeding biology of Collembola? Soil Biol. Biochem. 2024, 188, 109244. [Google Scholar] [CrossRef]
  16. Bellinger, P.F.; Christiansen, K.A.; Janssens, F. Checklist of the Collembola of the World. Available online: http://www.collembola.org (accessed on 10 January 2024).
  17. Zeppelini, D.; Queiroz, G.C.; Bellini, B.C. Collembola in Catálogo Taxonômico da Fauna do Brasil. PNUD. Available online: http://fauna.jbrj.gov.br/fauna/faunadobrasil/379/ (accessed on 20 January 2024).
  18. Abrantes, E.A.; Bellini, B.C.; Bernardo, A.N.; Fernandes, L.H.; Mendonça, M.C.; Oliveira, E.P.; Queiroz, G.C.; Sautter, K.D.; Silveira, T.C.; Zeppelini, D. Errata Corrigenda and update for the “Synthesis of Brazilian Collembola: An update to the species list.” ABRANTES et al. (2010) Zootaxa, 2388: 1–22. Zootaxa 2012, 3168, 1–21. [Google Scholar] [CrossRef]
  19. Joimel, S.; Schwartz, C.; Bonfanti, J.; Hedde, M.; Krogh, P.H.; Pérès, G.; Cortet, J. Functional and taxonomic diversity of Collembola as complementary tools to assess land use effects on soils biodiversity. Front. Ecol. Evol. 2021, 9, 630919. [Google Scholar] [CrossRef]
  20. Zeppelini, D.; Queiroz, G.C.; Abrantes, E.A.; Bellini, B.C.; Medeiros, E.S.F.; Oliveira, E.P.; Silveira, T.C.; Neves, A.C.R.; Soares, A.F.; Godeiro, N.N.; et al. Diversity of Collembola (Arthropoda: Hexapoda) across different types of vegetation in Brazil. Int. J. Biodivers. Conserv. 2013, 5, 176–184. [Google Scholar]
  21. Ferreira, A.S.; Bellini, B.C.; Vasconcellos, A. Temporal variations of Collembola (Arthropoda: Hexapoda) in the semiarid Caatinga in northeastern Brazil. Zoologia 2013, 30, 639–644. [Google Scholar] [CrossRef]
  22. Ferreira, A.S.; Rocha, I.M.D.S.; Bellini, B.C.; Vasconcellos, A. Effects of habitat heterogeneity on epiedaphic Collembola (Arthropoda: Hexapoda) in a semiarid ecosystem in Northeast Brazil. Zoologia 2018, 35, e13653. [Google Scholar] [CrossRef]
  23. Winck, B.R.; Sá, E.L.S.; Rigotti, V.M.; Chauvat, M. Relationship between land-use types and functional diversity of epigeic Collembola in Southern Brazil. Appl. Soil Ecol. 2017, 109, 49–59. [Google Scholar] [CrossRef]
  24. Silva, C.D.D.; Bellini, B.C.; Rigotti, V.M.; Nunes, R.C.; Menezes, L.D.S.; Winck, B.R. Diversity Loss of Epigeic Collembola after Grassland Conversion into Eucalyptus Forestry in Brazilian Pampa Domain. Diversity 2022, 14, 490. [Google Scholar] [CrossRef]
  25. Castro, A.A.J.F. Unidades de planejamento: Uma proposta para o Estado do Piauí com base na dimensão diversidade de ecossistemas. Publicações Avulsas Conserv. Ecossistemas 2007, 18, 1–28. [Google Scholar] [CrossRef]
  26. ICMBio. Plano de Manejo da Área de Proteção Ambiental do Delta do Parnaíba, 1st ed; Ministério do Meio Ambiente: Brasília, Brazil, 2020; pp. 1–77. [Google Scholar]
  27. Pereira, L.C.; Silveira, P.C.B. Humanos e caranguejos nos manguezais do Delta do Parnaíba: Histórias da paisagem. Rev. Anth. 2021, 32, 248380. [Google Scholar] [CrossRef]
  28. Butcher, J.W.; Snider, R.; Snider, R.J. Bioecology of edaphic Collembola and Acarina. Annu. Rev. Entomol. 1971, 16, 249–288. [Google Scholar] [CrossRef]
  29. Daghighi, E.; Koehler, H.; Kesel, R.; Filser, J. Long-term succession of Collembola communities in relation to climate change and vegetation. Pedobiologia 2017, 64, 25–38. [Google Scholar] [CrossRef]
  30. Mawan, A.; Hartke, T.R.; Deharveng, L.; Zhang, F.; Buchori, D.; Scheu, S.; Drescher, J. Response of arboreal Collembola communities to the conversion of lowland rainforest into rubber and oil palm plantations. BMC Ecol. Evol. 2022, 22, 144. [Google Scholar] [CrossRef]
  31. Pompeo, P.N.; Santos, M.A.B.; Biasi, J.P.; Siqueira, S.; Rosa, M.G.; Baretta, C.R.D.M.; Baretta, D. Fauna e sua relação com atributos edáficos em Lages, Santa Catarina-Brasil. Sci. Agrar. 2016, 17, 42–51. [Google Scholar]
  32. Hasegawa, M.; Ota, A.T.; Kabeya, D.; Okamoto, T.; Saitoh, T.; Nishiyama, Y. The effects of mixed broad-leaved trees on the collembolan community in larch plantations of central Japan. Appl. Soil Ecol. 2014, 83, 125–132. [Google Scholar] [CrossRef]
  33. Bull, J.C.; Pickup, N.J.; Pickett, B.; Hassell, M.P.; Bonsall, M.B. Metapopulation extinction risk is increased by environmental stochasticity and assemblage complexity. Proc. Roy. Soc. B Biol. Sci. 2007, 274, 87–96. [Google Scholar] [CrossRef]
  34. Kardol, P.; Reynolds, W.M.; Norby, R.J.; Classen, A.T. Climate change effects on soil microarthropod abundance and community structure. App. Soi. Ecol. 2011, 47, 37–44. [Google Scholar] [CrossRef]
  35. Heiniger, C.; Barot, S.; Ponge, J.F.; Salmon, S.; Meriguet, J.; Carmignac, D.; Dubs, F. Collembolan preferences for soil and microclimate in forest and pasture communities. Soil Biol. Bioch. 2015, 86, 181–192. [Google Scholar] [CrossRef]
  36. Yahyapour, E.; Shayanmehr, M.; Miri, B.; Shoushtari, R.V. A study on the relative abundance and biodiversity indicators of Springtails (Hexapoda: Collembola) in two ecosystems in Mazandaran province (Iran). J. Insect Biodivers. Syst. 2022, 8, 131–144. [Google Scholar] [CrossRef]
  37. Lima, E.C.A.; Zeppelini, D.; Ferreira, A.S.; Brito, R.A.; Oliveira, J.V.L.C.; Medeiros, E.S.F.; Barreto, C. Collembola biocenoses (Arthropoda: Hexapoda) in the archipelago of Fernando de Noronha, Brazil. Eur. J. Soil Biol. 2023, 117, 103496. [Google Scholar] [CrossRef]
  38. Saraiva, N.A. Caracterização da Unidade e Temas Complementares Reserva Extrativista Marinha do Delta do Parnaíba, 1st ed.; ICMBio, Ministério do Meio Ambiente: Brasília, Brazil, 2009; pp. 1–103. [Google Scholar]
  39. Santos-Filho, F.S.; Almeida-Junior, E.B.D.; Soares, C.J.R.S.; Zickel, C.S. Fisionomias das restingas do delta do Parnaíba, Nordeste, Brasil. Rev. Bras. Geogr. Física 2010, 3, 218–227. [Google Scholar] [CrossRef]
  40. Meireles, V.J.S.; Meireles, M.P.A.; Lemos, J.R.; Barros, R.F.M.; Campos, J.B. Impactos da extração madeireira sobre a estrutura de um bosque de mangue na APA Delta do Parnaíba. Gaia Sci. 2021, 15, 218–227. [Google Scholar]
  41. Schuppenhauer, M.M.; Lehmitz, R.; Xylander, W.E.R. Slow-moving soil organisms on a water highway: Aquatic dispersal and survival potential of Oribatida and Collembola in running water. Mov. Ecol. 2019, 7, 20. [Google Scholar] [CrossRef]
  42. Querner, P.; Bruckner, A.; Drapela, T.; Moser, D.; Zaller, J.G.; Frank, T. Landscape and site effects on Collembola diversity and abundance in winter oilseed rape fields in eastern Austria. Agric. Ecosyst. Environ. 2013, 164, 145–154. [Google Scholar] [CrossRef]
  43. Schneider, C.A.; Rasband, W.S.; Eliceiri, K.W. NIH Image to ImageJ: 25 years of image analysis. Nat. Methods 2012, 9, 671–675. [Google Scholar] [CrossRef]
  44. Arlé, R.; Mendonça, M.C. Estudo preliminar das espécies de Dicranocentrus Schött, 1893, ocorrentes no Parque Nacional da Tijuca, Rio de Janeiro (Collembola). Rev. Bras. Biol. 1982, 42, 41–49. [Google Scholar]
  45. Jordana, R.; Arbea, J.I.; Simón, C.; Luciàñez, M.J. Fauna Iberica. Vol. 8. Collembola Poduromorpha, 1st ed.; Consejo Superior de Investigaciones Cientificas: Madrid, Spain, 1997; pp. 1–807. [Google Scholar]
  46. Salmon, J.T. An index to the Collembola. R. Soc. N. Z. Bull. 1964, 7, 98–144. [Google Scholar]
  47. Massoud, Z. Monographie des Neanuridae, Collemboles Poduromorphes apiéces buccales modifiées. In Biologie de l’Amerique Australe, 1st ed.; Delamare Deboutteville, C., Rapoport, E.H., Eds.; Éditions du CNRS: Paris, France, 1967; Volume 3, pp. 7–399. [Google Scholar]
  48. Betsch, J.M. Éléments pour une monographie des Collemboles Symplyplêones (Hexapodes, Aptérygotes). Mém. Mus. Natl. Hist. Nat. Sér. A Zool. 1980, 116, 1–227. [Google Scholar]
  49. Christiansen, K.; Bellinger, P. The Collembola of North America North of Rio Grande, A Taxonomy Analysis, 2nd ed.; Grinnell College: Grinnell, IA, USA, 1998; pp. 1–1520. [Google Scholar]
  50. Christiansen, K.; Bellinger, P. A survey of the genus Seira (Hexapoda: Collembola: Entomobryidae) in the Americas. Caribb. J. Sci. 2000, 36, 39–75. [Google Scholar]
  51. Bretfeld, G. Synopses on Palaearctic Collembola Volume 2: Symphypleona. Abh. Ber. Nat. Görlitz 1999, 71, 1–318. [Google Scholar]
  52. Potapov, M. Synopses on Palaeartic Collembola Volume 3: Isotomidae, 1st ed.; Staaliches Museum für Naturkunde Görlitz: Görlitz, Germany, 2001; pp. 1–603. [Google Scholar]
  53. Nunes, R.C.; Bellini, B.C. Three new species of Entomobryoidea (Collembola: Entomobryomorpha) from Brazilian Caatinga-Cerrado transition, with identification keys to Brazilian Cyphoderus, Pseudosinella and Trogolaphysa species. Zootaxa 2018, 4420, 71–96. [Google Scholar] [CrossRef] [PubMed]
  54. Nunes, R.C.; Bellini, B.C. A new species of Nothobrya Arlé, 1961 (Collembola: Entomobryidae) from Brazil and notes on key characters for Nothobryinae taxonomy, with an identification key to the species of the subfamily. Zootaxa 2019, 4615, 375–391. [Google Scholar] [CrossRef] [PubMed]
  55. Nunes, R.C.; Santos-Costa, R.C.; Bellini, B.C. The first Neotropical Capbrya Barra, 1999 (Collembola: Orchesellidae: Nothobryinae) and the reinterpretation of Nothobryinae systematics. Zool. Anz. 2020, 288, 24–42. [Google Scholar] [CrossRef]
  56. R Core Team. R: A Language and Environment for Statistical Computing; R Foundation for Statistical Computing: Vienna, Austria, 2020; Available online: https://www.R-project.org/ (accessed on 10 September 2023).
  57. Zuur, A.F.; Ieno, E.N.; Elphick, C.S. A protocol for data exploration to avoid common statistical problems. Meth. Ecol. Evol. 2010, 1, 3–14. [Google Scholar] [CrossRef]
  58. Legendre, P.; Legendre, L. Numerical Ecology, 2nd ed.; Elsevier Science: Amsterdam, The Netherlands, 1998; pp. 1–853. [Google Scholar]
  59. Oksanen, J.A.R.I.; Blanchet, F.G.; Friendly, M.; Kindt, R.; Legendre, P.; Mcglinn, D.; Wagner, H. Vegan: Community Ecology Package. R Package Version 2.5–7. 2020. Available online: https://CRAN.R-project.org/package=vegan (accessed on 15 September 2023).
  60. Cáceres, M.D.; Legendre, P. Associations between species and groups of sites: Indices and statistical inference. Ecology 2009, 90, 3566–3574. [Google Scholar] [CrossRef] [PubMed]
  61. Hsieh, T.C.; Ma, K.H.; Chao, A. iNEXT: An R package for rarefaction and extrapolation of species diversity (Hill numbers). Methods Ecol. Evol. 2016, 7, 1451–1456. [Google Scholar] [CrossRef]
  62. Magurran, A.E. Medindo a Diversidade Biológica, 1st ed.; Editora UFPR: Paraná, Brazil, 2013; pp. 1–235. [Google Scholar]
  63. Brooks, M.E.; Kristensen, K.; Van Benthem, K.J.; Magnusson, A.; Berg, C.W.; Nielsen, A.; Bolker, B.M. Modeling zero-inflated count data with glmmTMB. BioRxiv 2017, 132753. [Google Scholar] [CrossRef]
  64. Hartig, F.; Lohse, L. DHARMa: Residual Diagnostics for Hierarchical (Multi-Level/Mixed) Regression Models; R package version 0.4.6 2022. Available online: https://CRAN.R-project.org/package=DHARMa (accessed on 15 November 2023).
  65. Whittaker, R.H. Vegetation of the Siskiyou mountains, Oregon and California. Ecol. Monogr. 1960, 30, 279–338. [Google Scholar] [CrossRef]
  66. Koleff, P.; Gaston, K.J.; Lennon, J.J. Measuring beta diversity for presence–absence data. J. Anim. Ecol. 2003, 72, 367–382. [Google Scholar] [CrossRef]
  67. Herve, M. RVAideMemoire: Testing and Plotting Procedures for Biostatistics. R Package Version 0.9-83-7. 2023. Available online: https://CRAN.R-project.org/package=RVAideMemoire (accessed on 23 July 2024).
  68. Cipola, N.G.; Godeiro, N.N.; Bellini, B.C. New records of Seira dowlingi (Wray, 1953) (Collembola, Entomobryidae, Seirinae) for New World. Entomol. Commun. 2019, 1, ec01003. [Google Scholar] [CrossRef]
  69. Arlé, R.; Oliveira, M.M. O gênero Temeritas Delamare & Massoud, 1963 na Amazônia (Collembola Symphypleona). Bol. Mus. Para. Emílio Goeldi Zool. 1997, 87, 1–23. [Google Scholar]
  70. Strenzke, K. Axelsonia tubifera n.sp., ein neuer arthropleoner Collembole mit Geschlechtsdimorphismus aus der brasilianischen Mangrove. Acta Zool. Cracov. 1958, 2, 607–618. [Google Scholar]
  71. Godeiro, N.N.; Ding, Y.; Cipola, N.G.; Jantarit, S.; Bellini, B.C.; Zhang, F. Phylogenomics and systematics of Entomobryoidea (Collembola): Marker design, phylogeny and classification. Cladistics 2023, 39, 101–115. [Google Scholar] [CrossRef] [PubMed]
  72. Delamare-Deboutteville, C. Recherches sur les Collemboles termithophiles et myrmécophiles. Arch. Zool. Exp. Gen. 1948, 85, 261–425. [Google Scholar]
  73. Nicolet, H. Recherches pour servir a l’Histoire des Podurelles. Nouv. Mém. Soc. Helvet Sci. Nat. 1842, 6, 1–88. [Google Scholar]
  74. Mendonça, M.C.; Fernandes, L.H. Rhynchocyrtus gen. nov. (Collembola, Entomobryidae) from the Southeast and Northeast Brazilian regions. Zootaxa 2007, 1660, 45–51. [Google Scholar] [CrossRef]
  75. Börner, C. Vorlaufige Mittheilung zur systematik der Sminthuridae Tullb. inbesondere der genus Sminthurinus latr. Zool Anz. 1900, 23, 609–618. [Google Scholar]
  76. Hunter, M.D.; Price, P.W. Playing chutes and ladders: Heterogeneity and the relative roles of bottom-up and top-down forces in natural communities. Ecology 1992, 73, 724–732. [Google Scholar] [CrossRef]
  77. Kagata, H.; Ohgushi, T. Bottom-up trophic cascades and material transfer in terrestrial food webs. Ecol. Res. 2006, 21, 26–34. [Google Scholar] [CrossRef]
  78. Heath, M.R.; Speirs, D.C.; Steele, J.H. Understanding patterns and processes in models of trophic cascades. Ecol. Lett. 2014, 17, 101–114. [Google Scholar] [CrossRef] [PubMed]
  79. Han, P.; Lavoir, A.V.; Rodriguez-Saona, C.; Desneux, N. Bottom-up forces in agroecosystems and their potential impact on arthropod pest management. Annu. Rev. Entomol. 2022, 67, 239–259. [Google Scholar] [CrossRef]
  80. DeLong, J.P.; Gilbert, B.; Shurin, J.B.; Savage, V.M.; Barton, B.T.; Clements, C.F.; O’Connor, M.I. The body size dependence of trophic cascades. Am. Nat. 2015, 185, 354–366. [Google Scholar] [CrossRef]
  81. Morris, M.G. The effects of structure and its dynamics on the ecology and conservation of arthropods in British grasslands. Biol. Conser. 2000, 95, 129–142. [Google Scholar] [CrossRef]
  82. Spiller, M.S.; Spiller, C.; Garlet, J. Arthropod bioindicators of environmental quality. Rev. Agro@ Mbiente On-Line 2018, 12, 41–57. [Google Scholar] [CrossRef]
  83. Zardo, D.C.; Carneiro, A.P.; de Lima, L.G.; Santos Filho, M. Comunidade de artrópodes associada a serrapilheira de cerrado e mata de galeria, na Estação Ecológica Serra das Araras–Mato Grosso, Brasil. Rev. Bras. Multidiscipl. 2010, 13, 105–113. [Google Scholar] [CrossRef]
  84. Ponge, J.F. Vertical distribution of Collembola (Hexapoda) and their food resources in organic horizons of beech forests. Biol. Fertil. Soils 2000, 32, 508–522. [Google Scholar] [CrossRef]
  85. Potapov, A.A.; Semenina, E.E.; Korotkevich, A.Y.; Kuznetsova, N.A.; Tiunov, A.V. Connecting taxonomy and ecology: Trophic niches of collembolans as related to taxonomic identity and life forms. Soil Biol. Biochem. 2016, 101, 20–31. [Google Scholar] [CrossRef]
  86. Salamon, J.A.; Scheu, S.; Schaefer, M. The Collembola community of pure and mixed stands of beech (Fagus sylvatica) and spruce (Picea abies) of different age. Pedobiologia 2008, 51, 385–396. [Google Scholar] [CrossRef]
  87. Sylvain, Z.A.; Wall, D.H. Linking soil biodiversity and vegetation: Implications for a changing planet. Am. J. Bot. 2011, 98, 517–527. [Google Scholar] [CrossRef]
  88. Makkonen, M.; Berg, M.P.; Van Hal, J.R.; Callaghan, T.V.; Press, M.C.; Aerts, R. Traits explain the responses of a sub-arctic Collembola community to climate manipulation. Soil Biol. Biochem. 2011, 43, 377–384. [Google Scholar] [CrossRef]
  89. Rousk, J.; Baath, E.; Brookes, P.C.; Lauber, C.L.; Lozupone, C.; Caporaso, J.G.; Knight, R.; Fierer, N. Soil bacterial and fungal communities across a pH gradient in an arable soil. ISME J. 2010, 4, 1340–1351. [Google Scholar] [CrossRef] [PubMed]
  90. Zhang, X.F.; Zhao, L.; Xu, S.J.J.R.; Liu, Y.Z.; Liu, H.S.Y.; Cheng, G.D. Soil moisture effect on bacterial and fungal community in Beilu River (Tibetan Plateau) permafrost soils with different vegetation types. J. Appl. Microbiol. 2013, 114, 1054–1065. [Google Scholar] [CrossRef]
  91. Bellini, B.C.; Weiner, W.M.; Winck, B.R. Systematics, Ecology and Taxonomy of Collembola: Introduction to the Special Issue. Diversity 2023, 15, 221. [Google Scholar] [CrossRef]
  92. Bellini, B.C.; Zeppelini, D. A new species of Seira Lubbock (Collembola, Entomobryidae) with a key to the species of Paraíba, Brazil. Rev. Bras. Entomol. 2009, 53, 266–271. [Google Scholar] [CrossRef]
  93. Duke, N.; Ball, M.; Ellison, J. Factors influencing biodiversity and distributional gradients in mangroves. Glob. Ecol. Biogeogr. Lett. 1998, 7, 27–47. [Google Scholar] [CrossRef]
  94. Field, C.; Osborn, J.; Hoffman, L.; Polsenberg, J.; Ackerly, D.; Berry, J.; Mooney, H. Mangrove biodiversity and ecosystem function. Glob. Ecol. Biogeogr. Lett. 1998, 7, 3–14. [Google Scholar] [CrossRef]
  95. Whittaker, R.J.; Willis, K.J.; Field, R. Scale and species richness: Towards a general, hierarchical theory of species diversity. J. Biogeogr. 2001, 28, 453–470. [Google Scholar] [CrossRef]
  96. Barletta, M.; Barletta-Bergan, A.; Saint-Paul, U.; Hubold, G. The role of salinity in structuring the fish assemblages in a tropical estuary. J. Fish Biol. 2005, 66, 45–72. [Google Scholar] [CrossRef]
  97. Azevedo, M.C.C.; Cruz-Filho, A.G.; Araújo, F.G. Mangrove habitat use by fishes in Southeastern Brazil: Are there temporal changes in the structure of the community? Mar. Ecol. 2016, 37, 1223–1238. [Google Scholar] [CrossRef]
  98. Christiansen, K.A.; Bellinger, P.; Janssens, F. Collembola: (Springtails, Snow Fleas). In Encyclopedia of Insects, 2nd ed.; Resh, V.H., Cardé, R.T., Eds.; Academic Press: New York, NY, USA, 2009; pp. 206–210. [Google Scholar]
  99. Russell, D.J.; Schick, H.; Nährig. Reactions of soil collembolan communities to inundation in floodplain ecosystems of the Upper Rhine Valley. In Wetlands in Central Europe: Soil Organisms, Soil Ecological Processes and Trace Gas Emissions; Springer: Berlin/Heidelberg, Germany, 2002; pp. 35–70. [Google Scholar]
  100. Franklin, J.F.; Bledsoe, C.S.; Callahan, J.T. Contributions of the long-term ecological research program. BioScience 1990, 40, 509–523. [Google Scholar] [CrossRef]
  101. Magnuson, J.J. Long-term ecological research and the invisible present. BioScience 1990, 40, 495–501. [Google Scholar] [CrossRef]
  102. Widenfalk, L.A.; Bengtsson, J.; Berggren, Å.; Zwiggelaar, K.; Spijkman, E.; Huyer-Brugman, F.; Berg, M.P. Spatially structured environmental filtering of collembolan traits in late successional salt marsh vegetation. Oecologia 2015, 179, 537–549. [Google Scholar] [CrossRef]
  103. Oliveira-Filho, L.C.I.; Klauberg Filho, O.; Baretta, D.; Tanaka, C.A.S.; Sousa, J.P. Collembola Community Structure as a Tool to Assess Land Use Effects on Soil Quality. Rev. Bras. Cienc. Solo 2016, 40, e0150432. [Google Scholar] [CrossRef]
  104. Santos, M.A.B.; Oliveira Filho, L.C.I.; Pompeo, P.N.; Ortiz, D.C.; Mafra, Á.L.; Klauberg Filho, O.; Baretta, D. Morphological diversity of springtails in land use systems. Rev. Bras. Cienc. Solo 2018, 42, e0170277. [Google Scholar] [CrossRef]
  105. Machado, J.D.S.; Oliveira Filho, L.C.I.; Santos, J.C.P.; Paulino, A.T.; Baretta, D. Morphological diversity of springtails (Hexapoda: Collembola) as soil quality bioindicators in land use systems. Biota Neotrop. 2019, 19, e20180618. [Google Scholar] [CrossRef]
  106. Mcgeoch, M.A. The selection, testing and application of terrestrial insects as bioindicators. Biol. Rev. 1998, 73, 181–201. [Google Scholar]
Figure 1. Sampling sites and their distribution throughout the Canárias Island: (A) mangrove; (B) restinga; (C) riparian forest.
Diversity 16 00445 g001
Figure 2. Accumulation curve with the interpolated (continuous line) and extrapolated (dashed line) species richness as a function of the number of individuals collected in different study areas.
Diversity 16 00445 g002
Figure 3. Morphospecies composition of Collembola assemblage between: (a) vegetation types (mangrove, restinga, and riparian Forest); (b) seasons (rainy and dry); and (c) the interaction of these factors. * Indicates statistically significant data (p < 0.05). Legends for morphospecies are detailed in Table A1.
Diversity 16 00445 g003
Figure 4. Environmental characterization of each area (through the measured variables) in this study, during the dry and rainy seasons through PCA: (a) comparison between riparian forest, mangrove, and restinga; (b) comparison between dry and rainy periods; and (c) interaction of variables with each other. * Indicates statistical significance of the presented data. Descriptive data of the abiotic and biotic factors of each vegetation types are available in Table A2.
Diversity 16 00445 g004
Figure 5. Comparison of Collembola abundance between vegetation types and seasons: (a) riparian forest, mangrove, and restinga; (b) dry and rainy seasons; and (c) interaction between spatiotemporal factors. Asterisk indicates statistical differences (p ≤ 0.05) within compared groups. For three-factor groups (vegetation type), different letters indicate statistical differences (p ≤ 0.05) between each compared couple, while the lack of letters indicates no statistical differences. For comparing two factors (period), letters were not used due to the limited number of comparisons. * Indicates statistical significance of the presented data.
Diversity 16 00445 g005
Figure 6. Comparison of Collembola morphospecies richness in the studied areas: (a) riparian forest, mangrove, and restinga; (b) in dry and rainy seasons; and (c) interaction between spatiotemporal factors. Asterisk indicates statistical differences (p ≤ 0.05) within compared groups. For three-factor groups (vegetation type), different letters indicate statistical differences (p ≤ 0.05) between each compared couple, while the lack of letters indicates no statistical differences. For comparing two factors (period), letters were not used due to the limited number of comparisons. * Indicates statistical significance of the presented data.
Diversity 16 00445 g006
Figure 7. Comparison of Shannon diversity (H′) in the study areas and periods: (a) riparian forest, mangrove, and restinga; (b) in dry and rainy seasons; and (c) interaction between spatiotemporal factors. Asterisk indicates statistical differences (p ≤ 0.05) within compared groups. For three-factor groups (vegetation type), different letters indicate statistical differences (p ≤ 0.05) between each compared couple. For comparing two factors (period), letters were not used due to the limited number of comparisons. * Indicates statistical significance of the presented data.
Diversity 16 00445 g007
Figure 8. Simpson diversity (D) in the study areas and periods: (a) riparian forest, mangrove, and restinga; (b) in dry and rainy seasons; and (c) interaction between spatiotemporal factors. Asterisk indicates statistical differences (p ≤ 0.05) within compared groups. For three-factor groups (vegetation type), different letters indicate statistical differences (p ≤ 0.05) between each compared couple, while the lack of letters indicates no statistical differences. For comparing two factors (period), letters were not used due to the limited number of comparisons. * Indicates statistical significance of the presented data.
Diversity 16 00445 g008
Figure 9. Comparison of Pielou’s evenness (J′) in the study areas and periods: (a) riparian forest, mangrove, and restinga; (b) in dry and rainy seasons; and (c) interaction between factors. Asterisk indicates statistical differences (p ≤ 0.05) within compared groups. For three-factor groups (vegetation type), different letters indicate statistical differences (p ≤ 0.05) between each compared couple, while the lack of letters indicates no statistical differences. For comparing two factors (period), letters were not used due to the limited number of comparisons. * Indicates statistical significance of the presented data.
Diversity 16 00445 g009
Figure 10. Comparative boxplots of beta diversity between vegetations types and periods expressed by the Whittaker index: (a) Vegetation types; (b) periods; (c) influence of spatiotemporal factors. Asterisk indicates statistical differences (p ≤ 0.05) within compared groups. For three-factor groups (vegetation type), different letters indicate statistical differences (p ≤ 0.05) between each compared couple. For comparing two factors (period), letters were not used due to the limited number of comparisons. * Indicates statistical significance of the presented data.
Diversity 16 00445 g010
Figure 11. Results of the redundancy analysis indicating the environmental variables that most influenced the abundance of Collembola species observed in this study. * Indicates statistical significance of the axis (p ≤ 0.05). Supplemental information available in Table A3.
Diversity 16 00445 g011
Table 1. Abundance of Collembola morphospecies sampled in different vegetation types (mangrove, riparian forest, and restinga) and seasons (dry and rainy) in the Parnaíba Delta Environmental Protection Area, Brazil.
Family/Species/MorphospeciesVegetation TypesAbundance/
Season
Total
Abundance
MangroveRiparian ForestRestinga
Seasons DryRainyDryRainyDryRainyDryRainy
Order Entomobryomorpha
Orchesellidae
Dicranocentrus sp.1003971003971110
Entomobryidae
Cyphoderus sp.1200000202
Cyphoderus sp.2000003033
Cyphoderus sp.3 002000202
Entomobrya sp.1001200012012
Lepidocyrtus sp.1499100131023
Lepidocyrtus sp.23571122381048
Lepidocyrtus sp.3007626037629105
Lepidocyrtus sp.42138800102131
Megacyphoderus sp.1000041415
Pseudosinella sp.10170001300147147
Pseudosinella sp.2050000055
Rhynchocyrtus sp.1100000101
Salina sp.100131200131225
Seira sp.111272231194239208447
Seira sp.231262565696113075523973152
Seira sp.3000001011
Trogolaphysa sp.1000700077
Isotomidae
Axelsonia tubifera Strenzke, 1958120000012012
Hemisotoma sp.1008814209014104
Proisotoma sp.1108023003480364867
Order Symphypleona
Sminthurididae
Parasminthurides sp.1036336016340103
Sphaeridia sp.1057330073845
Sminthurides sp.1200000202
Bourletiellidae
Arlesminthurus sp.1020120301717
Prorastriopes sp.1000203055
Stenognathriopes sp.1000003033
Dicyrtomidae
Calvatomina sp.1170000017017
Calvatomina sp.2000800088
Order Poduromorpha
Neanuridae
Arlesia sp.1000302055
Friesea sp.1001010210313
Brachystomellidae
Brachystomella sp.1000190001919
Total Abundance by vegetation type/Season80133511932919351512220831385346
Total richness11101519515202432
Table 2. Species indicators for each vegetation type (mangrove, restinga, and riparian forest) and seasons (dry and rainy). A p-value of <0.05 indicates statistical significance of the data.
Indicator Species Vegetation Type/SeasonIndVal %p-Value
Dicranocentrus sp.1riparian forest90.000.001
Lepidocyrtus sp.3riparian forest87.420.001
Proisotoma sp.1riparian forest67.170.008
Sphaeridia sp.1riparian forest53.330.004
Salina sp.1riparian forest51.470.004
Entomobrya sp.1riparian forest40.000.023
Trogolaphysa sp.1riparian forest40.000.035
Hemisotoma sp.1riparian forest39.230.038
Friesea sp.1riparian forest 38.440.050
Lepidocyrtus sp.2mangrove52.500.024
Seira sp.1restinga66.550.024
Pseudosinella sp.1restinga44.210.043
Dicranocentrus sp.1dry90.000.001
Lepidocyrtus sp.3dry87.420.001
Disclaimer/Publisher’s Note: The statements, opinions and data contained in all publications are solely those of the individual author(s) and contributor(s) and not of MDPI and/or the editor(s). MDPI and/or the editor(s) disclaim responsibility for any injury to people or property resulting from any ideas, methods, instructions or products referred to in the content.

