Location via proxy:   [ UP ]  
[Report a bug]   [Manage cookies]                
Article

Research on Bi-Level Objective Programming Model of Water Resources Uncertainty Based on Water Rights Trading—A Case Study of the Yehe Irrigation District in Hebei Province, China

1
School of Water Conservancy and Hydroelectric Power, Hebei University of Engineering, Handan 056038, China
2
Hebei Key Laboratory of Intelligent Water Conservancy, Hebei University of Engineering, Handan 056038, China
3
Hebei Hydraulic Research Institute, Shijiazhuang 050051, China
*
Author to whom correspondence should be addressed.
Water 2024, 16(12), 1751; https://doi.org/10.3390/w16121751
Submission received: 19 May 2024 / Revised: 17 June 2024 / Accepted: 18 June 2024 / Published: 20 June 2024

Abstract

:
Water resource allocation systems typically involve multi-level decision-making, with each level having distinct goals and interests, while being influenced by various factors such as social, economic, environmental, and policy planning. The decision-making in water resource allocation systems is characterized by complex uncertainty factors and dynamic changes. In light of this, this study integrates stochastic chance-constrained programming, dynamic programming, bi-level programming, goal programming, and water rights trading to construct a bi-level objective programming model of water resource uncertainty based on water rights trading. The model not only effectively represents the random uncertainty, dynamic characteristics, interests of decision-making levels, and planning requirements of policies in water resource allocation systems but also utilizes market mechanisms to enable compensated transfer of water rights, fully leveraging the role of water rights marketization in water resource allocation. Taking the Yehe River Irrigation District in Hebei Province of China as an illustrative case study, the specific allocation scheme of each stage under the guaranteed rate of 50% in 2025 and the water rights trading results of each sub-region are obtained. Compared with the bi-level objective programming model of water resources uncertainty without water rights trading, the results show that the water consumption per CNY ten thousand GDP(WG)of the irrigation district decreased by 3.42%, and the economic benefits of Luquan District, Jingxing County, Pingshan County, and Yuanshi County in each sub-region increased by 19.17%, 7.19%, 15.11%, and 4.94%, respectively. This improves regional water use efficiency and economic benefits and provides a scientific basis for regional water resource allocation.

1. Introduction

Water resources serve as fundamental support for the development of human society and the economy. Due to climate change, increasing water demand, and the limited availability of water supply, some regions are facing a crisis of water scarcity. Therefore, scientifically rational allocation strategies and efficient utilization are crucial for ensuring the sustainable development of regional economies and societies [1,2,3]. According to a comparative analysis by the Development Research Center of China’s Ministry of Water Resources, in 2020, China’s macro water use efficiency (WG) was slightly higher than the average level of 60 countries but lagged behind their average improvement rate and still had a significant gap compared with high-income countries [4]. In the current tense water resource context, how to achieve optimal allocation of limited water resources and ensure fair and equitable access to water while improving water use efficiency has become an urgent issue that needs to be addressed. When formulating reasonable strategies for water resource allocation, decision-makers face multiple challenges: (a) how to accurately describe hierarchical relationships and deal with multiple concerns involved in the decision-making process; (b) how to address uncertainties caused by subjective or objective factors affecting system parameters; (c) how to balance market mechanisms under total control objectives and fully leverage market guidance role in water resource allocation; and (d) how regional policy goals play a key role in optimizing water resource allocation. Therefore, there is a need to establish a comprehensive planning model that addresses uncertainties, hierarchies, and policy regulation impacts involved in water resource distribution.
Aiming at the problem of water resources management in the region with complex multiple water sources and multiple water-using sectors, scholars have carried out many research studies [5,6,7,8], such as the construction of the regional multi-objective optimal allocation model with social, economic, and ecological objectives [9,10]. However, the aforementioned studies focus on individual decision-making processes, whereas the allocation of water resources involves multi-level decision-making. In recent years, scholars have applied bi-level programming to address the multi-level and multi-agent characteristics of regional water resource allocation systems [11,12]. The bi-level programming model is capable of addressing hierarchical decision-making problems; however, it encounters challenges in dealing with the uncertainty inherent in water resource systems. Consequently, scholars have incorporated various uncertainty methods such as fuzzy programming [13], interval parameter programming [14], and stochastic programming [15] into bi-level programming models to tackle optimization allocation problems within multiple uncertain environments [6,16,17,18]. For instance, Yue et al. [19] constructed a type-2 fuzzy mixed integer bi-level programming model to comprehensively analyze water resource allocation schemes related to future climate change in an uncertain water resources planning model. Additionally, Xiao et al. [20] developed an integrated modeling framework that combines bi-level multi-objective programming, bilateral stochastic chance-constrained programming, and interval parameter technology to establish a double-stochastic double-layer interval multi-objective programming model. This framework aids two-tier decision-makers in formulating scientifically reasonable water resource allocation plans under multiple uncertainties. Although these aforementioned models effectively address the multilevel issues and uncertainties present in regional water resource allocation systems while ensuring some level of effectiveness in allocations, they are not entirely efficient. The water rights in the water market possess tradability, thus enabling efficient regulation of water resource allocation. Water rights trading guides decision-making processes regarding whether to use or sell water for users while promoting efficiency improvements among them by establishing an incentive mechanism for efficient utilization of water [21]. However, research on integrating a water rights trading mechanism with its application in allocating scarce freshwater resources remains insufficient at present.
Water rights trading is one of the important means of water resource management, and many studies have confirmed that implementing a tradable water rights system can improve the efficiency of water resource allocation [22,23,24,25]. With the gradual improvement of the theoretical system of water rights and the vigorous development of the water market, scholars have studied the water rights trading model in order to further improve the utilization rate of regional water resources and optimize its redistribution [26,27,28]. However, most of the studies are mostly on the same level to optimize the objectives for decision-making, without considering the relationship between different levels in an integrated manner, such as the influence of interactive decision-making between regional management and water-use units, and there are few studies on the water rights trading model under the multi-layer perspective.
Therefore, this study takes the Yehe Irrigation District of Hebei Province as an illustrative case study, comprehensively considers the uncertainty of incoming water, the stage change characteristics of water supply and demand, the interest demands of different decision-makers, and the planning orientation of policies and integrates stochastic chance constrained programming, dynamic programming, bi-level programming, goal programming, and water rights trading to establish a bi-level goal programming model of water resources uncertainty based on water rights trading. This study has made significant innovations in the following aspects: (1) Considering the important role of market mechanism in water resource allocation, this study incorporates water rights trading into the water resources planning process, studies the water rights trading mode from a multi-level perspective, realizes the organic combination of market mechanism and government macro-control, and solves the problem of traditional water resource allocation ignoring the use of market rules to regulate water resources under government macro-control. It makes the allocation of water resources more rational and efficient. (2) Considering the key role of regional policy target regulation in the optimal allocation of water resources, this study couples policy-oriented goal programming and introduces deviation variables in the model construction to represent the gap between the actual allocation and the policy target, so as to make the allocation of water resources more in line with the actual demand. It effectively makes up for the limitation of the traditional research on the insufficient consideration of policy factors, thus improving the accuracy and reliability of regional water resource allocation.

2. Methodology

2.1. Bi-Level Programming

Bi-level programming (BP) represents a mathematical optimization model with a hierarchical two-level structure that can address the multi-level problems within water management systems [29,30,31]. It emphasizes the relationship between different levels, comprising an upper level and a lower level, often possessing distinct optimization objectives. The decision-making process at the lower level is founded upon the decisions made at the upper level, and it is subject to the influence and constraints imposed by the upper level. Its form is as follows:
U min x F ( x , y ) L min y f ( x , y ) s . t . g ( x , y ) 0
where ( U ) represents upper-level planning. F ( x , y ) is the upper-level objective function, x is the upper-level decision variable, ( L ) represents lower-level planning, f ( x , y ) is the lower-level objective function, y is the lower-level decision variable, and g ( x , y ) is the constraint condition.

2.2. Dynamic Programming

Dynamic programming (DP) constitutes a methodology for tackling multi-stage decision-making challenges, emphasizing the sequential nature of decision-making across various stages [32,33,34], By dividing the stages, determining the states and transfer equations, complex problems are decomposed into multiple sub-problems and solved step-by-step to ensure optimal decision-making at each stage, thus obtaining the global optimal solution. The most crucial part of this approach is the state transition equation, which reflects the transition pattern from stage j 1 to stage j . The formula is shown below.
Q j = T Q j 1 , x j 1 , j 1 j = 1 , 2 , m
where Q j is the state variable for stage j , and there are a total of m stages; x j is the decision variable for stage j ; T Q j 1 , x j 1 , j 1 is the transition function.

2.3. Chance-Constrained Goal Programming

Chance-constrained goal programming (CCGP) is a robust approach for addressing multi-objective decision-making problems in uncertain environments. It effectively manages uncertainty and violation risks by achieving a moderate compromise between optimizing the objective function and satisfying the constraint conditions at a given confidence level [35]. Moreover, CCGP facilitates the prioritization and satisfaction balance among different objectives, leading to a comprehensive decision solution. The process commences with establishing priorities for each objective using goal programming theory. Subsequently, expected values are assigned to each objective based on predetermined priority order and desired outcomes. The primary aim is to minimize the discrepancy between obtained actual target values and predetermined expected values as much as possible. To address a multi-objective planning problem with chance constraints, it can be simplified to a single-objective formulation using vector distance and then solved via chance-constrained programming theory. The model of chance-constrained goal programming is as follows [36]:
min Z = l = 1 L P l h = 1 H ( d h + d h + ) s . t . F i + d h d h + = F i i = 1 , 2 , h   Pr w j ( x 1 , x 2 , x n ) Q j   β j = 1 , 2 , m   d h , d h + 0 h = 1 , 2 , l  
where d h + and d h respectively represent the positive and negative deviation variables from the target expected value of F i ; P l is the l th priority; and β is the confidence level.

2.4. Stochastic Chance Constrained Bi-Level Objective Programming

The stochastic chance-constrained bi-level goal programming model integrates stochastic chance-constrained programming, dynamic programming, bi-level programming, and goal programming into a comprehensive system framework. The framework characterizes the parameter uncertainty in the system with probability distribution. Incorporating dynamic programming, starting from the overall consideration, the optimal strategy of each stage is obtained; it can simultaneously analyze the goals of two different levels in the decision-making process, coupling goal programming and minimizing the gap between the expected target value. Therefore, the coupled integrated framework is closer to the actual situation, and its specific model is as follows:
  ( U ) min Z = l = 1 L P l h = 1 H ( d h + d h + )   ( L ) min f = f ( x , y )   s . t F i + d h d h + = F i i = 1 , 2 , h Pr ω j ( x 1 , x 2 , x n ) Q j β j = 1 , 2 , m Q j = T Q j 1 , x j 1 , j 1 j = 1 , 2 , m Q 0 = 0   d h , d h + 0 h = 1 , 2 l g ( x , y ) 0  
where Z ( x , y ) represents the upper-level objective function; f ( x , y ) represents the lower-level objective function; Q j is a random variable; and Q 0 is the initial state.

2.5. Solution Methods

Particle Swarm Optimization (PSO) mimics social behavior to find optimal solutions. Particles move in a search space, updating their positions based on their own best and the group’s best until a satisfactory solution is reached. Particle swarm algorithms are simple in structure, have fewer control parameters, and have been widely used in function optimization as well as in different areas of water resources [37,38,39].
The model is solved by bi-level programming particle swarm iterative algorithm [40]. The specific solving steps are as follows:
Step 1. Initialize the population that satisfies the constraints and randomly generate the initial solution of the lower-level programming that satisfies the constraints.
Step 2. Solve the upper-level programming, input the initial solution of the lower-level programming into the upper-level programming, solve the upper-level problem by particle swarm optimization to obtain the optimal solution, and record the corresponding optimal value.
Step 3. Solve the lower-level programming, input the optimal solution of the upper-level model into the lower-level programming, solve the lower-level problem by particle swarm optimization to obtain the optimal solution, and record the corresponding optimal value.
Step 4. Feedback the optimal solution obtained by the lower-level programming model to the upper-level programming model as the input of the upper-level programming optimization solution in the next iteration, and continue to optimize the solution.
Step 5. After each iteration, judge whether the convergence condition is satisfied; if not, re-update the particle position and velocity and turn to Step 2. When the algorithm fulfills the termination criteria, which is either when the error has reached an acceptably low level or the set maximum number of iterations has been achieved, the iterative process will cease, and the currently identified optimal solution of the model will be outputted.

3. Case Study

3.1. Study Area

The Yehe Irrigation District is located in the south–central part of Hebei Province, China. It is situated in the western mountainous area of Shijiazhuang City, connected by hills and plains. The terrain slopes from west to east, ranging between 113°55′′ E and 114°30′′ E longitude and 37°53′′ N and 38°18′′ N latitude. The benefiting range covers four counties (districts), including Luquan, Jingxing, Pingshan, and Yuanshi, making it one of the larger-scale irrigation areas in Hebei Province. The climatic characteristics of the irrigation district belong to the temperate continental monsoon climate, with a multi-year average temperature of 12–14 °C, a multi-year average precipitation of 565.2 mm, and spatial and temporal unevenness of precipitation. The location address of the Yehe Irrigation District is shown in Figure 1.
Surface water is the main source of water supply in the Yehe Irrigation District, accounting for 71.81%. The principal aquifers of groundwater consist of porous water in unconsolidated rocks and karst fissure water in carbonates, with the primary recharge originating from atmospheric precipitation. The available water supply of groundwater is the recoverable amount provided by shallow groundwater [41,42,43]. The region is facing a serious problem of groundwater overexploitation. The annual groundwater supply is gradually decreasing, with a decrease of 61% between 2011 and 2020, and the amount of available water resources in the region is extremely limited. The demand for residential and industrial water continues to grow, with agricultural water accounting for a high proportion and its demand varying with seasons, resulting in significant uncertainty in the incoming water in the irrigation district. As a result, the supply–demand volume also exhibits dynamic changes, making it more complex to manage water resources decisions. The WG of the irrigation district in the current year is 64.13 m3, which is much higher than the average level of the city. There is a big gap between this and the goals set in the 14th Five-Year Plan for water security in Shijiazhuang [44]. According to the policy objectives, by 2025, the city’s WG will decrease by 15.7% compared with 2020. At the same time, there is an obvious hierarchical structure in the limited water resource allocation in the irrigation district. The upper decision-makers are mainly the water resources management department of the Yehe Irrigation District, paying more attention to the overall results, considering how to allocate water resources fairly, and improving the efficiency of regional water resources utilization. The lower level (each sub-region) decision-makers refer to the water use units of Jingxing County, Pingshan County, Luquan District, and Yuanshi County, respectively. The goal is to maximize the regional economic benefits. This hierarchical structure leads to conflicts of interest and coordination dilemmas in the decision-making process. Therefore, effective measures must be taken to improve the utilization efficiency of water resources in the irrigation district to meet the policy requirements and sustainable development needs.

3.2. Model Application

In response to the aforementioned issues in irrigation districts, this study establishes a bi-level objective programming model based on water rights trading for water resource uncertainty. This model considers two levels of decision-making entities: in the upper-level decision process, the water resources management department allocates initial water rights to different regions to achieve fairness in initial water rights allocation and maximize overall regional water resource utilization efficiency; in the lower-level decision process, each water user unit trades their initial water rights based on the allocation from the upper-level decision and their own degree of scarcity or abundance of water resources, further making decisions on withdrawal quantities for various sectors (i.e., industrial, domestic, and agricultural) to maximize their own economic benefits. The framework of the process for allocating water resources is shown in Figure 2.
Upper-level decision process: the fairness of initial water rights allocation in different sub-regions is assessed using the Gini coefficient, while water resource utilization efficiency is evaluated through the WG indicator. The upper-level decision variables comprise the initially allocated water rights to various sources and sub-regions, with expected target values determined as part of the upper-level objective function. Deviation variables are introduced to minimize disparities between these variables and their respective expected targets. Therefore, the overall objective aims at minimizing total deviation. The objective function is as follows:
minF = h 2 ( d h   + d h   + )
Embodiment of fairness.
(Gini coefficient of initial water rights satisfaction in different sub-regions).
1 2 n k = 1 4 t = 1 4 i = 1 2 ( λ i k t + u k t ε i ) t = 1 4 j = 1 3 N j k t k 1 = 1 4 k 2 = 1 4 t = 1 4 i = 1 2 ( λ i k 1 t + u k 1 t ε i ) t = 1 4 j = 1 3 N j k 1 t t = 1 4 i = 1 2 ( λ i k 2 t + u k 2 t ε i ) t = 1 4 j = 1 3 N j k 2 t + d 1   d 1   + = A
Embodiment of water use efficiency.
(WG).
t = 1 4 i = 1 2 k = 1 4 j = 1 3 q i j k t γ i j k + t = 1 4 E t G D P + d 2   d 2   + = B
Lower-level decision process: When deciding to participate in transactions, decision-makers in each sub-region must consider the interests of their own sub-region. If the actual water withdrawal in a sub-region exceeds its water rights, managers need to purchase water from the water market. Conversely, if the actual water withdrawal in a sub-region does not exceed its allocated water rights and the profits generated from trading water outweigh those from self-use, managers can sell additional water on the water market. In this process, buyers increase their output levels with the acquired water, thereby achieving economic gains; sellers obtain more economic benefits by selling their water rights. The lower-level objective is to maximize net benefits for each sub-region, which consists of net benefits generated from actual water withdrawals and additional income generated from selling (or purchasing) water rights. However, when water resources are endowed with a right, the right to groundwater and the right to surface water held by the water sector are not interchangeable. Water users cannot access groundwater resources based solely on surface-water extraction permits; similarly, having groundwater extraction permits does not grant access to surface-water resources either. Therefore, the net benefit for each sub-region is determined by both net benefits derived from actual surface-water withdrawals and additional income generated from selling (or purchasing) water rights as well as those derived from actual groundwater withdrawals and additional income generated from selling (or purchasing) water rights. This study’s model considers different variables at lower-level decisions, including actual withdrawal quantities for different sources of water across various zones and users. The objective function is as follows:
max f k = t = 1 4 i = 1 2 j = 1 3 b i j k t c i j k t q i j k t γ i j k + ( λ i k t + u k t ε i j = 1 3 q i j k t γ i j k ) p i t
Model constraints.
Constraints of surface water supply capacity in each stage:
Pr k = 1 4 ( λ i k t + u k t ε i ) + E t Q i t β    i = 1
Constraints of groundwater supply capacity in each stage:
k = 1 4 λ i k t Q i t    i = 2
Water balance constraints:
Q i t = Q i t 1 + S F i t + k = 1 4 μ k t ε i k = 1 4 λ i k t 1 E t 1 ε i     i = 1 , 2
The initial water rights constraints for the allocation of different sub-regions in each stage:
G i k min t λ i k t + u k t ε i G i k max t
The actual allocation of water in different sub-sectors in each stage does not exceed the total allocation of water rights constraints:
j = 1 3 k = 1 4 q i j k t γ i j k k = 1 4 ( λ i k t + u k t ε i )
Water demand constraints of different water sectors in each stage:
D i j k min t q i j k t γ i j k D i j k max t
Variable non-negative constraints:
q i j k t 0
d h   0 , d h   + 0
where i is the water source ( i = 1, surface water; i = 2, groundwater); j is the water-using sector ( j = 1, domestic; j = 2, agriculture; j = 3, industry); k is the sub-region ( k = 1, Luquan District; k = 2, Jingxing County; k = 3, Pingshan County; and k = 4, Yuanshi County); t is the stage (Stage 1: January–March, Stage 2: April–June, Stage 3: July–September); N j k t is the water demand of water sector j in sub-region k in stage t (104 m3); λ i k t + μ k t ε i is the initial water right allocated to water source i sub-region k in stage t (104 m3), and λ i k t is the upper-decision variable; u k t is the amount of water diverted by the diversion project in the surface water of sub-region k in stage t (104 m3); q i j k t is the amount of water actually withdrawn from water source i sub-region k in stage t (104 m3), and is the lower decision variable; γ i j k is the water distribution relationship from water source i to water use sector j in sub-region k (1 means water distribution, 0 means no water distribution); E t is the minimum ecological water demand of the region in stage t (104 m3); A is the expected target value of fairness according to the policy; B is the expected target value of water use efficiency according to the policy (m3); d 1   and d 1   + represent the negative deviation variable and the positive deviation variable of the fairness goal deviating from the expected target value, respectively. d 2   and d 2   + represent the negative deviation variable and the positive deviation variable of the water use efficiency target deviating from the expected target value, respectively; Q i t denotes the maximum amount of water that can be supplied by water source i in stage t (104 m3), and is a random variable; G i k min t and G i k max t are the upper and lower limits of the initial water right quota of water source i subzone k in stage t (104 m3); p i t is the transaction price of water right; b i j k t is the benefit coefficient of water sector j in sub-region k (CNY/m3); c i j k t is the cost price of water sector j in sub-region k (CNY/m3); D i j k min t , D i j k max t are the upper and lower bounds of the actual water demand of water sector j in sub-region k of water source i in stage t (104 m3).

3.3. Model Parameters

For this study, 2020 has been selected as the benchmark reference year. Drawing upon the data compiled in the Shijiazhuang Statistical Yearbook [45], a standardized quota methodology has been implemented to forecast the anticipated water demand of various water utilization sectors across the subdivisions of the irrigation district, specifically targeting the planned year of 2025. Drawing upon the actual water usage data from historical reference years, a comprehensive analysis is conducted to assess the water demand requirements for different stages of the planned irrigation district. Among them, the stage water demand of the domestic water sector accounts for 24.50%, 29.80%, 25.60%, and 20.10%, respectively. The stage water demand of the agricultural water sector accounts for 10.00%, 40.00%, 30.00%, and 20.00%, respectively. The proportion of stage water demand in the industrial water sector is 23.60%, 26.40%, 25.20%, 24.80%, and the proportion of stage water demand in the ecological water sector is 21.20%, 52.30%, 19.80%, 6.60%. The specific forecast results of water demand are presented in Table 1.
The water sources for the Yehe Irrigation District comprise surface water and groundwater. The planned underground water supply volume for the year 2025 is based on the exploitable amount, taking into account relevant achievements from the Shijiazhuang City Water Resources Comprehensive Planning (2018–2035) [46] and actual development conditions in that planned year, which is determined to be 19,585.00 × 104 m3.
The available water volume of surface water has obvious frequency characteristics, represented by random variables. Based on the historical data of 2001–2020 for 20 years [47], an empirical frequency analysis method is used to classify the years into abundant, normal, and drought years. The historical data are insufficient to fully and adequately model the probability distributions under varying hydrological conditions. By using the random simulation Box–Muller method [48,49], the probability distribution of surface water inflow in the planned year 2025 at a guaranteed rate p = 50% is obtained, which follows a normal distribution, as presented in Figure 3. Taking into comprehensive consideration the existing water supply risks in the irrigation district, it is ensured that the decisions made adhere to the constraints within a specified confidence level. At present, the water supply of the counties in the irrigation district has not reached the design scale of water supply, and it is predicted that by 2025, the guaranteed rate p = 50%, and the external water transfer will reach 85% of the design scale of water supply [46]. The predicted availability of externally transferred water is presented in Table 2. Based on this calculation, the regional surface water supply capacity in 2025 is 37,988.00 × 104 m3. According to the sum of monthly runoff from Gangnan Reservoir and Huangbizhuang Reservoir, the water inflow at different stages in 2025 is determined to be 24.19%, 26.78%, 28.41%, and 20.63%, and the water inflow at different stages is obtained.
According to the analysis of water usage from 2013 to 2020 based on the Shijiazhuang Water Resources Bulletin [47], the relationship between water sources and water-consuming sectors is determined. The efficiency coefficient of domestic water consumption sectors varies significantly across different regions, making it difficult to determine accurate values. This study determines them based on relevant planning and similar types of water sources. The efficiency coefficients for industrial and agricultural water consumption are calculated using a method that allocates them according to the total output value. The cost coefficients are determined through field investigations in relevant districts and counties, with the assumption that the annual planned and current year’s water prices remain unchanged. For detailed values of efficiency coefficients and net water prices for different sectors within irrigation districts, please refer to Table 3.
The upper and lower limits for the initial water rights quota allocated by the upper-level irrigation district management department are determined by adding or subtracting two times the standard deviation from the mean water consumption in the historical reference year, respectively. The actual water withdrawal quotas for each water user unit in the lower-level irrigation district (Luquan District, Jingxing County, Pingshan County, and Yuanshi County) are obtained by adding or subtracting twice the standard deviation from the average water consumption in the historical reference year. The upper-level target value of the model is determined based on regional policy objectives. For the planned year 2025, the calculated water resource utilization efficiency indicator (WG) stands at 54.06 m3. The expected fairness indicator target value A (Gini coefficient) is estimated using historical data and adjusted according to regional development conditions to be 0.07. The market equilibrium price for water rights trading is determined as the average price offered by both sellers and buyers, with a final price of 2.4 CNY/m3. The confidence level is 95%. When accounting for the total output value GDP of the irrigation district in the planned year, taking into account the actual situation of each sub-district of the irrigation district and the future economic development [47], the annual growth rate method is adopted to predict the GDP of the irrigation district in the year of the planning level, and this prediction is used as a known parameter of the GDP in the objective function of the upper level of the model, and the specific prediction value is detailed in Table 4.

4. Results and Discussion

4.1. Result Analysis

In the planned year of 2025, under a guaranteed rate of 50%, the total deviation of fairness index (Gini coefficient) and water use efficiency (WG) in different sub-regions from the expected target values, as well as the net benefits of each sub-region, are shown in Table 5. As shown in Figure 4, in the planned year with a guaranteed rate of p = 50%, the WG in Yehe Irrigation District will reach 55.94 m3, which is a decrease of 12.77% compared to the current situation year and deviates slightly from the expected target value.
At a guaranteed rate of p = 50%, the initial water right allocation results of each water source allocation in each sub-region at different stages are illustrated in Figure 5. The total allocated water rights amount to 47,644.8 × 104 m3, with the first stage accounting for 19.21% of the total allocated water rights, the second stage accounting for 35.59%, the third stage accounting for 25.85%, and the fourth stage accounting for 19.31%.
The total actual water withdrawal of water-using sectors will be 46,002.32 × 104 m3, of which the actual proportion of water withdrawal of domestic, agricultural, and industrial water-using sectors is 13.76%, 56.41%, and 29.83%, respectively. Taking the 2020 water consumption as the benchmark, the proportion of water distribution for each water-consuming sector in Luquan District changed from 19.70%, 71.40%, and 9.20% to 20.66%, 56.70%, and 22.64%; the proportion of water distribution for each water-consuming sector in Jingxing County changes from 7.40%, 74.6%, and 18.00% to 9.87%, 55.40%, and 34.73%. In Yuanshi County, the proportion of water distribution for each water-consuming sector changes from 15.90%, 78.40%, and 5.70% to 18.67%, 65.80%, and 15.53%. The percentage of water withdrawal in all domestic water-consuming sectors increased, the percentage of water withdrawal in all agricultural water-consuming sectors decreased significantly, and the percentage of water withdrawal in all industrial water-consuming sectors increased significantly. Similarly, the proportion of water distribution in each water-consuming sector in Pingshan County changed from 12.90%, 64.10%, and 23.00% to 9.21%, 52.64%, and 38.15%, with a significant decrease in the amount of water withdrawn by the agricultural water-consuming sector and a significant increase in the proportion of water withdrawn by the industrial water-consuming sector. Detailed actual water withdrawals of different water-consuming sectors in each sub-region are illustrated in Table 6.
In the first stage, the actual amount of water withdrawn will be 9006.52 × 104 m3, accounting for 19.58% of the total actual amount of water withdrawn, and the proportions of the actual water withdrawn from the domestic, agricultural, and industrial water use sectors are 12.57%, 57.11%, and 30.31%, respectively. In the second stage, the actual amount of water withdrawn will be 16,459.70 × 104 m3, accounting for 35.78% of the total actual water withdrawal, which is the largest proportion; the actual proportion of water withdrawn from the domestic, agricultural, and industrial water use sectors are 14.31%, 55.23%, and 30.46%, respectively. In the third stage, the actual amount of water withdrawn will be 11,648.37 × 104 m3, accounting for 25.32% of the total actual amount of water withdrawn, and the proportions of the actual water withdrawn from the domestic, agricultural, and industrial water use sectors are 14.35%, 56.04%, and 29.61%, respectively. In the fourth stage, the actual amount of water withdrawn will be 8887.74 × 104 m3, accounting for 19.32% of the total actual amount of water withdrawn; the proportions of water actually withdrawn from the domestic, agricultural, and industrial water-use sectors are 13.17%, 58.38%, and 28.45%, respectively. The actual amounts of water withdrawn from the water-use sectors at different stages are shown in detail in Figure 6, Figure 7, Figure 8 and Figure 9 below.
In Table 7, the traded water rights in the water market are positive, which indicates that the sub-region sells water rights; otherwise, the sub-region purchases water rights. In the first stage of the planned year, Luquan District sells 12.39% of the surface water rights and 39.60% of the groundwater rights in the water market to maximize the economic benefits of the sub-region. In Jingxing County, 17.78% of the surface water rights are sold in the water market to maximize the economic benefits; Pingshan County and Yuanshi County need to buy surface-water rights and groundwater rights in the water market. In the second stage of the planned year, Luquan District sells 21.06% of the groundwater water rights in the water market; Jingxing County sells 32.28% of the surface water in the water market; Pingshan County needs to purchase surface water rights and groundwater rights, and the sub-region has a higher willingness to use water; Yuanshi County is more inclined to sell the excess water rights in the stage to meet its own guarantee needs and improve economic benefits. In the third stage of the planned year, Luquan District and Yuanshi County sell 9.32% and 41.63% of surface-water rights and 26.38% and 30.60% of groundwater rights in the water market, respectively. Jingxing County needs to purchase surface water and groundwater rights; Pingshan County needs to put 5.51% of surface water rights into the water market. In the fourth stage of the planned year, Luquan District will put 20.15% of the surface water rights and 33.71% of the groundwater rights into the water market; Pingshan County needs to purchase surface water rights and groundwater water rights; Jingxing County needs to put 4.32% of surface water rights into the water market; and Yuanshi County needs to put 2.58% of groundwater into the water market.
Water rights trading serves as an efficient allocation mechanism for reallocating water resources in combination with the water market. After the allocation of the overall view, the Yehe Irrigation District planning level year has a guaranteed rate of p = 50%, and water use efficiency indicator (WG) deviation from the policy sets the expected target value at 54.06 m3 or smaller. The proportions of domestic, agricultural, and industrial water withdrawals at different stages are 13% to 14%, 55 to 58%, and 28% to 30%, respectively. The increase in the amount of water withdrawn by the domestic and industrial sectors and the significant decrease in the actual amount of water withdrawn by the agricultural sector indicate that the use of market mechanisms to incentivize inefficient water users to consider the cost of water use, prompting them to conserve water and transfer their water rights to efficient water users, improves the efficiency of the use of water resources in the region and optimizes the efficiency of allocation.

4.2. Model Comparison

In a bid to robustly substantiate the superiority of the model constructed in this research, a comparative assessment is undertaken with the uncertainty bi-level objective programming model without water rights trading. The difference is that the latter model only has the net benefit generated by the actual water withdrawal in the lower planning objective function, and there is no partial benefit of selling (or purchasing) water rights. The fuzzy satisfaction algorithm [50,51] is employed as the solution method, and the model is transformed into a single level to obtain the allocation results. The comparison model is as follows:
The upper level (minimum total deviation):
minF = h 2 ( d h   + d h   + )
The initial water rights satisfaction in different sub-regions (Gini coefficient):
1 2 n k = 1 4 t = 1 4 i = 1 2 j = 1 3 q i j k t γ i j k t = 1 4 j = 1 3 N j k t k 1 = 1 4 k 2 = 1 4 t = 1 4 i = 1 2 j = 1 3 q   i j k 1 t γ i j k 1 t = 1 4 j = 1 3 N j k 1 t t = 1 4 i = 1 2 j = 1 3 q   i j k 2 t γ i j k 2 t = 1 4 j = 1 3 N j k 2 t + d 1   d 1   + = A
Water Use Efficiency (WG):
t = 1 4 i = 1 2 k = 1 4 j = 1 3 q i j k γ i j k + t = 1 4 E t G D P + d 2   d 2   + = B
The lower level (economic benefits of each sub-region):
max f k = t = 1 4 i = 1 2 j = 1 3 b i j k c i j k q   i j k t γ i j k
Model constraints.
Constraints of surface water supply capacity in each stage:
Pr k = 1 4 j = 1 3 q i j k t γ i j k + E t S i t β    i = 1
Water balance constraints:
S i t = S i t 1 + S F i t + k = 1 4 μ k t ε i j = 1 3 k = 1 4 q i j k t 1 r i j k E t 1 ε i
Constraints of groundwater supply capacity in each stage:
k = 1 4 j = 1 3 q i j k t γ i j k S i t   i = 2
Water demand constraints of water sector in each stage:
D i j k min t q i j k t γ i j k D i j k max t
Non-negative constraints:
q i j k t 0
d h   0 , d h   + 0
where S i t denotes the maximum water availability from water source i in stage t of the planned year (104 m3); d 1   , d 1   + , d 2   , d 2   + , N j k t , n , q i j k t , E t , G D P , B , A , S F i t , β , μ k t , r i j k , D i j k min t , and D i j k max t have the same meaning as the parameters of the model (3.2).
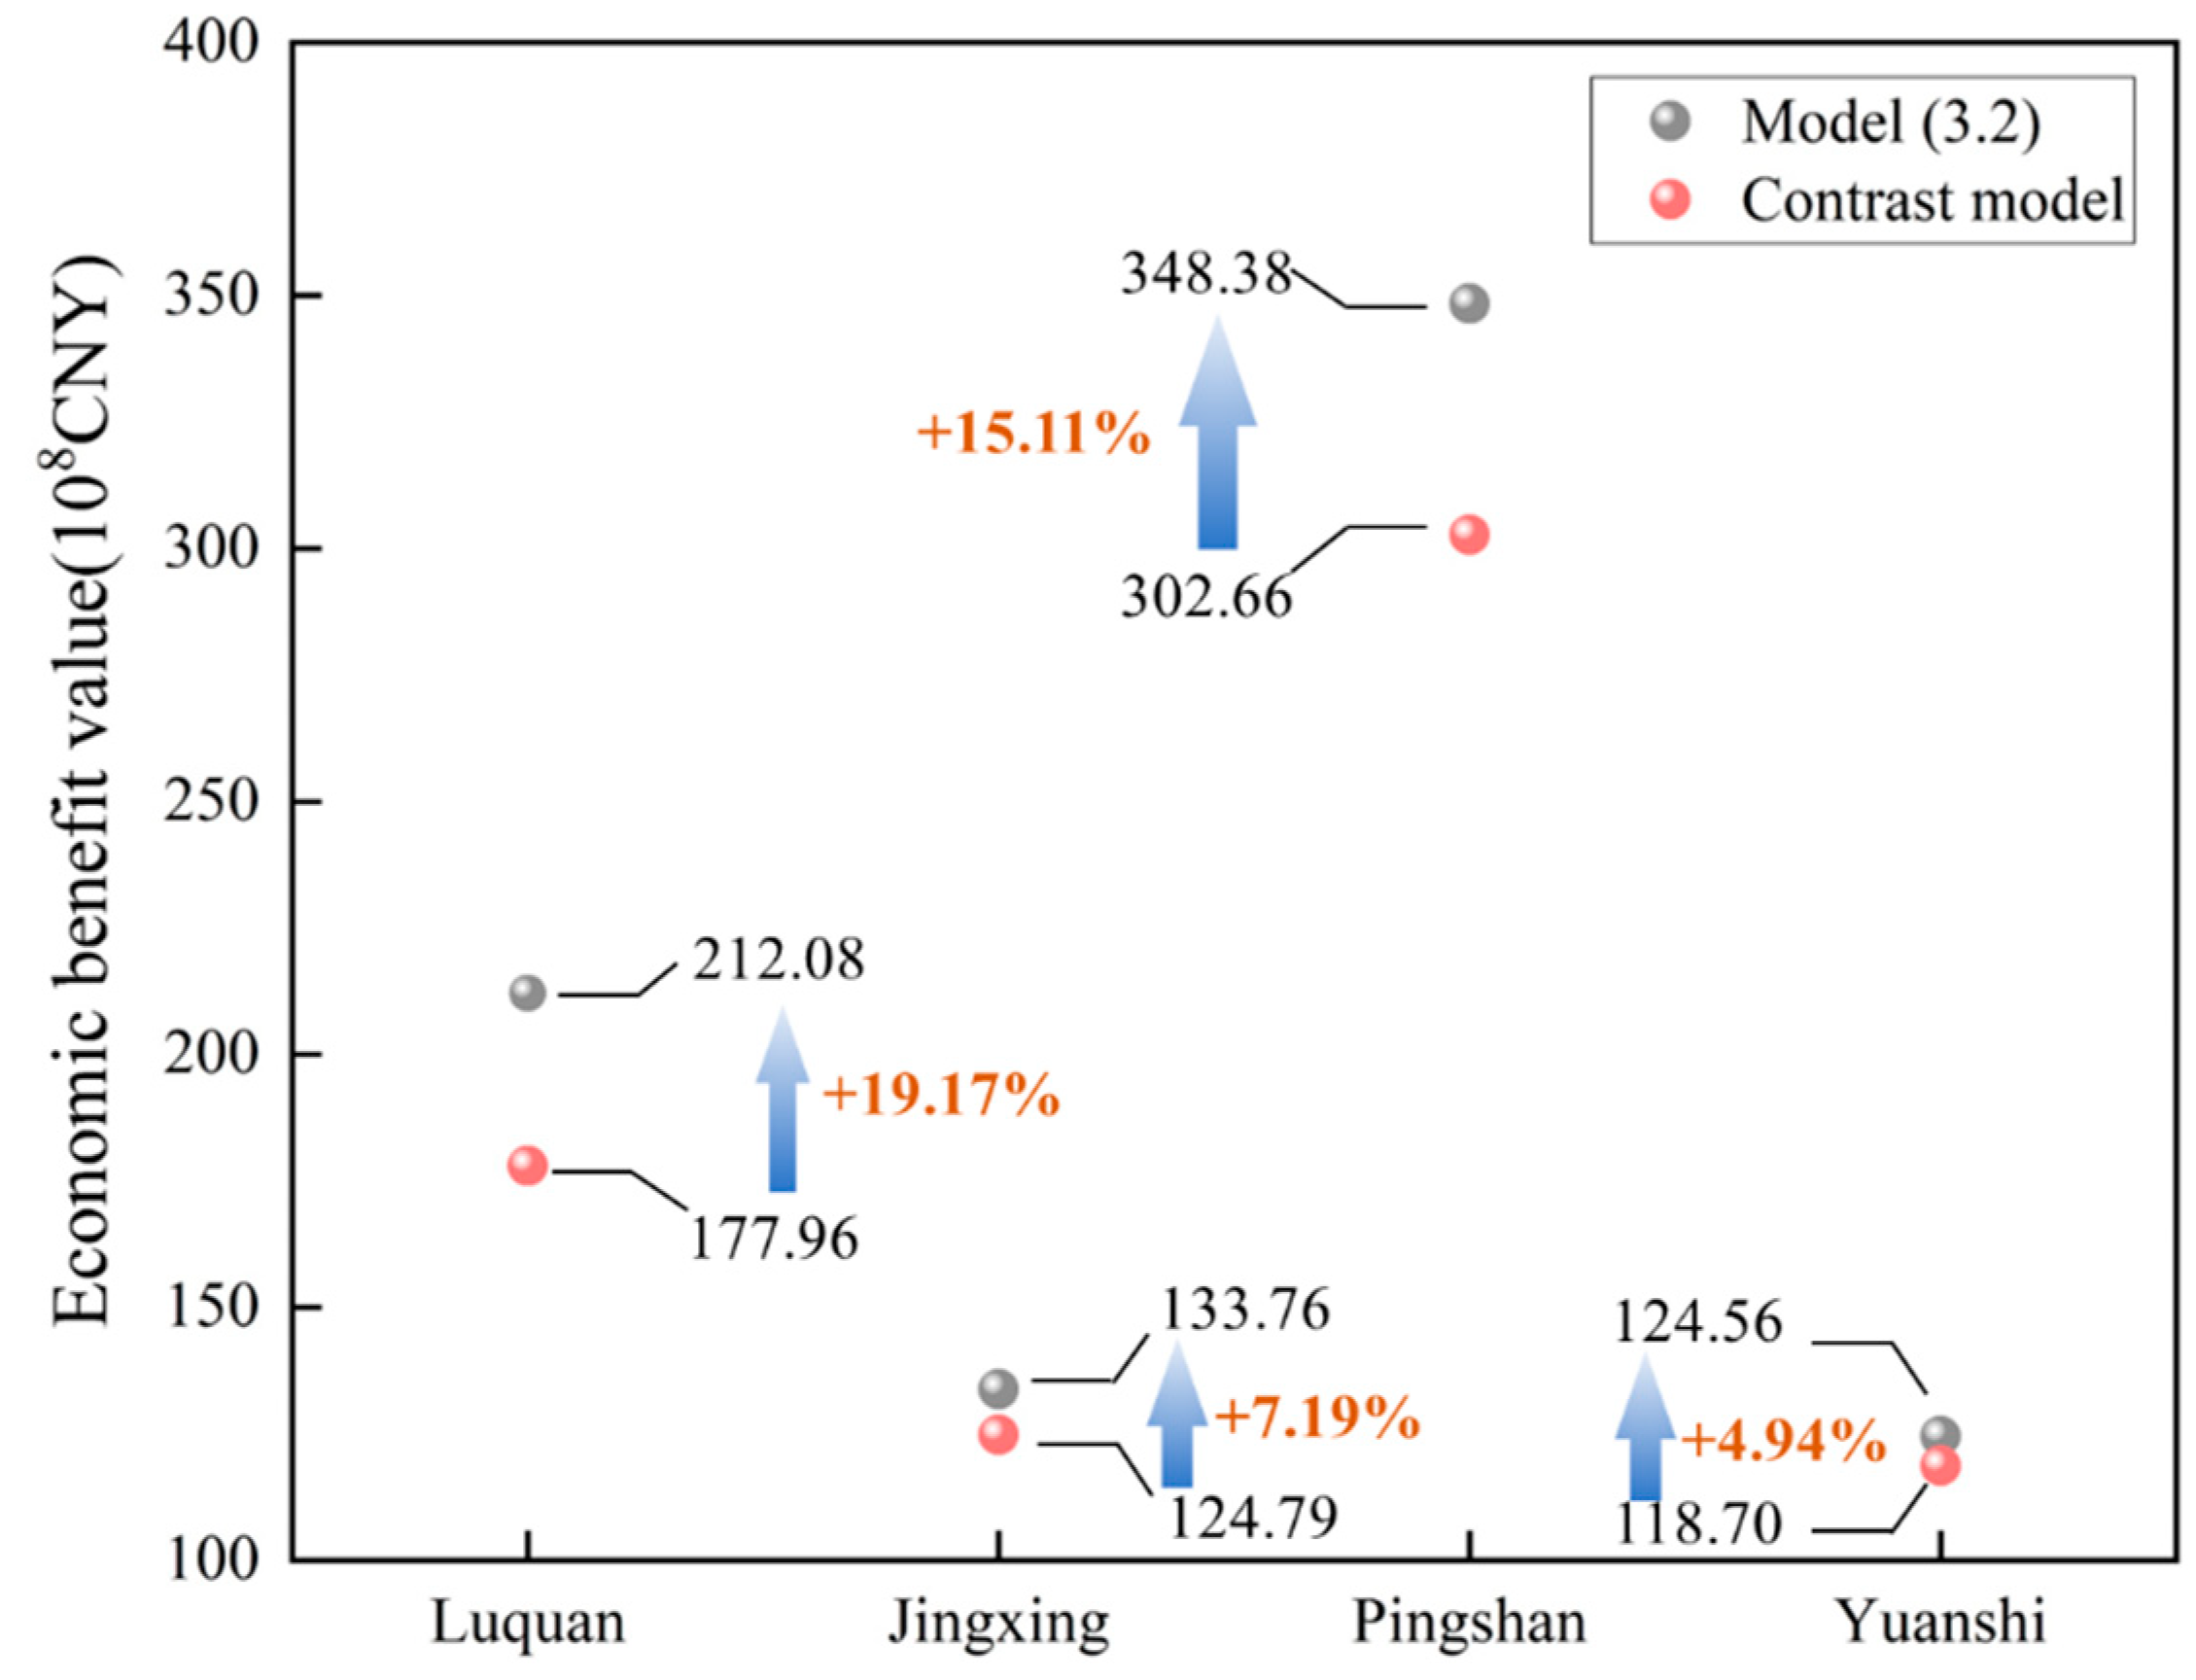
Compared with the target values of the model solution results, when the planned annual guaranteed rate is P = 50%, the total deviation sum of the upper-layer objective function of the water resource allocation results based on water rights trading is 1.96, while the total deviation sum of the upper-layer objective function of the water resource allocation results without water rights trading is 4.18. After considering water rights trading, the WG of the region decreased by 1.98 m3. The economic benefits of each sub-region of the lower objective function have been improved to varying degrees, and the comparison of the economic benefits of each sub-region is depicted in Figure 10. Water rights trading allows water resources to flow from low-value uses to high-value uses, realizes the efficient use of water resources in each sub-region, and then improves the economic benefits of each sub-region.
Comparison of actual water withdrawals by different water use sectors in the irrigation planned year. From the analysis of the proportion of actual water withdrawal by water-use sectors in comparison with Figure 11, the consideration of water rights trading has prompted the agricultural water-use sector to save water and reduce the actual amount of water withdrawn, while the transfer of agricultural water rights to the domestic and industrial water-use sectors with high water-use efficiency has resulted in an increase in the actual amount of water withdrawn by the domestic and industrial water-use sectors.
The following is a comparison of the actual proportion of water withdrawal by each water-consuming sector in different sub-regions of the Yehe Irrigation District in the planned year. An analysis was conducted based on the solution outcomes of the comparative model, as presented in Table 8. The percentage of water withdrawal for each water-consuming sector in Luquan District was 17.58%, 67.12%, and 15.30%; the percentage of water withdrawal for each water-consuming sector in Jingxing County was 10.52%, 69.71%, and 19.77%; the percentage of water withdrawal for each water-consuming sector in Pingshan County was 9.28%, 62.27%, and 28.45%; and the percentage of water withdrawal for each water-consuming sector in Yuanshi County was 17.33%, 70.64%, and 12.02%. Compared with the comparison model, the results of model (3.2) show that the proportion of water withdrawals from the industrial water consumption sector in the four sub-regions will increase by 3.51% to 16.96%, and the proportion of water withdrawals from the agricultural water consumption sector will decrease by 4.84% to 14.31%.
The following is a comparison of the actual proportion of water withdrawal by water-consuming sectors at different stages of the planned year in the irrigation district. The results of the comparison model show that in the first stage of the planned year, the actual proportion of water withdrawal in the domestic, agricultural, and industrial water consumption sectors in the irrigation district is 12.65%, 68.19%, and 19.16%, respectively, compared with the comparison model, and the actual proportion of water withdrawal in the industrial water consumption sector in the model (3.2) increases by 11.15%, while the actual proportion of water withdrawal in the agricultural water-consuming sector decreases by 11.08%. In the second stage, the actual proportion of water withdrawal in the domestic, agricultural, and industrial water-consuming sectors in the irrigation district were 13.51%, 65.16%, and 21.33%, respectively, compared to the comparison model; the actual proportion of water withdrawal in the domestic and industrial water-consuming sectors in model (3.2) increased by 0.80% and 9.13%, respectively; while the actual proportion of water withdrawal in the agricultural water-consuming sector decreased by 9.93%. In the third stage, the actual proportion of water withdrawal in the domestic, agricultural, and industrial water-consuming sectors in the irrigation district is 13.61%, 64.93%, and 21.46%, respectively, compared with the comparison model; the actual proportion of water withdrawal in the domestic water-consuming sector and the industrial water-consuming sector in the model (3.2) increases by 0.74% and 8.15%, respectively; while the actual proportion of water withdrawal in the agricultural water-consuming sector decreases by 8.89%. In the fourth stage, the actual proportion of water withdrawal in the domestic, agricultural, and industrial water-consuming sectors in the irrigation district is 12.27%, 67.63%, and 20.11%, respectively, compared with the comparison model; the actual proportion of water withdrawal in the domestic water-consuming sector and the industrial water-consuming sector in the model (3.2) increases by 0.90% and 8.34%, respectively; while the actual proportion of water withdrawal in the agricultural water-consuming sector decreases by 9.25%.
After the above comparative analysis, compared with the water resources uncertainty bi-level objective programming model without water rights trading, the water resource allocation model combined with water rights trading makes the WG in the irrigation district decrease by 3.42%. The economic benefits of Luquan District, Jingxing County, Pingshan County, and Yuanshi County have all been improved to varying degrees. The actual withdrawal proportions of water consumption in irrigation districts for domestic use, agriculture, and industry have changed from 13.13%, 66.18%, and 20.70% to 13.76%, 56.41%, and 29.83%, respectively. The significant reduction in agricultural water withdrawals indicates that agricultural water rights are being transferred on a paid basis to more efficient domestic and industrial sectors, further validating the effectiveness of water rights trading in improving regional water resource utilization efficiency.

5. Conclusions

This study presents a comprehensive framework by integrating stochastic chance-constrained programming, dynamic programming, bi-level programming, goal programming, and water rights trading to establish a bi-level goal programming model of water resources uncertainty based on water rights trading. This model effectively addresses the uncertainty of incoming water in the water resources system, the dynamic changes in supply and demand of water at different stages, as well as the competition conflicts among decision-makers at different levels regarding water resources. Simultaneously, it fully considers policy planning orientation by introducing deviation variables to represent discrepancies between actual allocation and policy goals, thereby enhancing the accuracy and stability of regional water resource allocation. By incorporating water rights trading into the model, through the market mechanism, water rights holders with low water use efficiency are induced to consider the opportunity cost of water use to save water, and some water rights are transferred to water rights holders with high water use efficiency so as to promote the overall efficiency of social water use.
The model is applied to the case study of the Yehe Irrigation District in Hebei Province. The uncertainty of incoming water in the irrigation district is characterized by stochastic variables, and the changes in different stages of water supply and demand are reacted through dynamic planning. The upper level takes the fairness of water right allocation and water resource utilization efficiency as the goal, establishes the expected target of the objective function according to the policy planning requirements, and introduces the deviation variable to minimize the gap with the expected target value, while the lower level takes the economic benefits of each sub-region of the irrigation district as the goal. The model solution results show that the planned annual water consumption of CNY ten thousand GDP of the irrigation district reaches 55.94 m3, which is 12.77% lower than the current situation and deviates from the expected target value of 1.88 m3. At the same time, the economic benefit is 818.78 × 10⁸ CNY, and the configuration results of different stages of the planned year are obtained.
Compared with the bi-level objective programming model of water resources uncertainty without water rights trading, the model constructed in this study improves the water resources use efficiency of the irrigation district by 3.42% and the economic efficiency by 13.07%, and the allocation effect is better. It is more suitable for solving the problems of uncertainty, dynamically changing characteristics, hierarchy, and the influence of policy regulation in the water resource allocation system, which can provide powerful support to achieve the scientific and rational allocation of water resources.
The research on the price function of water rights trading is currently facing challenges such as theoretical deficiencies, complex market mechanisms, and large price differences. It is necessary to deepen the research to construct a complete theoretical system of water rights trading price, support the healthy development of the water rights market, and optimize the allocation of water resources. In addition, in order to alleviate the decline of groundwater levels in the irrigation district, comprehensive measures such as reducing overexploitation, ecological water replenishment, promoting agricultural efficient water-saving technology, and adjusting planting structure should be implemented to restore and protect groundwater resources.

Author Contributions

Conceptualization, S.L. and M.S.; methodology, S.L. and M.S.; data curation, S.L. and D.L.; writing—original draft preparation, S.L.; writing—review and editing, M.S. and L.F. All authors have read and agreed to the published version of the manuscript.

Funding

This research was funded by the provincial water science and technology plan project of Hebei Province, grant number HBST2024-02.

Data Availability Statement

The data presented in this study are available on request from the corresponding author.

Acknowledgments

The authors are grateful to the editors and the anonymous reviewers for their unique and profound comments and suggestions.

Conflicts of Interest

The authors declare no conflicts of interest.

References

  1. Dadmand, F.; Naji-Azimi, Z.; Farimani, N.M.; Davary, K. Sustainable allocation of water resources in water-scarcity conditions using robust fuzzy stochastic programming. J. Clean. Prod. 2020, 276, 123812. [Google Scholar] [CrossRef]
  2. Wang, G.Y.; Zhang, X.Y.; Du, L.J.; Lei, B.; Xu, Z.H. Study on the Optimal Allocation of Water Resources Based on the Perspective of Water Rights Trading. Sustainability 2023, 15, 6214. [Google Scholar] [CrossRef]
  3. Yang, Z.; Wang, Z.; Yao, Z.; Bao, X. Optimal allocation planning of regional water resources with multiple objectives using improved firefly algorithm. Aqua-Water Infrastruct. Ecosyst. Soc. 2024, 73, 746–770. [Google Scholar] [CrossRef]
  4. Geng, S.; Liu, D.; Xia, P. Research on China’s water use efficiency of China based on a comparative analysis. Water Resour. Dev. Res. 2022, 22, 77–82. [Google Scholar] [CrossRef]
  5. Chen, J.F.; Yu, C.; Cai, M.; Wang, H.M.; Zhou, P. Multi-Objective Optimal Allocation of Urban Water Resources While Considering Conflict Resolution Based on the PSO Algorithm: A Case Study of Kunming, China. Sustainability 2020, 12, 1337. [Google Scholar] [CrossRef]
  6. Guan, H.; Chen, L.; Huang, S.; Yan, C.; Wang, Y. Multi-objective optimal allocation of water resources based on ‘three red lines’ in Qinzhou, China. Water Policy 2020, 22, 541–560. [Google Scholar] [CrossRef]
  7. Wu, X.; Wang, Z. Multi-objective optimal allocation of regional water resources based on slime mould algorithm. J. Supercomput. 2022, 78, 18288–18317. [Google Scholar] [CrossRef]
  8. Li, Y.B.; Sun, K.; Men, R.; Wang, F.; Li, D.X.; Han, Y.H.; Qu, Y.P. Study on the Optimization of Multi-Objective Water Resources Allocation in the Henan Yellow River Water Supply Zone. Water 2023, 15, 4009. [Google Scholar] [CrossRef]
  9. Yan, Z.H.; Sha, J.X.; Liu, B.; Tian, W.; Lu, J.P. An Ameliorative Whale Optimization Algorithm for Multi-Objective Optimal Allocation of Water Resources in Handan, China. Water 2018, 10, 87. [Google Scholar] [CrossRef]
  10. Yao, Z.Y.; Wang, Z.C.; Cui, X.F.; Zhao, H.F. Research on multi-objective optimal allocation of regional water resources based on improved sparrow search algorithm. J. HydroInform. 2023, 25, 1413–1437. [Google Scholar] [CrossRef]
  11. Calvete, H.I.; Galé, C.; Iranzo, J.A.; Mateo, P.M. A decision tool based on bilevel optimization for the allocation of water resources in a hierarchical system. Int. Trans. Oper. Res. 2023, 30, 1673–1702. [Google Scholar] [CrossRef]
  12. Wang, Y.Z.; Liu, L.; Guo, S.S.; Yue, Q.; Guo, P. A bi-level multi-objective linear fractional programming for water consumption structure optimization based on water shortage risk. J. Clean. Prod. 2019, 237, 117829. [Google Scholar] [CrossRef]
  13. Li, X.Y.; Huang, G.H.; Wang, S.G.; Li, Y.P.; Zhang, X.Y.; Zhou, X. An interval two-stage fuzzy fractional programming model for planning water resources management in the coastal region-A case study of Shenzhen, China. Environ. Pollut. 2022, 306, 119343. [Google Scholar] [CrossRef] [PubMed]
  14. Yue, Q.; Zhang, F.; Zhang, C.L.; Zhu, H.; Tang, Y.K.; Guo, P. A full fuzzy-interval credibility-constrained nonlinear programming approach for irrigation water allocation under uncertainty. Agric. Water Manag. 2020, 230, 105961. [Google Scholar] [CrossRef]
  15. Wang, Y.Z.; Li, Z.; Liu, L.; Guo, P. A fuzzy dependent-chance interval multi-objective stochastic expected value programming approach for irrigation water resources management under uncertainty. Desalination Water Treat. 2021, 212, 17–30. [Google Scholar] [CrossRef]
  16. Xin, Z.; Zhiqin, Y.; Jie, G.; Xiaoyu, H. Water resources carrying capacity and industrial strueture optimization based on intervalfuzzy bi-level programming model. J. Hydraul. Eng. 2019, 50, 565–577. [Google Scholar] [CrossRef]
  17. Cheng, Y.; Jin, L.; Pan, Y.L.; Bai, R.L.; Wei, Y.; Huang, G.H. An improved fuzzy sorting algorithm coupling bi-level programming for synergetic optimization of agricultural water resources: A case study of Fujian Province, China. J. Environ. Manag. 2022, 312, 114946. [Google Scholar] [CrossRef]
  18. Ge, Q.; Wang, L.Y. Water resource optimization bi-level coupling model and carrying capacity of a typical plateau basin based on interval uncertainty stochastic programming. Water Policy 2023, 25, 869–888. [Google Scholar] [CrossRef]
  19. Yue, Q.; Wang, Y.Z.; Liu, L.; Niu, J.; Guo, P.; Li, P. Type-2 fuzzy mixed-integer bi-level programming approach for multi-source multi-user water allocation under future climate change. J. Hydrol. 2020, 591, 125332. [Google Scholar] [CrossRef]
  20. Xiao, J.; Cai, Y.P.; He, Y.H.; Xie, Y.L.; Yang, Z.F. A dual-randomness bi-level interval multi-objective programming model for regional water resources management. J. Contam. Hydrol. 2021, 241, 103816. [Google Scholar] [CrossRef]
  21. Grafton, R.Q.; Horne, J.; Wheeler, S.A. On the Marketisation of Water: Evidence from the Murray-Darling Basin, Australia. Water Resour. Manag. 2016, 30, 913–926. [Google Scholar] [CrossRef]
  22. Fang, L.; Wu, F. Can Water Rights Trading Scheme Promote Regional Water Conservation in China? Evidence from a Time-Varying DID Analysis. Int. J. Environ. Res. Public Health 2020, 17, 6679. [Google Scholar] [CrossRef] [PubMed]
  23. Chen, S.J.; Cao, Y.Y.; Li, J. The Effect of Water Rights Trading Policy on Water Resource Utilization Efficiency: Evidence from a Quasi-Natural Experiment in China. Sustainability 2021, 13, 5281. [Google Scholar] [CrossRef]
  24. Pan, J.; Peng, J.; Yang, X.; Xuan, S. Does water rights trading promote resources utilisation efficiency and green growth? Evidence from China’s resources trading policy. Resour. Policy 2023, 86, 104235. [Google Scholar] [CrossRef]
  25. Yang, Y.; Huang, Z.W.; He, W.J.; Li, J.H.; Yuan, L. Can water rights trading improve water resources use efficiency: Empirical evidence from China’s pilot program. In Environment, Development and Sustainability; Springer: Berlin/Heidelberg, Germany, 2024. [Google Scholar] [CrossRef]
  26. He, T.M.; Wang, C.X.; Wang, Z.L.; He, X.L.; Liu, H.G.; Zhang, J. Assessing the Agricultural Water Savings-Economy-Ecological Environment System in an Arid Area of Northwest China Using a Water Rights Transaction Model. Water 2021, 13, 1233. [Google Scholar] [CrossRef]
  27. Zeng, X.T.; Li, Y.P.; Huang, G.H.; Liu, J. A two-stage interval-stochastic water trading model for allocating water resources of Kaidu-Kongque River in northwestern China. J. Hydroinform. 2015, 17, 551–569. [Google Scholar] [CrossRef]
  28. Wang, L.Z.; Huang, Y.F.; Zhao, Y.; Li, H.H.; He, F.; Zhai, J.Q.; Zhu, Y.N.; Wang, Q.M.; Jiang, S. Research on Optimal Water Allocation Based on Water Rights Trade under the Principle of Water Demand Management: A Case Study in Bayannur City, China. Water 2018, 10, 863. [Google Scholar] [CrossRef]
  29. Ren, C.; Zhang, H. A Fuzzy Max-Min Decision Bi-Level Fuzzy Programming Model for Water Resources Optimization Allocation under Uncertainty. Water 2018, 10, 488. [Google Scholar] [CrossRef]
  30. Cai, Y.; Xiao, J.; He, Y.; Guo, H.; Xie, Y. A bi-level multi-objective programming model for water resources management under compound uncertainties in Dongjiang River Basin, Greater Bay Area of China. J. Contam. Hydrol. 2022, 248, 104020. [Google Scholar] [CrossRef]
  31. Chen, Y.Z.; Lu, H.W.; Li, J.; Ren, L.X.; He, L. A leader-follower-interactive method for regional water resources management with considering multiple water demands and eco-environmental constraints. J. Hydrol. 2017, 548, 121–134. [Google Scholar] [CrossRef]
  32. Mansouri, R.; Pudeh, H.T.; Yonesi, H.A.; Haghiabi, A.H. Dynamic programming model for hydraulics and water resources simulating and optimizing water transfer system (a case study in Iran). J. Water Supply Res. Technol.-Aqua 2017, 66, 684–700. [Google Scholar] [CrossRef]
  33. Liu, Z.F.; Zhou, Y.; Huang, G.; Luo, B. Risk Aversion Based Inexact Stochastic Dynamic Programming Approach for Water Resources Management Planning under Uncertainty. Sustainability 2019, 11, 6926. [Google Scholar] [CrossRef]
  34. Suo, M.; Xia, F.; Fan, Y. A Fuzzy-Interval Dynamic Optimization Model for Regional Water Resources Allocation under Uncertainty. Sustainability 2022, 14, 1096. [Google Scholar] [CrossRef]
  35. Li, M.; Guo, P.; Ren, C.F. Water Resources Management Models Based on Two-Level Linear Fractional Programming Method under Uncertainty. J. Water Resour. Plan. Manag. 2015, 141, 05015001. [Google Scholar] [CrossRef]
  36. Li, Z.; Hu, W.; Dong, P.; Zhou, J.; Cong, Z.; Zhao, S. Combined Heat and Power System Day-ahead Scheduling Based on Chance-Constrained Goal Programming. J. N. China Electr. Power Univ. 2023, in press. [Google Scholar]
  37. Davijani, M.H.; Banihabib, M.E.; Anvar, A.N.; Hashemi, S.R. Multi-Objective Optimization Model for the Allocation of Water Resources in Arid Regions Based on the Maximization of Socioeconomic Efficiency. Water Resour. Manag. 2016, 30, 927–946. [Google Scholar] [CrossRef]
  38. Wang, Z.P.; Tian, J.C.; Feng, K.P. Optimal allocation of multi-objective water treatment based on hybrid particle swarm optimization algorithm. Desalination Water Treat. 2019, 163, 310–316. [Google Scholar] [CrossRef]
  39. Jahandideh-Tehrani, M.; Bozorg-Haddad, O.; Loáiciga, H.A. Application of particle swarm optimization to water management: An introduction and overview. Environ. Monit. Assess. 2020, 192, 281. [Google Scholar] [CrossRef] [PubMed]
  40. Kheirkhah, A.; Navidi, H.; Bidgoli, M.M. Dynamic Facility Layout Problem: A New Bilevel Formulation and Some Metaheuristic Solution Methods. IEEE Trans. Eng. Manag. 2015, 62, 396–410. [Google Scholar] [CrossRef]
  41. Kong, Q.; Xie, X. Theory and Empirical Analysis of Agricultural Equilibrium Water Price in lrrigation District. Water Sav. Lrrigation 2021, 6, 87–92+96. [Google Scholar]
  42. Ding, L. Research and Application of Optimal Allocation of Yehe Irrigation Model District Based on Uncertainty. Master’s Thesis, Taiyuan University of Science and Technology, Taiyuan, China, 2021. [Google Scholar]
  43. Yang, H. Thoughts on the implementation of groundwater exploitation project in Yehe Irrigation District. Hebei Water Resour. 2015, 8, 28. [Google Scholar]
  44. Shijiazhuang Water Conservancy Bureau. The 14th Five-Year Plan for Water Security in Shijiazhuang City; Shijiazhuang Water Conservancy Bureau: Shijiazhuang, China, 2021; pp. 10–33.
  45. Shijiazhuang Statistics Bureau. Shijiazhuang Statistical Yearbook (2020); China Statistics Press: Beijing, China, 2021; pp. 4–191. [Google Scholar]
  46. Shijiazhuang City Water Resources and Hydropower Survey and Design Institute. Comprehensive Planning of Water Resources in Shijiazhuang City(2018–2035); Hebei Hydrological Engineering Geological Survey Institute: Shijiazhuang, China, 2017; pp. 61–186. [Google Scholar]
  47. Shijiazhuang Integrated Water Resources Service Centre. Shijiazhuang Water Resources Bulletin; Shijiazhuang Water Conservancy Bureau: Shijiazhuang, China, 2020; pp. 1–11.
  48. Li, M.; Guo, P.; Singh, V.P. An efficient irrigation water allocation model under uncertainty. Agric. Syst. 2016, 144, 46–57. [Google Scholar] [CrossRef]
  49. Li, M.; Fu, Q.; Guo, P.; Singh, V.P.; Zhang, C.L.; Yang, G.Q. Stochastic multi-objective decision making for sustainable irrigation in a changing environment. J. Clean. Prod. 2019, 223, 928–945. [Google Scholar] [CrossRef]
  50. Kolluri, S.S.; Esfahani, I.J.; Yoo, C. Robust fuzzy and multi-objective optimization approaches to generate alternate solutions for resource conservation of eco-industrial park involving various future events. Process Saf. Environ. Prot. 2016, 103, 424–441. [Google Scholar] [CrossRef]
  51. Suo, M.Q.; Wu, P.F.; Zhou, B. An Integrated Method for Interval Multi-Objective Planning of a Water Resource System in the Eastern Part of Handan. Water 2017, 9, 528. [Google Scholar] [CrossRef]
Figure 1. Geographic location map of the Yehe Irrigation District.
Water 16 01751 g001
Figure 2. Framework for water resource allocation.
Water 16 01751 g002
Figure 3. The random distribution function of surface water inflow at a guaranteed rate of p = 50%.
Water 16 01751 g003
Figure 4. Comparison chart of water consumption per CNY ten thousand GDP (m3).
Water 16 01751 g004
Figure 5. Initial allocation outcomes of water rights.
Water 16 01751 g005
Figure 6. Percentage of water withdrawals by water-using sector and actual water withdrawals by water-using sector in different sub-regions in Stage 1 (104 m3).
Water 16 01751 g006
Figure 7. Percentage of water withdrawals by water-using sector and actual water withdrawals by water-using sector in different sub-regions in Stage 2 (104 m3).
Water 16 01751 g007
Figure 8. Percentage of water withdrawals by water-using sector and actual water withdrawals by water-using sector in different sub-regions in Stage 3 (104 m3).
Water 16 01751 g008
Figure 9. Percentage of water withdrawals by water-using sector and actual water withdrawals by water-using sector in different sub-regions in Stage 4 (104 m3).
Water 16 01751 g009
Figure 10. Comparison of economic benefits of each sub-region of irrigation district in planned year.
Water 16 01751 g010
Figure 11. Comparison of the share of water withdrawals by water use sector in the planned year.
Water 16 01751 g011
Table 1. Water demand of different water-consuming sectors in planned year (104 m3).
Sub-RegionDomesticAgricultureIndustry
Luquan2737.488228.641650.00
Jingxing1042.004641.48573.00
Pingshan1701.017040.233459.00
Yuanshi 1568.2615,457.46530.00
Table 2. External water supply (104 m3).
Water-Receiving CountiesDesign Water Supply Target20202025
Luquan5878.003526.804996.00
Yuanshi1744.001046.401482.00
Table 3. The benefit coefficient and net water price of different water use sectors in each sub-region in the planned year.
Sub-RegionBenefit Coefficient (CNY/m3)Net Water Price/(CNY/m3)
DomesticAgricultureIndustryDomesticAgricultureIndustry
Luquan450.011.6370.03.30.54.0
Jingxing450.013.7370.03.30.54.0
Pingshan450.09.8370.03.30.54.0
Yuanshi450.018.8370.03.30.54.0
Table 4. Forecast results for the planned annual GDP of the irrigation district (108 CNY).
Sub-Region2020Annual Growth Rate2025
2013–20172018–20202021–2035
Luquan303.425.54%1.87%3.50%397.31
Jingxing93.012.50%0.86%2.00%109.93
Pingshan235.642.76%1.73%1.50%270.00
Yuanshi157.943.35%3.17%3.00%219.46
Total790.013.54%1.91%2.50%996.70
Table 5. The target value of the model is solved under the guaranteed rate p = 50% in 2025.
Sub-RegionTotal DeviationNet Benefit of Each Sub-Region (108 CNY)
Luquan1.96212.08
Jingxing133.76
Pingshan348.38
Yuanshi124.56
Table 6. Actual water withdrawals by water use sector in different sub-regions (104 m3).
Sub-RegionDomesticAgricultureIndustry
Luquan2363.75 6799.25 2976.61
Jingxing850.31 4345.67 2525.64
Pingshan1768.30 10,288.40 6615.50
Yuanshi1361.39 5218.19 1293.81
Table 7. The outcomes of water rights trading in diverse sub-regions at various stages (104 m3).
StageSub-RegionWater Rights Trading Volume
Surface WaterGroundwater
t = 1Luquan175.10488.20
Jingxing165.26−168.13 *
Pingshan−187.70 *−74.30 *
Yuanshi−152.35 *−50.59 *
t = 2Luquan−332.30 *480.50
Jingxing629.20−211.50 *
Pingshan−405.40 *−1234.40 *
Yuanshi488.901080.80
t = 3Luquan175.60382.00
Jingxing−72.10 *−310.20 *
Pingshan209.40−641.00 *
Yuanshi244.68697.76
t = 4Luquan348.60395.70
Jingxing41.74−132.69 *
Pingshan−78.60 *−244.40 *
Yuanshi−48.73 *31.73
Note: * indicates the purchase of water rights.
Table 8. The results of the actual water withdrawal of the water sectors in each stage of the comparison model (104 m3).
StageSub-RegionDomesticAgricultureIndustry
Surface WaterGroundwaterSurface WaterGroundwaterSurface WaterGroundwater
t = 1Luquan182.30258.001198.301363.7059.00320.70
Jingxing5.34157.97866.70172.4947.11105.89
Pingshan57.60255.302197.700.00700.00422.90
Yuanshi42.50257.12259.89498.5123.06163.95
t = 2Luquan360.90548.702300.701295.00214.60466.10
Jingxing38.00275.401410.40443.2083.40745.50
Pingshan175.00484.504074.700.001096.50751.30
Yuanshi112.30371.80529.401358.4014.70363.00
t = 3Luquan300.00360.401190.20620.90211.80432.30
Jingxing20.90151.601209.50268.1062.20156.70
Pingshan123.10319.002947.300.00804.10691.00
Yuanshi88.40236.50214.001184.6017.80147.30
t = 4Luquan141.00264.201132.60122.5090.80307.90
Jingxing14.36146.85895.79102.8919.05302.88
Pingshan110.80228.502552.200.00420.00493.00
Yuanshi30.76168.39393.17891.9930.35147.05
Disclaimer/Publisher’s Note: The statements, opinions and data contained in all publications are solely those of the individual author(s) and contributor(s) and not of MDPI and/or the editor(s). MDPI and/or the editor(s) disclaim responsibility for any injury to people or property resulting from any ideas, methods, instructions or products referred to in the content.

