Location via proxy:   [ UP ]  
[Report a bug]   [Manage cookies]                
Article

Investigating Plastic Anisotropy of Single and Two-Phase (α2-Ti3Al + γ-TiAl) PST-TiAl Through Computational Yield Surface Analysis

by
Mohammad Rizviul Kabir
1,* and
Muhammed Bahadir Murat
1,2
1
Institute of Materials Research, German Aerospace Center, Linder Höhe, 51147 Cologne, Germany
2
Independent Researcher, 06810 Ankara, Turkey
*
Author to whom correspondence should be addressed.
Metals 2025, 15(2), 132; https://doi.org/10.3390/met15020132
Submission received: 27 November 2024 / Revised: 24 January 2025 / Accepted: 26 January 2025 / Published: 28 January 2025
(This article belongs to the Special Issue Self-Organization in Plasticity of Metals and Alloys)

Abstract

:
The anisotropic mechanical behaviour of multi-phase TiAl alloys is intrinsically governed by the anisotropic crystal properties and morphology of their constituent phases, which control the initiation of local plasticity. To advance the understanding of macroscopic plastic anisotropy in multi-phase alloys, this study presents a comprehensive numerical investigation of a two-phase (α2-Ti3Al + γ-TiAl) lamellar TiAl alloy, with a focus on the evolution of plasticity across multiple structural scales. Utilizing the crystal plasticity finite element method (CPFEM), the influence of lamellar orientation (φ) and applied loading angles (θ) on plastic deformation and yield surface evolution was analysed in both the individual phases and in the combined two-phase system. The findings reveal that phase-specific anisotropy stems from the activation of distinct slip systems in the α2 and γ phases, with the activation closely tied to the type of loading (e.g., proportional biaxial loading) and the direction of the load path. Furthermore, the anisotropy of the two-phase system is significantly influenced by the alignment between the lamellar interface orientation and the load-path direction. Analysis with varying load-path directions across different stress planes clarifies how local deformation constraints within the embedded phases modulate slip system activation, leading to either the enhancement or suppression of specific deformation mechanisms. This, in turn, alters the overall yield behaviour of the material. Based on these simulation results, this study provides a detailed understanding of the internal constraints within embedded phases and their role in the evolution of plasticity. It elucidates how anisotropy develops under diverse loading conditions and underscores the importance of hierarchical plasticity in shaping the global anisotropic response of TiAl alloys.

1. Introduction

Titanium aluminides (TiAl) alloys have emerged as highly promising materials in the field of advanced structural applications, particularly within the aerospace, automotive, and power generation industries. Among various types of titanium aluminides, the γ-TiAl and its derivatives, especially those with the two-phase lamellar structure comprising α2-Ti3Al and γ-TiAl phases, have attracted significant interest due to their excellent combinations of ductility and strength [1,2]. These alloys are increasingly utilized in low-pressure turbine (LPT) blades of aeroengines, where a critical balance between ductility and strength is essential to prevent failure under complex loading conditions. Advances in additive manufacturing (AM) have enabled the production of near-net-shape LPT blades with intricate geometries, offering the ability to tailor microstructures for localized property enhancements [3]. However, AM-processed TiAl components exhibit heterogeneous microstructures with significant morphological variations that strongly influence their mechanical behaviour [4]. The layer-by-layer processing also leads to graded microstructures, resulting in direction-dependent properties such as variations in stress-strain responses, yield strength, and strain hardening [5].
The heterogeneous microstructure of γ-TiAl alloys consists of polycrystalline aggregates comprising duplex grains (single-phase γ-TiAl) and lamellar colonies (multi-phase regions with α2-Ti3Al and γ-TiAl lamellae). The mechanical responses of these alloys are intrinsically linked to the morphological variations. Duplex γ-grains contribute to single-phase behaviour, while lamellar colonies drive multi-phase interactions. Macroscopic anisotropy in stress-strain curves arises from the deformation of polycrystalline grains with preferred orientations, reflecting process-induced texture. Furthermore, the TiAl phases exhibit anisotropic crystal properties at the microscale, amplifying the direction-dependent mechanical behaviour. Developing a comprehensive understanding of plasticity across length scales—from the phase to the component level—remains a significant challenge.
In this context, the two-phase lamellar structure plays a critical role in balancing the ductility, strength, and directional mechanical properties. Extensive studies on lamellar single crystals, referred to as Polysynthetically Twinned Titanium Aluminide (PST-TiAl) crystals, revealed the fundamental micromechanisms of plasticity arising from the interactions of multi-phase constituents [6,7,8]. These studies have demonstrated pronounced directional dependencies in mechanical properties, including yield strength and strain hardening, due to phase anisotropy of these phases, as well as their preferred deformation slip activity with respect to the loading direction. Nano- and micromechanical experiments [9,10,11,12] have further elucidated the roles of brittle and ductile phases, as well as their oriented structural organization, in governing plasticity in this multi-phase alloy.
Computational studies employing crystal plasticity finite element method (CPFEM) have provided additional insights into the deformation mechanisms, considering factors such as alloy composition, phase constituents, morphological variations, texture, and the inherent variability of mechanical properties [13,14,15,16,17]. The anisotropy observed in these alloys arises from two primary sources: crystallographic factors, where direction-dependent crystal properties of the α2 and γ phases govern distinct slip system activation [18,19,20], and microstructural factors, such as lamellar spacing, domain size, and orientation, which significantly influence the global stress-strain response and contribute to a pronounced direction-dependent evolution of plasticity [7,8,9,21,22,23].
The formation of plasticity in γ-TiAl alloys has been extensively studied under uniaxial loading conditions [7,24,25,26]. However, polycrystalline aggregates in these alloys experience multiaxial constraints at the local level, resulting in inherently anisotropic mechanical responses. This raises critical questions about how locally arranged grains respond to anisotropy and how effective properties exhibit orientation-dependent stress-strain behaviour. Despite its significance for practical loading scenarios, the anisotropic plastic deformation of γ-TiAl alloys under multiaxial conditions remains insufficiently explored.
Under multiaxial constraints, the interplay between crystallographic, morphological, and hierarchical factors becomes critical, as phase orientations and lamellar boundaries selectively activate or suppress distinct slip systems, thereby altering the evolution of plastic deformation [27,28]. In this regard, the study of yield loci, geometric representations of yield points under various stress combinations, offers valuable insights into the anisotropic response of materials [29]. The Yield loci depict stress states, at which a material is plastically deformed, with their shape and orientation reflecting the material’s yielding behaviour under complex stress configurations. The contours of the yield loci can be generated by applying systematic radial-loads over θ ∈ [0°, 360°] load-path angles in a 2D stress-plane, e.g., (σ12) or (σ32). This approach enables the exploration of instantaneous yielding behaviour under incremental plastic deformation, offering a deeper understanding of material performance under multiaxial stress conditions [30]. A similar approach has been employed to estimate anisotropic yield functions for BCC and FCC materials [31], as well as HCP materials [32], considering anisotropic crystal deformation computed within the framework of CPFE modelling.
In an earlier study, Schlögl et al. [33] computed the anisotropic yield of PST-TiAl using a simplified CPFE model that considered limited slip interactions within the α2 and γ phases. However, the anisotropic yield response has not been comprehensively examined or evaluated using 3D microstructural models that incorporate most of the relevant operative slip systems. Investigating yield anisotropy under a full loading spectrum, including multiaxial stress states across all three principal stress planes, remains an important and intriguing area of study.
In the pursuit of understanding macroscopic anisotropy, several critical aspects need further investigation: (a) the role of phase-specific slip systems in driving plastic anisotropy under complex multiaxial loading conditions; (b) the impact of local deformation constraints, such as lamellar interfaces and phase boundaries, on macroscopic anisotropy; and (c) the interactions between structural features, including lamellar orientations and phase-boundary alignments, with crystallographic anisotropies and their collective influence on the evolution of equivalent von Mises stress and yield surface contours.
This study seeks to address these gaps by systematically investigating the anisotropic plasticity in α2 and γ phases, both in their bulk forms and in their combined configuration of two-phase (α2 + γ) PST-TiAl crystal. The aim is to establish perceptible connections between slip interactions within the individual phases and overall anisotropic yield response of the PST-TiAl crystal, thereby deepening our understanding of the hierarchical factors that govern anisotropic behaviour of TiAl alloys. These objectives will be pursued through a series of investigations outlined as follows:
  • Characterization of slip system activity in TiAl phases under biaxial loading: This objective involves a detailed examination of the operative slip systems in γ-TiAl and α2-Ti3Al phases, and within the lamellar PST-TiAl structure. Biaxial loading with varied load-path angles will be applied to analyse the contribution of specific slip systems to the anisotropic plastic deformation.
  • Correlation between slip system activity and yield surface evolution: This analysis will explore how slip system activation in α2 and γ phases influences the formation and evolution of 2D plane-stress yield surfaces, both in single-phase and combined-phase scenarios. The study will explore the roles of crystallographic deformation modes and involved slip systems in shaping the yield loci contours.
  • Phase-specific contributions to plastic anisotropy in PST-TiAl alloy: By investigating distinct deformation mechanisms and yield loci of the single-phases and combined two-phase structures, this objective will clarify how the co-deformation constraints and slip interactions contribute to local plastic evolution within the lamellar microstructure.
  • Yield loci sensitivity due to oriented load-paths along different stress-planes: The yield anisotropy in oriented lamellar microstructures under varying multiaxial loading conditions will be investigated by analysing the evolution of yield loci in PST-TiAl structures across different stress planes, e.g., (σ12) and (σ32). This study will evaluate the sensitivity of radial load paths and its impact on the contours of the yield loci. Emphasis will be placed on understanding the interplay between structural alignments and crystallographic anisotropies in governing the anisotropy of Mises equivalent stress.

2. Materials and Methods

2.1. Deformation Behaviour of Multi-Phase (α2 + γ) Lamellar PST-TiAl Alloy

The PST-TiAl alloy is characterized by a two-phase crystal comprising of α2-Ti3Al and γ-TiAl phases in the form of lamellar structure [34]. The α2-Ti3Al lamellar phase has a hexagonal ordered D019 crystal structure, while the γ-TiAl lamellar phase has a face-cantered tetragonal L10 crystal structure (Figure 1a,b). The fully lamellar structure is formed by alternating layers of these two phases, where multiple γ-phases are interspersed between two α2-phases. The γ-phases consist of matrix and twin lamellae where numerous γ-phase domains are coherently attached (Figure 1c,d). The closely packed (0001)α2- and {111}γ-planes, as well as the closely packed directions <11-20>α2 and <110>γ, are parallel [10]. A specific crystallographic orientation relationship, named Blackburn Orientation Relationship [35], is found among γ-domains and α2-phases. The matrix-domain variants exhibit 0°, 120°, and 240° orientations, while the twin variants display 180°, 300° and 60° orientations. The overall deformation of the lamellar structure is averaged by individual γ-domain deformation and the deformation of adjacent α2-lamellae.
The yield stresses of PST-lamellar alloys vary significantly with lamellar orientations. The degree of variation depends on the alloy compositions and key microstructural parameters, such as lamellar spacing and domain size [6,7,8,9,14,15]. Figure 2 illustrates the yield anisotropy with respect to the lamellar plane angle, φ under uniaxial loading conditions. The general trend reveals a U-shaped variation in the yield stress. At φ = 0° and φ = 90° lamellar orientations higher yield stresses are observed, while lower yield stresses occur for intermediate lamellar orientations, φ = 15–75°. The lowest yield stress is recorded at φ = 45°. Lamellar orientations associated with higher yield stresses are referred to “hard orientations”, while those resulting in lower yield stresses are termed “soft orientations”.
Detailed study revealed how the plastic deformation and anisotropic yield behaviour in PST-TiAl alloys are governed by the micromechanical processes within the α2 and γ phases. Ductility is mainly attributed to the γ-phase, while the α2-phase is associated with brittleness. In γ-TiAl, dislocations manifest as ordinary, twinning, or super dislocations, with {111}γ-planes being the primary slip planes (Figure 1b). Ordinary dislocations, characterized by ½<110> Burgers vectors, are prevalent, while super dislocations in the <011> direction involve higher energy. At ambient temperatures, ordinary dislocations, and mechanical twinning, which involves shear along the ⅙<11-2> direction with a 180° rotation about the {111}γ-plane, are the main deformation mechanisms. Conversely, the α2-Ti3Al phase, being less deformable, features only three independent slip systems: basal {0001}, prismatic {1-100}, and pyramidal {11-21} planes (Figure 1a).
The macroscopic deformation in this alloy is driven by the activation of distinct slip systems, which vary with the loading direction. Based on the experimental observations, Lebensohn and co-workers [14] proposed a classification of crystallographic deformation modes in lamellar systems, namely “Longitudinal”, “Mixed”, and “Transverse”. In the Longitudinal mode, slip occurs parallel to the lamellar boundary on {111}γ-planes. The Mixed mode involves slip inclined to the lamellar boundary, running along the longitudinal direction and across the lamellar width. In the Transverse mode, slip occurs along the inclined lamellar boundary, across the lamellar thickness.
Figure 3 illustrates the active slip systems in γ-TiAl and α2-Ti3Al phases, grouped according to the deformation modes. The activation of these slip systems depends on the loading angles relative to the lamellar plane.

2.2. Deformation Behaviour of γ-TiAl and α2-Ti3Al Single Phases

The micromechanical deformation and anisotropic yield behaviour of multi-phase PST-TiAl alloys have been extensively studied due to their significance in structural applications. However, the specific contributions of the individual phases, α2-Ti3Al and γ-TiAl, to the overall yield anisotropy within the lamellar PST-TiAl structure remained insufficiently understood. Fundamental studies have reported that both the face-centred tetragonal L10 structure of γ-TiAl and the hexagonal D019 structure of α2-Ti3Al exhibit anisotropic elastic constants and direction dependent deformation behaviour [18,38]. However, a systematic investigation into the nature of anisotropy in these bulk crystals, specifically regarding both elastic and plastic deformation, remains lacking.
Within the lamellar microstructure of PST-TiAl alloys, these phases α2-Ti3Al and γ-TiAl co-deform and are subjected to complex multi-axial stress conditions. Modelling the yield surfaces under multi-axial conditions the role of phase-specific deformation and the locally evolving anisotropy can be well understood.

2.3. Micromechanical Modelling of TiAl Deformation

2.3.1. Unit Cell FE Model of Two-Phase PST-TiAl and Bulk TiAl Phases

The lamellar microstructure of PST-TiAl alloys is characterized by several structural parameters, including the volume fractions of α2 and γ phases, lamellar thickness, γ-domain size, and the distance between α2-lamellae. To accurately simulate this microstructure, a cubic FE unit cell model was constructed, as proposed by [17]. In this model, the volume fraction of α2 phase was set at 4%, with the spacing between α2-lamellae maintained as a constant to represent an ideal lamellar spacing. The microstructure was further defined by the ratio of domain size to lamellar thickness, where a higher ratio implies larger γ-domains. Assuming large γ-domains a lamellar unit cell was constructed. It required seven representative volume elements (RVEs), one for the α2-phase, three for γ-matrix domains, and three for γ-twin variants, as depicted in Figure 4a,b.
To capture the deformation behaviour of the lamellar PST model more accurately, the Blackburn Orientation Relationship was applied to the γ-domains within the unit cell. The Taylor assumption was employed for obtaining homogenized properties of the two-phase lamellar structure. Under this assumption, an intralamellar deformation is characterized by the uniform distribution of strain within each lamella, resembling Voigt isostrain model.
The unit cell model can be rotated within its local coordinate system for a given lamellar orientation φ. Thus, anisotropic responses of the oriented lamellae under various loading conditions can be investigated.
Effective mechanical properties, such as stress and strain of the lamellar structure, were derived by homogenizing the phase-level stress-strain responses of the RVEs over the whole unit cell. A finite element-based two-scale (FE2) multiscale approach was used to localize external loads to the RVEs and homogenize stresses across them [17].
For the simulation of α2-Ti3Al or γ-TiAl single phases, the lamellar unit cell (Figure 4b) was modified to a single-phase cubic unit cell such that only one phase (1-RVE) is present over the whole unit cell. The unit cell was then discretized into a mesh of 5 × 5 × 5 cubic finite elements. Using the same FE2 approach, the stress-strain behaviour of these single phases was evaluated across various oriented configurations.
Comparing the plastic deformation responses resulted from single-phase and multi-phase unit cell models, a clear distinction of the micromechanical responses of the α2 and γ phases in their bulk and embedded states will be made.

2.3.2. Crystal Plasticity (CP) FE Modelling for TiAl Deformation Behaviour

To simulate the micromechanical responses of the PST-TiAl alloy, a rate-dependent crystal plasticity constitutive model was employed for each phase. In the CPFEM, the onset of plastic slip was governed by Schmid’s law, which asserts that slip initiates when the resolved shear stress on a given slip system exceeds a critical threshold known as the critical resolved shear stress (CRSS). The magnitude of this resolved shear stress depends on the applied stress and the orientation of the slip system in relation to this stress.
The rate-dependent constitutive behaviour defines the shear rate on a slip system as a function of both the resolved shear stress, τ, and the slip strength, g0. Deformation twinning was incorporated into the model using a critical shear stress criterion analogous to Schmid’s law, which is applicable to crystallographic slip.
Various integration methods for crystal plasticity have been proposed for finite element analysis of single crystals and polycrystals. In this study, the implicit integration formulation proposed by Pierce et al. [39] has been utilized. The model has been implemented in ABAQUS through a Fortran-based user material subroutine (UMAT) following the approach described by Huang [40]. The application of this CPFEM to characterize the slip-induced crystallographic deformation of the α2 and γ-phases has been comprehensively discussed in prior research [15,41,42,43].
For the present PST-TiAl alloy, the CP parameters were calibrated by fitting experimental yield anisotropy data (Figure 2) to the lamellar orientation of the material. The details of the experiments and fitting procedures were described elsewhere [43,44]. For modelling the anisotropic elastic behaviour of the crystals, the elastic constants C{ijkl} were taken from [45], as presented in Table 1.
The initiation of slips corresponding to various deformation modes (as shown in Figure 3) was examined by calibrating the slip strength, g0 and hardening modulus, h0. Since the evolution of resolved shear stresses on the slip systems depend on the angle between the load and lamellar plane, the CP modelling over a range of lamellar orientations, φ, from 0° to 90° allow one to model direction dependent yield of the lamellar microstructure. The predicted anisotropic yields were then fitted with the corresponding yield points determined experimentally. It was demonstrated that, depending on the lamellar orientation, certain deformation modes dominate, with specific slip system groups playing a pivotal role in the plastic deformation process [14]. Thus, the orientation-dependent active slip systems and their corresponding CP parameters can be estimated. The validated parameters for slip strengths and hardening modulus are summarized in Table 2.
In the present study, the validated parameter sets from Table 1 and Table 2 were further utilized to simulate the plastic deformation and yield loci behaviour of the α2 and γ-phases.

2.4. Modelling of Plane Stress Yield Locus

The unit cell model was employed to simulate 2D instantaneous yield surfaces over a (σ12) stress-plane. Periodic boundary conditions (PBCs) were applied with specific nodal arrangements to facilitate the calculation of shape changes from the displacement of the corner nodes (Figure 5a). The unit cell was deformed by applying external stresses along a radial loading path. The radial load-path direction was determined by the ratio of the principal stresses, defined as σ21 = arctan(θ), where θ represents the load-path angle (Figure 5b). The ratio σ21 remained constant along each load path, allowing for systematic exploration of the yield surface evolution.
By varying the load-path angle θ, the proportionality between σ2 and σ1 was adjusted, thereby altering the imposed stress components over the unit cell outer surfaces. For a comprehensive characterization of the anisotropic yield behaviour within the (σ12) stress-plane, multiple radial loading paths were defined, covering the entire angular range of θ ∈ [0°, 360°]. For this work, 24 radial load paths were defined by incrementing the load angle, θ in 15° steps, each corresponding to an instantaneous yield point calculated for a distinct equivalent plastic strain, εpq, value. For increased equivalent plastic strains, corresponding yield stresses represent the strain hardening behaviour. Yield loci contours were constructed by connecting the yield stress points associated with the isostrain values. Figure 5b schematically illustrates yield surfaces composed of several yield loci contours, highlighting the stress states across different quadrants.
The yield surface in lamellar TiAl alloy is shaped by both the microstructural and phase induced anisotropy. Additional numerical simulations are essential to elucidate the complex interactions of slips when considering the orientation of the lamellae and the loading direction. To clarify this relationship, a schematic illustration of the slip planes and slip directions with respect to the orientation of the lamellae and load-path direction over a 2D stress plane is shown in Figure 6.
In Figure 6a, the angle of σ2 direction varies with the lamellar plate normal, where the σ1-direction is always parallel to transverse to the lamellar plane. The applied proportional stress, σ, acts on (σ12)-plane. In Figure 6b, the loading angle of σ2 and σ3 both changes with respect to the oriented lamellar normal. The applied proportional stress, σ, acts on (σ32)-plane. Thus, the plane stress yield surface behaviour at (σ12) plane and (σ32) plane, obtained by applying radial load-path stress, σ, will not be the same. This assessment of yield surface behaviour over different stress-planes provides information how plasticity evolves for differently oriented lamellar microstructure under the multi-axial loading.

3. Result and Discussion

3.1. Plastic Anisotropy of TiAl Phases in Terms of Yield Surface Behaviour

3.1.1. Yield Loci of γ-TiAl Single Phase

The plastic anisotropy of bulk γ-TiAl was systematically investigated by analysing the yield surface behaviour on a (σ12)-plane using the unit cell model. For this purpose, the γ-phase was defined such that the {111}γ-plane is aligned parallel to the loading axis. This configuration corresponds to the “hard orientation” (φ = 0°) of a lamellar PST-TiAl. For this investigation, four FE models were described for four sets of CP parameters, namely Model-γA, Model-γB, Model-γC, and Model-γD, as listed in Table 3.
Here, the Model-γA was assigned with the “base parameters” of the bulk γ-TiAl, derived from a validated CPFE analysis [42]. Then, the slip system parameters for ordinary, twinning, and super slips were incrementally increased from the base parameter sets. The Model-γB featured increased slip strength parameters for the longitudinal deformation modes, while the Model-γC emphasized higher slip strength parameters for the mixed deformation, and the Model-γD as increased slip strengths for the transverse deformation. With this systematically varying CP parameters, this study aimed to understand how different slip systems influence the formation and evolution of the yield surface.
For all the models, several yield loci were calculated within the equivalent plastic strain range from εpq = 0.0002 to εpq = 0.002 (Figure 7). The load-path angles θ = 0° and θ = 90° correspond to the uniaxial loading along σ1 and σ2 axes, respectively, while the first quadrant (0° < θ < 90°) represents tensile biaxial loading. Selected load-path directions θ = 0°, 30°, 45°, 90° were investigated to understand the evolution of yield loci as a measure of anisotropic response due to parameter variations.
Several characteristic features emerge from the analysis of yield loci contours:
  • For all the models, the yield loci contours exhibit an elliptical or biased elliptical shape. In the Model-γA and γB, the major axes align at θ = 30°, producing a narrow yield loci contour. The Model-γC displays broader yield loci contour, also aligned at a θ = 30° load path, while the Model-γD exhibits narrow, elongated yield loci contour aligned at θ = 45°, corresponding to equibiaxial tension. Variations in shape and major-axis rotation reflect the anisotropic characteristics induced by the deformation modes activated through CP parameters.
  • Yield evolution varies with increasing equivalent plastic strain depending on the load angle. For a load path at θ = 0° (uniaxial tension), the Model γC shows a more substantial increase in σ1 stresses over the εpq range from 0.0002 to 0.002 compared to the models γA, γB, and γD. This difference is highlighted by comparing the widths of the yield loci contours along the σ1 and σ2 axes, denoted as w1 and w2 in the figure. The variations in yield loci evolution with εpq increments indicate distinct strain-hardening behaviour among the models.
The characteristic features of the yield loci obtained for γ-TiAl show behaviour similar to that of other FCC-type crystals [46,47]. However, the tetragonality of γ-TiAl crystals results in more pronounced anisotropy compared to conventional FCC crystals.
To compare stress evolution under incremental εpq, stress differences at θ = 30° and θ = 45° load paths within the contours of εpq = 0.0002 and 0.002 were projected onto the σ1 and σ2 axes. These differences, depicted as εpq1Δσ1, εpq2Δσ1, εpq1Δσ2, and εpq2Δσ2, show that the models γA, γB, and γC exhibit greater σ1 stress variation compared to σ2 (i.e., εpq2Δσ1 > εpq2Δσ2), indicating that material yielding is predominantly influenced by σ1 stresses. In contrast, the Model-γD shows the reverse behaviour, with the yield loci’s contour ellipticity and width suggesting a distinct anisotropic yield response relative to the other models.

3.1.2. Yield Loci of α2-Ti3Al Single Phase

The unit cell models of α2-Ti3Al single phase was described such that the (0001)α2-plane is parallel to the loading direction. This configuration corresponds to the “hard orientation” (φ = 0°) of a lamellar PST-TiAl, where the (0001)α2-basal plane of α2-Ti3Al phase is consistently aligned parallel to the lamellar interface. In this configuration, the plane stress yield surfaces of the α2-Ti3Al single phase were analysed. The simulation parameter sets are outlined in Table 4.
The base parameter set in Model-α2A was taken from the validated CPFE analysis described in [25]. The CP parameters were systematically adjusted for the basal, prismatic, and pyramidal slip systems by specific scaling factors from this base set, creating variations designated as the Model-α2B, Model-α2C, and Model-α2D, respectively.
The yield surfaces generated from these models are shown in the (σ12) stress plane in Figure 8. Here, the inner and outer loci represent equivalent plastic strains, εpq, of 0.0002 and 0.002, respectively. The elongated yield contours depict the yield surface evolution with increasing εpq, while the expansion of these loci contours indicates the strain hardening behaviour specific to each model: α2A, α2B, α2C, and α2D.
Figure 8a,b display yield loci contours for the Models α2A and α2B as narrow, elongated hexagons with varying arm lengths. For the Model-α2C, the yield loci contours are rounded and widened, whereas the Model-α2D presents slightly narrower contours that revert to a hexagonal shape with modestly rounded arms. Correlating these shapes with slip strength parameters in Table 4, the basal slip parameters appear to have minimal impact on the yield loci evolution. However, along the σ1 and σ2 axes (representing uniaxial tensile cases), contours expand more for the Models α2C and α2D, likely due to the higher average slip strength, g0, for the prismatic and pyramidal slip systems. The Model-α2C yields more rounded contours due to a higher prismatic slip parameter, while the Model-α2D shows only slight changes in shape due to increased pyramidal slip strength.
The yield loci characteristics of hexagonal α2-Ti3Al are similar to those of typical HCP crystals [47,48]. The observed shape changes are attributed to the predominant activity of specific slip systems. However, α2-Ti3Al exhibits less pronounced anisotropy compared to the HCP crystals in Mg-alloys [32].
In all models, the major axes of the yield loci align with the load angle θ = 45°, corresponding to equibiaxial tension. This alignment suggests that anisotropy in the α2-Ti3Al phase remains consistent across basal, prismatic, and pyramidal slip variations. Comparing stress components projected along the σ1 and σ2 axes for load angles θ = 30° and θ = 45°, the incremental stress changes (Δσ1 and Δσ2) are similar across models for both low and high εpq values. Thus, the stress changes εpq1Δσ1 and εpq2Δσ2 (along σ1-axis) and εpq1Δσ2 and εpq2Δσ2 (along σ2-axis) remain consistent across all models. This uniform response contrasts with the γ-TiAl single phase, where the major axis shifts from θ = 30° to θ = 45° under changing load angles, with Δσ1 and Δσ2 variations dependent on CP parameters.

3.2. Anisotropy of Equivalent Mises Stress of the TiAl Phases

3.2.1. Equivalent Mises Stress Variation of γ-TiAl Single Phase

The variation of equivalent Mises stress, σV with the changes of load-path angles provides a quantitative measure of the material’s effective anisotropy approximated for unidirectional loading. In this analysis, the σV was calculated for plane stress condition at an equivalent plastic strain, εpq = 0.001, spanning the entire load-path angle range, θ ∈ [0°, 360°], regarding the Q1 to Q4 quadrants of (σ12) stress-plane. Figure 9 shows the results for the Models γA through γD, corresponding to the variations of CP parameters regarding longitudinal, mixed, and transversal deformation modes.
For the Models γA and γB, where the base and longitudinal parameter sets were assigned, the σV exhibits similar periodic, wavelike behaviour. As load-path orientation progresses from 0° to 90°, the σV initially increases in Q1, then decreases from Q1 to Q2. This pattern corresponds to the loading conditions transitioning from uniaxial tension along the σ1-axis, to biaxial tension with the proportional σ21 loading, then again to uniaxial tension along the σ2-axis. Minimum yield stress is observed at θ = 150° and the maximum at θ = 30°, with a phase shift of 120°.
In the Model-γC, characterized by higher mixed parameters, the σV shows a shift across the entire load-orientation domain. Yield stress decreases in Q1 and increases from Q1 to Q2, with minimum yield stress at θ = 60° and maximum at θ = 150°, occurring at a phase shift of 90°. Notably, this model exhibits a higher maximum yield stress level than Models γA and γB.
The Model-γD, configured with higher transversal parameters, also shows decreasing yield stress in Q1 and increasing yield stress from Q1 to Q2, with the minimum yield stress at θ = 150° and maximum at θ = 45°, displaying a phase shift of 105°. This model’s maximum yield stress level surpasses that of the Model-γA and is comparable to the Model-γC.
A comparison across all the models reveals that the range of σV (max-min stress levels) and the phase shifts in the wavy stress curves demonstrate yield anisotropy, primarily governed by the different activation of slip systems under varying deformation modes.

3.2.2. Equivalent Mises Stress Variation of α2-Ti3Al Single Phase

The equivalent Mises yield stress for the α2-Ti3Al single phase under the deformation modes involving basal, prismatic, and pyramidal slips is shown in Figure 10. Across all models, the σV curves exhibit peak values in the Q1 and Q3 quadrants, where biaxial tension or biaxial compression is applied along 45° (Q1) or 225° (Q3) load angles. Conversely, the minimum values occur in the Q2 and Q4 quadrants, where biaxial tension-compression loading is applied along 135° (Q2) or 315° (Q4).
Notably, uniaxial yield stress along σ1 at θ = 0° or along σ2 at θ = 90° varies among models, with the Model-α2D (higher pyramidal slip parameter) showing the lowest yield stress and the Model-α2C (higher prismatic parameter) the highest. The Model-α2D displays the largest σV range (max–min) across the full load-path angle θ ∈ [0°, 360°], while the Model-α2B, with a higher basal slip parameter, shows a moderate σV range, and the Model-α2C exhibits the least σV variation. Each curve reaches maximum yield stress at θ = 45° in the Q1 quadrant and minimum yield stress at θ = 135° in the Q2 quadrant, with the Model-α2D indicating greater yield stress asymmetry under biaxial tension-tension and tension-compression loading. For all models, the σV curves display a phase shift of 180°.

3.3. Role of Operative Slips on the Yield Anisotropy

3.3.1. Slip Activity of γ-TiAl Single Phase Causing Yield Anisotropy

The plastic contribution of slip systems was assessed by calculating their ‘relative activity,’ defined as the ratio of shear strain in a given slip system to the total shear strain in the model. Plotting relative activity against applied load illustrates slip evolution with incremental loading. For this analysis, Models γC and γD were chosen due to their distinct yield loci behaviour, broad and narrow yield loci contour, respectively (Figure 7).
Figure 11 illustrates the ‘slip activity’, associated with three deformation modes, longitudinal, mixed, and transverse, corresponding to the first quadrant of the yield loci diagram (Figure 7c,d). Applied load orientations include θ = 0°, 30°, 45°, 60°, and 90°, all under biaxial tension. Slip evolution is plotted over a stress range of 0 to 1000 MPa, incrementally applied along the radial load path. As shown in Figure 11a–e, initial slip evolution occurred below 400 MPa, which changed their courses within a transition stress zone (400–600 MPa), followed by a shift beyond 600 MPa. The role of slips in the Model-γC and γD can be characterized as follows:
For the Model-γC under uniaxial tension at θ = 0° (Figure 11a), the σ1 stress component was operative. Here, transverse deformation assisted by the twinning, Twin(Trans), is predominant at lower stress levels but diminishes beyond the 400–600 MPa range. In contrast, the super dislocation, Sup(Trans), becomes increasingly active in this range and continues to intensify beyond 600 MPa. The higher strength parameters of the mixed slips facilitated the initiation of transversal slips somewhat earlier because the mixed slips were deformed elastically so far.
In the Model γD, the primary contribution to plastic deformation below 400 MPa is from the super dislocation along the mixed deformation mode, Sup(Mix), with minor contributions from the twinning in the transverse mode, Twin(Trans). Beyond 400 MPa, Sup(Mix) becomes increasingly active, while the super dislocation in the longitudinal direction, Sup(Long), initiates at stresses above 600 MPa. Higher slip strength of transverse parameters favours the mixed slips to be dominant. Minor twinning in transversal direction and the super dislocation in longitudinal direction were also activated due to slightly lower strength values.
Under uniaxial loading at a 90° orientation, where the σ2 stress component prevails, slip activity varies between the Models γC and γD due to (111)γ-plane orientation. For the Model-γC, the longitudinal twinning dominates below 400 MPa. Minor contributions of the ordinary dislocation along transversal direction were also present. But after the transition zone, 400–600 MPa only the ordinary dislocation along transverse direction was dominant. In the Model-γD, the longitudinal twinning complements Sup(Mix) at lower stresses, with increased Sup(Mix) activity at higher stress levels.
For equibiaxial loading at θ = 45°, σ1 and σ2 stress components are proportionally applied. Here, both models initially deform through the longitudinal twinning, Twin(Long), below 400 MPa, with the ordinary dislocation in the transverse mode, Ord(Trans), dominating post-400 MPa. At θ = 30°, with non-proportional stress (σ1 > σ2), the Model-γC’s slip evolution resembles the θ = 0° loading pattern, while in the Model-γD, the longitudinal twinning, Twin(Long), predominates initially, and the Sup(Mix) prevails beyond the higher stress zone. For an intermediate load-orientation, θ = 60° (Figure 11d) with σ1 < σ2, the evolving slips for the Model-γC are dominated by the twinning, same as for the loading direction, θ = 90°. For both the Model-γC and Model-γD, the twinning at the lower stress regime and the ordinary dislocation at the higher stress regime were dominant.
This study demonstrates the complex interactions between different slip systems and their roles in anisotropic yield behaviour across γ-TiAl load-path angles. Variations in shear strain across models and for different load paths elucidate the critical role of specific slip systems in defining yield loci contours.

3.3.2. Slip Activity of α2-Ti3Al Single Phase Causing Yield Anisotropy

Slip activity of α2-Ti3Al single phase has also been studied to characterize yield anisotropy observed in the Model-α2C and Model-α2D (Figure 12c,d). In these models, only the prismatic and pyramidal slips were found to be active for the load angles between θ = 0° and 90°.
For uniaxial loading at θ = 0° (σ1-aligned), plastic deformation primarily occurs through the prismatic slips in both models, with the Model-α2C featuring higher prismatic slip strength and the Model-α2D higher pyramidal slip strength. The prismatic slips were active initially, even though their strengths were lower than that of the pyramidal slips. At θ = 90°, where loading aligns with σ2, the prismatic slips again dominated, while the pyramidal slips are activated only at stress levels above 600 MPa, contributing minimally to the plastic deformation.
Under proportional equibiaxial loading at θ = 45°, where σ21 = 1, anisotropy was driven by the pyramidal slips along the transverse direction. In this configuration, the equal contributions of σ1 and σ2 favour the pyramidal slip activation in both models, despite the high slip strength parameters associated with these systems. For non-proportional biaxial loading at θ = 30° and 60°, the prismatic and pyramidal slips both contributed to plastic deformation. At θ = 30°, σ1 > σ2, and at θ = 60°, σ2 > σ1, resulting in active mixed prismatic and pyramidal slips, with the prismatic slips contributing more significantly to plastic deformation. Below 400 MPa, the prismatic slips dominated with minor pyramidal activation. Beyond 400 MPa, the pyramidal slip activity increased while the prismatic slip contributions decreased, reflecting a transition driven by the activation of mixed and transverse deformation modes.
From this analysis, the roles of prismatic and pyramidal slips in influencing the plastic deformation within hexagonal crystal structures can be well-characterized. Prismatic slips are predominant in uniaxial loading, while pyramidal slips gain significance under biaxial loading configurations, emphasizing the contributions of slip-system behaviour to yield anisotropy.

3.4. Yield Loci and Plastic Anisotropy from Single to Multi-Phases Lamellar Structure

3.4.1. Phase-Specific Contribution to the Yield Loci of Two-Phase PST-TiAl

In the two-phase lamellar structure of α2-Ti3Al and γ-TiAl, the phases undergo mutual constraint and co-deformation under external loading. Slip activations in these phases are driven by local stresses, which contribute to the overall homogenized behaviour observed at the macroscopic level. To elucidate the influence of single-phase plasticity on the effective plastic deformation of the two-phase PST crystal, a comparative analysis of yield surface contours was conducted on both bulk and multi-phase configurations of α2-Ti3Al and γ-TiAl.
These analyses were performed on a unit cell model of two-phase PST-TiAl crystal, as described in Section 2.3.1. In the present case, the CP parameters of the α2 and γ-lamellar phases are chosen from the bulk α2 and γ-phase models. The reference model for the α2-Ti3Al bulk phase, labelled the Model-α2A (Figure 13b), served as the baseline for α2-Ti3Al lamellar phase. For γ-TiAl lamellar phase, two types of bulk γ-TiAl phase models were considered: one is the Model-γC, primarily influenced by mixed slip systems (Figure 13a), and the other is the Model-γD, with slip systems dominated by transverse slip parameters (Figure 13c). Thus, two parametric PST-TiAl lamellar models were generated, namely, (i) Model-α2A + Model-γC (Model-PST1) and (ii) Model-α2A + Model-γD (Model-PST2). Both the models maintain a consistent phase composition of 10% α2-Ti3Al and 90% γ-TiAl and a lamellar orientation of φ = 0°. Yield surfaces for these PST models were then derived using the methodology established for single-phase models.
Figure 13 presents the yield loci contours in the (σ12) plane for the individual phase models and their combined lamellar configurations in the models PST1 and PST2. The inner and outer loci correspond to equivalent plastic strain of εpq = 0.0002 and εpq = 0.003. The isostrain contours at these strain levels revealed distinct differences in yield contour evolution in the model PST1 and PST2.
For the bulk α2-phase, the single-phase model exhibited a narrow, elongated hexagonal yield surface, consistent with its HCP crystal structure (Figure 13b). In contrast, the bulk γ-phase showed elliptical yield loci contours with shapes ranging from wide to narrow, and sizes from normal to elongated, with notable rotation in the major axes and vertices (Figure 13a–c). The yield surfaces of the two-phase (α2 + γ) PST models reflected an averaged response of these bulk phases, predominantly governed by the γ-phase behaviour, resembling the yield surfaces of Models γC and γD more closely than the yield behaviour of the α2-phase from the Model-α2A (Figure 13d,e). The slightly narrow yield surface contours of the PST1 and PST2 models reflect a minimal influence from the α2-phase. The overall response of the PST1 and PST2 involve co-deformation effects of the embedded (α2 + γ)-phases, but given the minor volume fraction of α2, its impact on the overall yield behaviour is limited.

3.4.2. Operative Slips on Embedded Phases During Co-Deformation

Slip Activities of Co-Deformed γ-Phases

Figure 14 compares the slip evolution in the γ-phase for two types of PST models: the PST1, characterized by a higher mixed parameter, and the PST2, characterized by a higher transverse parameter. For comparison, the slip evolution in the bulk γ-phase in Figure 11 can be recalled. Analysing the curves in Figure 11 and Figure 14, it is evident that the operative slip systems and their evolution within the embedded γ-phase differ from those observed in the bulk phase.
When the loading angle θ = 0° (along σ1), the slip evolution in the embedded γ-phase closely resembles that of the bulk phase. However, at other orientations, the embedded γ-phase slip activity diverges significantly from the bulk response.
For instance, at θ = 30°, the ordinary slip systems, Ord(Trans), and the twinning, Twin(Trans), are equally active below a stress level of 400 MPa, after which Twin(Trans) becomes increasingly dominant. In contrast, additional slips are activated in the bulk γ-phase. At θ = 45°, the difference is more pronounced. For both PST1 and PST2, the ordinary slips, Ord(Trans), are active in the embedded γ-phase, whereas in the bulk γ-phase, Twin(Long) is initially activated below 400 MPa, with Ord(Trans) taking over above 400 MPa.
At θ = 60°, the PST1 model primarily activates Ord(Trans), while the PST2 exhibits activity in both super and ordinary slips, specifically Sup(Mixed) and Ord(Trans). For the load angle of θ = 90°, the ordinary slips, Ord(Trans), were active in the PST1, while the super slips, Sup(Mixed), were operative in the PST2.
The slip activity in bulk and embedded γ-phase was compared to demonstrate the effect of local constraints exerted by the neighbouring α2-Ti3Al-phase. Table 5 summarizes the most active slip systems in the γ-phase for bulk and embedded states across load-path angles of 0° to 90°. It compares the active slip systems below 400 MPa and above 600 MPa for the embedded γ-phases in the PST1 and PST2 models, and for the bulk γ-phases in the Model-γC and γD. This quantitative assessment reveals that operative slips evolve differently depending on load-path orientation. The distinctive nature of slip activity in the γ-phases indicates the transition of slips during plastic deformation for the bulk to embedded γ-phase, under the co-deformation constraints of the neighbouring α2-Ti3Al phase.

Slip Activities of Co-Deformed α2-Phases

Similarly, the slip evolution in α2-Ti3Al phase under bulk and embedded situation elaborates the deformation constraint effects on the plastic deformation in multi-phase (α2 + γ)-TiAl system. Figure 15 compares the slip evolution in the α2-phase for two PST models, the PST1 and PST2, with the bulk α2-phase slip evolution provided in Figure 12 for reference.
At a loading angle of θ = 0° (Figure 15a), where only σ1 is applied, the prismatic slips are active in the co-deformed α2-phase at stress levels below approximately 400 MPa, influenced by the neighbouring γ-phase. In the PST1 model, a transition occurs beyond 400 MPa, where the prismatic slip activity diminishes and the pyramidal slips gradually dominate as stress levels exceed 600 MPa. By contrast, in the PST2 model, influenced by the neighbouring γ-domain with higher transverse slip strengths, slip activity remains primarily driven by the prismatic slips.
At θ = 90° (Figure 15e), under uniaxial loading along σ2, both prismatic and pyramidal slips contribute to plasticity in the α2-phase of PST1, albeit with varying intensities. In the PST2 model, the prismatic slips remain consistently active. At an angle of θ = 45° (Figure 15c), under equal biaxial loading along σ1 and σ2, the pyramidal slips are exclusively active in both PST1 and PST2 models. This activation appears to be unaffected by the neighbouring phases, aligning with the observations in bulk phase (Figure 12c).
For loading angles θ = 30° and θ = 60°, where the loading components σ1 and σ2 are unequal, a mixed activation of prismatic and pyramidal slips was expected, as previously observed in bulk α2-phase. (Figure 12b,d). However, in the co-deformed α2-phase, slip system activation differs; below 400 MPa, the prismatic slips dominate, while the pyramidal slips are less active. Beyond 400 MPa, the pyramidal slip activity increases, surpassing the prismatic activity. Notably, at θ = 60°, both prismatic and pyramidal slips are equally active in the early loading stages below 400 MPa, but the pyramidal slips eventually dominate as stress increases.
Table 6 summarizes the active slip systems for plastic deformation in bulk and embedded α2-phases across loading angles θ = 0–90°. This analysis demonstrates how slip evolution in the α2-phase differs between bulk and embedded conditions due to constraints from neighbouring phases. The results show that the interaction between phases significantly influences the progression and nature of slip activity, underlining the role of these constraints on the mechanical response of multi-phase materials. This study indicates that the slip-system evolution and resulting mechanical behaviour are influenced not only by the intrinsic phase properties but also by phase interactions, particularly under constrained conditions.

3.5. Yield Loci Behaviour of PST-TiAl Under Lamellar Orientation and Load Orientation

Previous studies have examined the behaviours of yield loci with the lamellar plane oriented parallel to the load axis, corresponding to a lamellar angle of φ = 0°. In these cases, the shape of the yield loci, and thus the plastic anisotropy, was influenced solely by the direction-dependent active slip systems. In contrast, the uniaxial yield anisotropy observed in Figure 3 results from the differential activation of slip systems due to inclined lamellae, specifically for angles φ ranging from 0° to 90°. The load-angle, θ = 90°, remained fixed while φ was rotated against σ1-axis.
To understand the yielding behaviour of a randomly oriented lamellar structure under multiaxial loading conditions, it is essential to analyse the yield loci as a function of both the load angle θ and the lamellar inclination angle φ. To achieve this, yield loci have been investigated for two sets of load angles on the (σ12) and (σ32) stress planes, considering systematic variation of lamellar orientations. For this analysis, the unit cell model of the two-phase lamellar PST-TiAl, as described in Section 3.2.1, was utilized. The CP parameters were determined from the validated PST-TiAl model, as listed in Table 1 and Table 2.

3.5.1. Yield Loci of PST-TiAl on (σ12) Stress Plane

For the lamellar PST-TiAl, the plane stress yield loci were plotted on the (σ12)-plane for lamellar orientations φ ranging from 0° to 90°. The loading angles θ varied between 0° and 360° across the (σ12)-plane.
In Figure 16, the instantaneous yield loci are presented for equivalent plastic strain values between εpq = 0.0002 and εpq = 0.002, using the base parameter set outlined in Table 3. The corresponding orientations and loading angles are depicted in Figure 6a. It is evident that the yield loci exhibit distinct characteristics depending on both the orientation φ and the loading angle θ.
At φ = 0°, the yield locus is narrow and elliptical (Figure 16a), with the major axis aligned along the load-path direction of θ = 45°. As the lamellar orientation shifts to φ = 15°, the yield surface shape transforms to a quasi-parallelogram (Figure 16b), with the major axis now aligned along the load-path direction of θ = 30°. At φ = 30°, the yield surface narrows further, resembling a narrow-width parallelogram (Figure 16c), with the major axis aligned along the load-path direction of θ = 15°. The φ = 45° lamellar orientation maintains a similar shape to the φ = 30° model (Figure 16d).
With further inclination of the lamellae to φ = 60°, 75°, and 90°, the yield surface width gradually increases, transforming from a parallelogram to rectangular and ultimately to elliptical shapes (Figure 16e–g). The major axis of the yield loci contour rotates from 15° to 30° and then to 75° as the load-path angles change.
This evolution of the yield loci indicates that for a hard orientation (φ = 0°), the loci contours maintain a narrow elliptical shape, while for soft orientations (φ = 15° to 75°), the shape transitions into a parallelogram or rectangular form. At the hard orientation of φ = 90°, the yield locus becomes more rounded and elliptical again, with its major axis aligned along the σ2 axis.
This analysis provides a clear understanding of the local variations in yield anisotropy of the oriented lamellar grains under biaxial loading on the (σ12)-plane. Additionally, applying biaxial loading on the (σ32)-plane allows for further evaluation of yield anisotropy, where the σ3 stress component remains parallel to the lamellar-plane normal.

3.5.2. Yield Loci of PST-TiAl on (σ32) Stress Plane

In this analysis, the load-path angle θ, spanning [0°, 360°], was rotated within the (σ32) plane. The yield loci corresponding to lamellar orientations, φ ∈ [0°, 90°] are plotted in Figure 17. These yield surface contours differ markedly from the previously shown yield contours on the (σ12) stress plane.
In the present case, for hard orientations at φ = 0° and φ = 90°, the yield loci contours are elliptical. For φ = 0°, the major axis aligns with the load angle θ = 15° (Figure 17a), while for φ = 90°, it aligns with the load angle θ = 75° (Figure 17g).
Conversely, for soft orientations at φ = 15° and φ = 75°, the yield loci contours follow a biased elliptical shape with sharp corners, with the major axis oriented along load-path angles of 30° and 60°, respectively (Figure 17b,f). For intermediate soft orientations, φ = 30–60°, the yield loci become narrow and hexagonal, with the major axis aligned along the 45° load path (Figure 17c–e).
The results indicate that when the loading axis shifts directionally, e.g., from the (σ12) to the (σ32) stress plane, the yield surface contours change remarkably. The observation also suggests that the onset of plasticity and the corresponding evolution of yield surfaces are directional stress dependent under multiaxial stresses.

3.6. Yield Stress Anisotropy Influenced by Lamellar Orientation and Biaxial Loading Angels

To assess the anisotropic yield response due to load-angle variations across the (σ12) and (σ32) orthogonal planes, the equivalent Mises yield stresses, σV, were evaluated for both the PST1 and PST2 models. This evaluation considered seven distinct lamellar orientations, φ ∈ [0°, 90°] in 15° increments, and 24 distinct load angles, θ ∈ [0°, 360°] in 15° increments. By connecting all yield points across the θ and φ spectra, two “wavy” curves were plotted, representing yield points calculated on the (σ12) and (σ32) stress planes. In Figure 18, these curves are denoted as PST1_σV12 and PST2_σV32, respectively.
While both the models showed slight variations in the lower and upper σV values, a notable shift in the wavy curve at lamellar orientation φ = 0° was observed for the PST2_σV32. As the lamellae orientation approached φ = 90°, the PST2_σV32 curve progressively aligned with the PST1_σV12 curve. This convergence in yield behaviour occurs as the lamellar orientation becomes perpendicular to the loading axis for both the models.
To analyse the variation of yield anisotropy in both the models, the curves were fitted with a Fourier series, providing a detailed assessment of anisotropic differences with respect to combined load-path and lamellar orientations. The general form of the Fourier series is given by:
f σ v = n = 1 a n c o s 2 π n σ v θ + b n s i n 2 π n σ v θ
The coefficients an and bn represent the even (symmetric) and odd (asymmetric) components of each harmonic waveform. In the present context, these coefficients describe the contribution of each harmonic (corresponding to specific angular load-path values) to the yield stress variation.
The fitted Fourier series curves, shown in Figure 18, closely match the wavy profile of the yield curves. Table 7 lists the cosine and sine coefficients for the first 10 harmonics for both models, the PST1_σV12 and PST2_σV32. The anisotropic characteristics of the two models can be distinguished by comparing these coefficient values, as outlined below:
The first harmonic represents the primary anisotropic behaviour. The Model PST2_σV32 has a notably larger a1 value (139.01 vs. 96.96), indicating a more pronounced overall variation in yield stress with orientation compared to the Model PST1_σV12. This result suggests that the PST2_σV32 exhibits a stronger fundamental anisotropy (i.e., more significant directional yield stress variation). Additionally, the Model PST1_σV12 has a negative b1 value, indicating some asymmetry in its yield stress distribution, whereas the PST2_σV32 has a small positive b1, implying a more symmetric anisotropy.
In the second harmonic, the Model PST2_σV32 again has bigger coefficients, suggesting more complex, higher-order variations in yield stress. The larger a2 and positive b2 values in the PST2_σV32 imply finer angular variation details in yield stress, contrasting with the Model PST1_σV12, where the negative b2 value reflects asymmetry. The relatively small positive b2 in the PST2_σV32 indicates, while this higher-order anisotropy is present, it remains symmetric.
For higher harmonics, the decreasing coefficient magnitudes indicate finer-scale anisotropy, representing more localized yield stress variations. In the Model PST1_σV12, harmonics 3 through 5 display relatively low an and bn values, suggesting that minor and simple anisotropy is present. From harmonic 6 onward, little fluctuations in an and bn coefficients indicate some localized features, although the higher harmonics remain overall weak.
In the Model PST2_σV32, the third harmonic yields minimal a3 and b3 values, suggesting negligible fine-scale anisotropy at this level. However, from harmonic 4 onward, more negative values (e.g., a5 = −9.68, b5 = −9.34) appear, revealing significant localized variations. These higher harmonics suggest that the anisotropy in the PST2_σV32 is more complex and less symmetric than in the PST1_σV12, especially at finer scales.
The analysis shows that the Model PST2_σV32 exhibits more pronounced anisotropy at both global (first harmonic) and local (higher harmonics) levels compared to the Model PST1_σV12. This implies that yield stress in the PST2_σV32 varies more drastically with orientation, indicating stronger anisotropic behaviour. In contrast, the Model PST1_σV12 exhibits greater asymmetry in yield stress variation, especially in lower harmonics (negative bn values), indicating directionally biased anisotropy. Conversely, the PST2_σV32 has smaller bn values overall, suggesting a more symmetric anisotropy with some localized asymmetry in higher harmonics.
Larger higher harmonic magnitudes in the Model PST2_σV32 further indicate more complex anisotropy patterns, whereas the PST1_σV12 shows less complexity and a more uniform anisotropic response.
Now, to generalize yield stress variations across the full lamellar orientation spectrum, trendlines were also plotted for both the models regarding the orthogonal planes, (σ12) and (σ32). These curves exhibit a U-shaped yield stress anisotropy relative to lamellar orientation, consistent with anisotropic responses observed under uniaxial loading (Figure 2). The trendlines also show that anisotropy is more pronounced in the PST2_σV32, where loading occurs on the (σ32) plane.

4. Summary and Conclusions

This work presents an in-depth analysis of plastic anisotropy in α2-Ti3Al and γ-TiAl single phases, as well as in two-phase (α2 + γ)-PST-TiAl alloys. By examining the hierarchical progression of plasticity from the phase level to the overall structure, this work provides critical insights into the anisotropic mechanical responses across the scales of a two-phase lamellar structure. Based on these comprehensive analyses, the following conclusions can be drawn:
  • The distinct anisotropic yield behaviour in PST-TiAl alloys is governed by the unique deformation mechanisms of α2-Ti3Al (hcp) and γ-TiAl (fcc) phases. The α2-phase exhibits pronounced anisotropy with narrow, hexagonal yield loci contours, while the γ-phase shows varying anisotropy resulting in elliptical yield loci contours. In the multi-phase PST-TiAl model, interactions between these phases generate more rounded hexagonal yield loci contours, demonstrating the crucial role of phase interactions in shaping the overall yield behaviour.
  • Slip-system activation plays a critical role in determining the yield loci under varying load-path angles. In γ-phases, the mechanisms like twinning and super dislocations dominate under certain stress states, influencing yield stress and plastic deformation. In contrast, the α2-phases are predominantly governed by prismatic and pyramidal slips. The relationships between slip-system activities and yield loci contour shapes illustrate how crystallographic orientations and stress conditions govern the mechanical response under complex loading scenarios.
  • Co-deformation constraints in multi-phase PST-TiAl alloys restrict slip evolutions in the embedded phases compared to the single-phase conditions. Interactions among neighbouring phases vary consequently upon lamellar orientations. These constraints, together with microstructural alignments, play crucial roles in shaping the anisotropic stress responses and yield loci evolution.
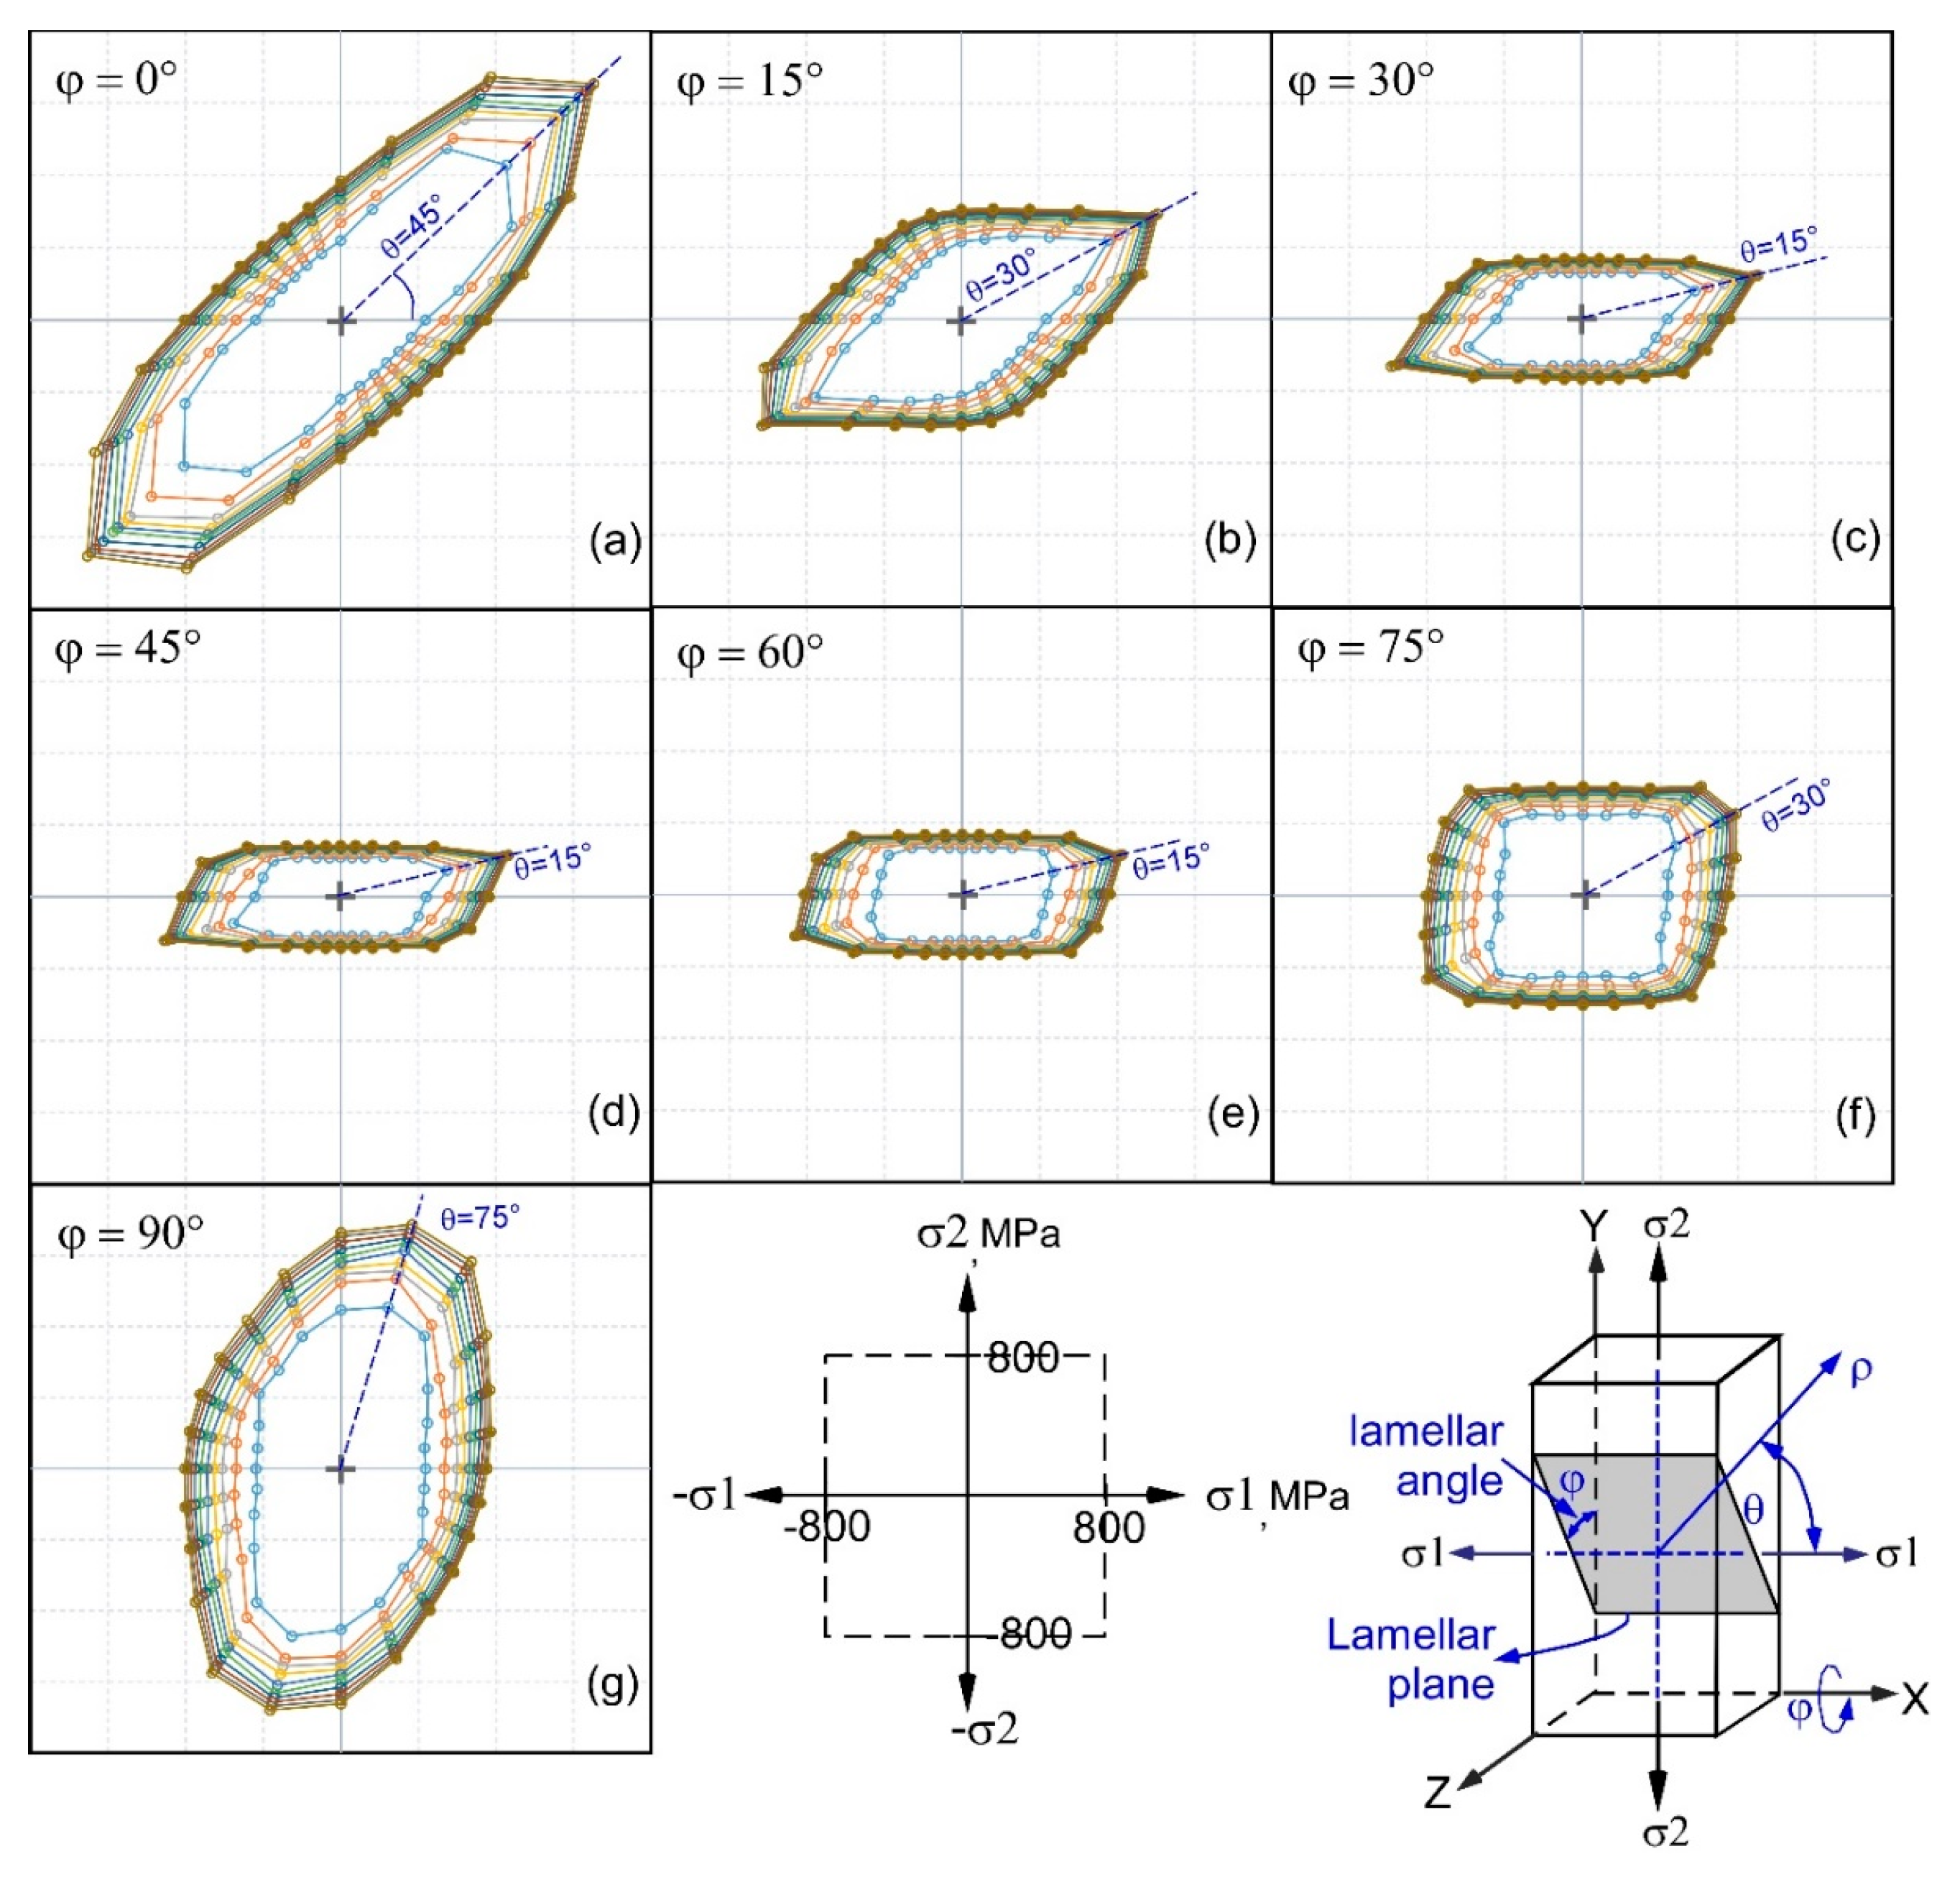
  • Depending on lamellar orientation, φ, the shape of the yield loci contours varies from ellipses to parallelograms or hexagons. The major axes of the yield loci also rotate substantially. Additionally, the lamellar boundary angles introduce structural anisotropy that interacts with the phase-specific anisotropy. This interplay between microstructure and crystallography controls the overall anisotropic response.
  • Systematic changes in load-path angles within the (σ12) and (σ32) stress planes result in corresponding shifts in yield loci contour width and shape, driven by the activation of different slip systems. Changes in loading direction alter the stress ratio, causing the yield loci to vary across stress planes, with elliptical to parallelogram yield loci contour shapes emerging in the (σ12) plane and ellipses transitioning to hexagons in the (σ32) plane. The Fourier series fitting of equivalent Mises stress curves further elucidates the sensitivity of effective Mises stress to loading direction and stress ratios.
It is important to note that the accuracy of the predictions may depend on the assumptions made in the RVE-based unit cell and the selection of the CPFE model. However, since the presented models use validated parameters that have been calibrated for the anisotropic yield behaviour of PST-TiAl alloys within a classical CPFE framework, substantial improvements in prediction accuracy are unlikely.

Author Contributions

M.R.K.: Conceptualization, Methodology, Investigation, Analysis, Visualization, Writing—Preliminary draft, review, editing; M.B.M.: Data curation, Formal analysis, Investigation, Validation, Visualization, Software, Writing—review, editing. All authors have read and agreed to the published version of the manuscript.

Funding

This research received no external funding.

Data Availability Statement

The original contributions presented in this study are included in the article. Further inquiries can be directed to the corresponding author.

Acknowledgments

The authors thank M. Bartsch for valuable comments and suggestions. The authors acknowledge financial support from the German Aerospace Center, Institute of Materials Research. No additional funding was allocated for this work.

Conflicts of Interest

The authors declare that they have no known competing financial interests or personal relationships that could have appeared to influence the work reported in this paper.

References

  1. Appel, F.; Brossmann, U.; Christoph, U.; Eggert, S.; Janschek, P.; Lorenz, U.; Müllauer, J.; Oehring, M.; Pauli, J.D.H. Recent Progress in the Development of Gamma Titanium Aluminide Alloys. Adv. Eng. Mater. 2000, 2, 699–720. [Google Scholar] [CrossRef]
  2. Wallgram, W.; Schmölzer, T.; Cha, L.; Das, G.; Güther, V.; Clemens, H. Technology and mechanical properties of advanced γ-TiAl based alloys. Int. J. Mater. Res. 2009, 100, 1021–1030. [Google Scholar] [CrossRef]
  3. Dzogbewu, T.C.; du Preez, W.B. Additive Manufacturing of Ti-Based Intermetallic Alloys: A Review and Conceptualization of a Next-Generation Machine. Materials 2021, 14, 4317. [Google Scholar] [CrossRef] [PubMed]
  4. Wimler, D.; Lindemann, J.; Reith, M.; Kirchner, A.; Allen, M.; Vargas, W.G.; Franke, M.; Klöden, B.; Weißgärber, T.; Güther, V.; et al. Designing advanced intermetallic titanium aluminide alloys for additive manufacturing. Intermetallics 2021, 131, 107109. [Google Scholar] [CrossRef]
  5. Lin, B.C.; Chen, W. Mechanical properties of TiAl fabricated by electron beam melting—A review. China Foundry 2021, 18, 307–316. [Google Scholar] [CrossRef]
  6. Kishida, K.; Inui, H.; Yamaguchi, M. Deformation of lamellar structure in TiAl-Ti3Al two-phase alloys. Philos. Mag. A 1998, 78, 1–28. [Google Scholar] [CrossRef]
  7. Inui, H.; Oh, M.H.; Nakamura, A.; Yamaguchi, M. Room-temperature tensile deformation of polysyn-thetically twinned (PST) crystals of TiAl. Acta Metall. Mater. 1992, 40, 3095–3104. [Google Scholar] [CrossRef]
  8. Umakoshi, Y.; Nakano, T.; Yamane, T. The effect of orientation and lamellar structure on the plastic behavior of TiAl crystals. Mater. Sci. Eng. A 1992, 152, 81–88. [Google Scholar] [CrossRef]
  9. Hazzledine, P.M.; Kad, B.K. Yield and fracture of lamellar γα2 TiAl alloys. Mater. Sci. Eng. A 1995, 192–193, 340–346. [Google Scholar] [CrossRef]
  10. Zghal, S.; Naka, S.; Couret, A. Quantitative TEM Analysis of the Lamellar Microstructure in TiAl Based Alloys. Acta Mater. 1997, 45, 3005–3015. [Google Scholar] [CrossRef]
  11. Parthasarathy, T.A.; Mendiratta, M.G.; Dimiduk, D.M. Flow behavior of PST and fully lamellar poly-crystals of Ti–48Al in the microstrain regime. Acta Mater. 1998, 46, 4005–4016. [Google Scholar] [CrossRef]
  12. Kempf, M.; Göken, M.; Vehoff, H. The mechanical properties of different lamellae and domains in PST-TiAl investigated with nanoindentations and atomic force microscopy. Mater. Sci. Eng. A 2002, 329–331, 184–189. [Google Scholar] [CrossRef]
  13. Chen, L.; James Edwards, T.E.; Di Gioacchino, F.; Clegg, W.J.; Dunne, F.P.E.; Pham, M.-S. Crystal plasticity analysis of deformation anisotropy of lamellar TiAl alloy: 3D microstructure-based modelling and in-situ micro-compression. Int. J. Plast. 2019, 119, 344–360. [Google Scholar] [CrossRef]
  14. Lebensohn, R.; Uhlenhut, H.; Hartig, C.; Mecking, H. Plastic flow of γ-TiAl-based polysynthetically twinned crystals: Micromechanical modeling and experimental validation. Acta Mater. 1998, 46, 4701–4709. [Google Scholar] [CrossRef]
  15. Marketz, W.T.; Fischer, F.D.; Clemens, H. Deformation mechanisms in TiAl intermetallics-Experiments and modelling. Int. J. Plast. 2003, 19, 281–321. [Google Scholar] [CrossRef]
  16. Zambaldi, C.; Raabe, D. Crystal plasticity modelling and experiments for deriving microstruc-ture-property relationships in γ-TiAl based alloys. J. Phys. Conf. Ser. 2010, 240, 012140. [Google Scholar] [CrossRef]
  17. Werwer, M.; Cornec, A. Numerical simulation of plastic deformation and fracture in polysynthetically twinned (PST) crystals of TiAl. Comput. Mater. Sci. 2000, 19, 97–107. [Google Scholar] [CrossRef]
  18. Whang, S.H.; Feng, Q.; Wang, Z.-M. Deformation characteristics and dislocation structures in single phase gamma titanium aluminides. Intermetallics 2000, 8, 531–537. [Google Scholar] [CrossRef]
  19. Minonishi, Y. Plastic deformation of single crystals of Ti3Al with D019 structure. Philos. Mag. A 1991, 63, 1085–1093. [Google Scholar] [CrossRef]
  20. Lu, L.; Pope, D.P. Slip and twinning in TiAl PST crystals. Mater. Sci. Eng. A 1997, 239–240, 126–130. [Google Scholar] [CrossRef]
  21. Mine, Y.; Fujisaki, H.; Matsuda, M.; Takeyama, M.; Takashima, K. Microtension behaviour of TiAl polysynthetically twinned crystals with 0°- and 90°-oriented lamellae. Scr. Mater. 2011, 65, 707–710. [Google Scholar] [CrossRef]
  22. Jin, Z.; Gray, G.T. Experimental determination of domain orientations and domain orientation rela-tionships across lamellar interfaces in polysynthetically twinned TiAl crystals. Mater. Sci. Eng. A 1997, 231, 62–71. [Google Scholar] [CrossRef]
  23. Zhao, W.; Liao, H.; Lun, Y.; Zhang, S.; Song, B. Role of interfaces in the deformation behavior of la-mellar TiAl-based alloys with CPFEM simulation. Mater. Today Commun. 2022, 32, 103942. [Google Scholar] [CrossRef]
  24. Liu, C.T.; Schneibel, J.H.; Maziasz, P.J.; Wright, J.L.; Easton, D.S. Tensile properties and fracture toughness of TiAl alloys with controlled microstructures. Intermetallics 1996, 4, 429–440. [Google Scholar] [CrossRef]
  25. Bolz, S.; Oehring, M.; Lindemann, J.; Pyczak, F.; Paul, J.; Stark, A.; Lippmann, T.; Schrüfer, S.; Roth-Fagaraseanu, D.; Schreyer, A.; et al. Microstructure and mechanical properties of a forged β-solidifying γ TiAl alloy in different heat treatment conditions. Intermetallics 2015, 58, 71–83. [Google Scholar] [CrossRef]
  26. Kabir, M.R.; Bartsch, M.; Chernova, L.; Kelm, K.; Wischek, J. Correlations between microstructure and room temperature tensile behavior of a duplex TNB alloy for systematically heat treated samples. Mater. Sci. Eng. A 2015, 635, 13–22. [Google Scholar] [CrossRef]
  27. Luster, J.; Morris, M.A. Compatibility of deformation in two-phase Ti-Al alloys: Dependence on mi-crostructure and orientation relationships. Metall. Mater. Trans. A 1995, 26, 1745–1756. [Google Scholar] [CrossRef]
  28. Paidar, V.; Imamura, D.; Inui, H.; Yamaguchi, M. Plastic deformation of bicrystals composed of poly-synthetically twinned TiAl crystals. Acta Mater. 2001, 49, 1009–1019. [Google Scholar] [CrossRef]
  29. Schmitt, J.H.; Aernoudt, E.; Baudelet, B. Yield Loci for Polycrystalline Metals without Texture. Mater. Sci. Eng. 1985, 75, 13–20. [Google Scholar] [CrossRef]
  30. Gawad, J.; Banabic, D.; Van Bael, A.; Comsa, D.S.; Gologanu, M.; Eyckens, P.; Van Houtte, P.; Roose, D. An evolving plane stress yield criterion based on crystal plasticity virtual experiments. Int. J. Plast. 2015, 75, 141–169. [Google Scholar] [CrossRef]
  31. Vajragupta, N.; Ahmed, S.; Boeff, M.; Ma, A.; Hartmaier, A. Micromechanical modeling approach to derive the yield surface for BCC and FCC steels using statistically informed microstructure models and nonlocal crystal plasticity. Phys. Mesomech. 2017, 20, 343–352. [Google Scholar] [CrossRef]
  32. Graff, S.; Brocks, W.; Steglich, D. Yielding of magnesium: From single crystal to polycrystalline aggregates. Int. J. Plast. 2007, 23, 1957–1978. [Google Scholar] [CrossRef]
  33. Schlögl, S.M.; Fischer, F.D. Numerical simulation of yield loci for PST crystals of TiAl. Mater. Sci. Eng. A 1997, 239–240, 790–803. [Google Scholar] [CrossRef]
  34. Fujiwara, T.; Nakamura, A.; Hosomi, M.; Nishitani, S.R.; Shirai, Y.; Yamaguchi, M. Deformation of polysynthetically twinned crystals of TiAl with a nearly stoichiometric composition. Philos. Mag. A 1990, 61, 591–606. [Google Scholar] [CrossRef]
  35. Blackburn, M.J. Some Aspects of Phase Transformations in Titanium Alloys, the Science, Technology, and Application of Titanium; Jaffee, R.I., Ed.; Oxford Pergamon Press Ltd.: Oxford, UK, 1970; pp. 633–643. [Google Scholar] [CrossRef]
  36. Kim, H.Y.; Maruyama, K. Stability of lamellar microstructure of hard orientated PST crystal of TiAl alloy. Acta Mater. 2003, 51, 2191–2204. [Google Scholar] [CrossRef]
  37. Uhlenhut, H. Ursachen Plastischer Anisotropie von γ-TiAl Basislegierungen. Ph.D. Thesis, Technische Universität Hamburg, Harburg, Germany, 1999. [Google Scholar]
  38. Jeong, B.; Kim, J.; Lee, T.; Kim, S.-W.; Ryu, S. Systematic investigation of the deformation mecha-nisms of a γ-TiAl single crystal. Sci. Rep. 2018, 8, 15200. [Google Scholar] [CrossRef] [PubMed]
  39. Peirce, D.; Asaro, R.J.; Needleman, A. Material rate dependence and localized deformation in crystalline solids. Acta Metall. 1983, 31, 1951–1976. [Google Scholar] [CrossRef]
  40. Huang, Y. A User-Material Subroutine Incorporating Single Crystal Plasticity in the Abaqus Finite Element Program; Report MECH-178; Division of Applied Science; Harvard University: Cambridge, MA, USA, 1991. [Google Scholar]
  41. Kad, B.M.; Dao, M.; Asaro, R.J. Numerical simulations of stress-strain behavior in two-phase α2 + γ lamellar TiAl alloys. Mater. Sci. Eng. A 1995, 192–193, 97–103. [Google Scholar] [CrossRef]
  42. Grujicic, M.; Cao, G.; Joseph, P.F. Multiscale Modeling of Deformation and Fracture of Polycrystalline Lamellar γ-TiAl + α2-Ti3Al Alloys. Int. J. Multiscale Comput. Eng. 2003, 1, 1–22. [Google Scholar] [CrossRef]
  43. Werwer, M.; Cornec, A. The role of superdislocations for modeling plastic deformation of lamellar TiAl. Int. J. Plast. 2006, 22, 1683–1698. [Google Scholar] [CrossRef]
  44. Cornec, A.; Kabir, M.R.; Huber, N. Numerical prediction of the stress–strain response of a lamellar γTiAl polycrystal using a two-scale modelling approach. Mater. Sci. Eng. A 2015, 620, 273–285. [Google Scholar] [CrossRef]
  45. Yoo, M.H.; Zou, J.; Fu, C.L. Mechanistic modeling of deformation and fracture behavior in TiAl and Ti3Al. Mater. Sci. Eng. A 1995, 192/193, 14–23. [Google Scholar] [CrossRef]
  46. Gulivindala, G.; Mothukuru, R.K.; Karanam, M.; Tse, K.M.; Chinthapenta, V. Yield locus of FCC single crystal for biaxial loading. Mater. Today Proc. 2024, 108, 135–140. [Google Scholar] [CrossRef]
  47. Wellerdick-Wojtasik, N. Micromechanical modelling of yield loci. Comput. Mater. Sci. 1999, 16, 113–119. [Google Scholar] [CrossRef]
  48. Tomé, C.; Kocks, U.F. The yield surface of h.c.p. crystals. Acta Metall. 1985, 33, 603–621. [Google Scholar] [CrossRef]
Figure 1. Crystal structures and slip systems of (a) α2-Ti3Al phase and (b) γ-TiAl phase, (c) SEM image of lamellar structure in a PST-TiAl alloy, consisting of α2-Ti3Al phase, γ-matrix, and γ-twin phases, adapted from [26], 2015, Elsevier, (d) domain structures in a γ-lamellae, adapted from [36], 2003, Elsevier.
Metals 15 00132 g001
Figure 2. Experimentally obtained yield anisotropy in different PST-TiAl with respect to lamellar orientation from the work of Inui, adapted from [7] 1992, Elsevier, [34], 1990, Taylor&Francis, [37], 1999, Technische Universität Hamburg.
Metals 15 00132 g002
Figure 3. Slip systems in γ-TiAl and α2-Ti3Al phases, grouped according to three deformation modes, adapted from [14], 2003, Elsevier.
Metals 15 00132 g003
Figure 4. (a) Idealized two-phase lamellar microstructure, (b) A unit cell consisting of seven RVEs representing a two-phase lamellar microstructure.
Metals 15 00132 g004
Figure 5. (a) Periodic boundary conditions defined at the outer surface of the unit cell, (b) 2D schematic of yield loci under biaxial loading for θ ∈ [0°, 360°] load-path angle.
Metals 15 00132 g005
Figure 6. Lamellar orientation and slip directions with respect to the load-path angle, θ (a) for loading on (σ12)-plane and, (b) for loading on (σ32)-plane.
Metals 15 00132 g006
Figure 7. The yield loci behaviour of γ-TiAl-single phase, showing the anisotropic yield surfaces due to different operative slip system activations related to different deformation modes (a) Yield surface from the Model-γA with base parameter study, (b) from the Model-γB with longitudinal parameter-set variation, (c) from the Model-γC with mixed parameter-set variation, and (d) from the Model-γD with transverse parameter-set variation.
Metals 15 00132 g007
Figure 8. The yield loci behaviour of α2-Ti3Al showing the influence of deformation modes on the yield anisotropy due to slip strength parameter variation (a) for the Model-α2A with base parameters, (b) for the Model-α2B with basal parameters, (c) for the Model-α2C with prismatic parameters, and (d) for the Model-α2D with pyramidal parameters.
Metals 15 00132 g008
Figure 9. Anisotropic nature of the equivalent Mises yield stress with respect to load-path angle variations from 0–360° over the Q1 to Q4 quadrants of the (σ12) stress-plane. Corresponding equivalent plastic strain is εpq = 0.001. The curves for Model-γA and Model-γB are overlapping.
Metals 15 00132 g009
Figure 10. Anisotropic nature of the equivalent Mises yield stress with respect to load-path angle, at an equivalent plastic strain of 0.001. The curves for Model-α2A and Model-α2B are overlapping.
Metals 15 00132 g010
Figure 11. Evolution of slips for models γC and γD in terms of relative slip activity under applied stress for load-angles, θ = 0°, 30°, 45°, 60°, 90°, shown in (ae) respectively. Transition of slips are shown within the stress zone, 400–600 MPa.
Metals 15 00132 g011
Figure 12. Relative activity of slip systems of α2-Ti3Al phase for distinct deformation modes. Plots show the relative activity with respect to the load orientations: θ = 0°, 30°, 45°, 60°, 90°, shown in (ae), respectively.
Metals 15 00132 g012
Figure 13. Yield surface representation of bulk α2-Ti3Al and γ-TiAl phases, and of their combined multi-phase PST-TiAl lamellar structure, named the model PST1 and PST2. Single γ-phase yield surfaces are shown in (a,c), for single α2-phase in (b), and for two-phase PST in (d,e).
Metals 15 00132 g013
Figure 14. Evolution of slips in the embedded γ-phases in the PST1 and PST2 model under local deformation constraints from neighbouring phases. Relative slip activities for active slip systems are plotted in (ae) with respect to the load orientations: θ = 0°, 30°, 45°, 60°, 90°.
Metals 15 00132 g014
Figure 15. Evolution of slips in the embedded α2-phases in the PST1 and PST2 model under local deformation constraints from neighbouring phases. Relative slip activities for active slip systems are plotted in (ae) with respect to the load orientations: θ = 0°, 30°, 45°, 60°, 90°.
Metals 15 00132 g015
Figure 16. Yield loci evolution on (σ12)-plane with respect to lamellar orientation and load-path angle. The yield surfaces for the lamellar orientations: φ = 0°, 15°, 30°, 45°, 60°, 75°, 90° are shown in (ag), respectively.
Metals 15 00132 g016
Figure 17. Yield loci evolution on (σ32)-plane with respect to lamellar orientation and load-path angles. The yield surfaces for the lamellar orientations: φ = 0°, 15°, 30°, 45°, 60°, 75°, 90° are shown in (ag), respectively.
Metals 15 00132 g017
Figure 18. Anisotropic yield behaviour of lamellar PST-TiAl with respect to 24 load angles, θ = 0–360°, with 15° increments, and seven lamellar orientations, φ = 0–90°, with 15° increments.
Metals 15 00132 g018
Table 1. Theorical estimation of elastic constants, Cij (GPa) of γ-TiAl and α2-Ti3Al crystals.
γ-TiAl
C11C33C12C23C44C66
1901851059012050
α2-Ti3Al
C11C33C12C31C44C66
22123871856969
Table 2. Estimated CP parameters for TiAl phases validated from PST-TiAl alloy behaviour.
Longitudinal-Mode SlipsMixed-Mode SlipsTransversal-Mode Slips
γ-TiAl
OrdinarySuperTwinOrdinarySuperOrdinarySuperTwin
Slip strength g0, MPa45904585170150300150
Hardening h0, MPa310350180
α2-Ti3Al
BasalPrismaticPyramidal
Slip strength g0, MPa330100910
Hardening h0, MPa150150150
Table 3. CP parameter set for γ-TiAl.
Parameter SetModel NameLongitudinal-Mode SlipsMixed-Mode SlipsTransversal-Mode Slips
OrdinarySuperTwinOrdinarySuperOrdinarySuperTwin
g0, MPag0, MPag0, MPag0, MPag0, MPag0, MPag0, MPag0, MPa
BaseModel-γA45904585170150300150
LongitudinalModel-γB601206085170150300150
MixedModel-γC459045200400150300150
TransversalModel-γD45904585170225440225
Table 4. CP parameter set for α2-Ti3Al.
Parameter setModel NameLongitudinal-Mode SlipsMixed-Mode SlipsTransversal-Mode Slips
BasalPrismaticPyramidal
g, MPag, MPag, MPa
BaseModel-α2A5075150
BasalModel-α2B10075150
PrismaticModel-α2C50100150
PyramidalModel-α2D5075200
Table 5. Most active slip systems in γ-phase (in bulk and embedded conditions) with respect to the load-path angle and applied stress level.
Model-γC/PST1
Bulk CrystalEmbedded CrystalBulk CrystalEmbedded Crystal
θApplied Load < 400 MPaApplied Load < 400 MPaApplied Load > 600 MPaApplied Load > 600 MPa
0Twin (Trans)Twin (Trans)Sup (Trans)Sup (Mix) + Ord (Trans)
30Twin (Trans)Twin (Trans) + Ord (Trans)Sup (Trans) + Ord (Trans)Twin (Trans)
45Twin (Long)Ord (Trans)Ord (Trans)Ord (Trans)
60Twin (Long) + Ord (Trans)Ord (Trans)Ord (Trans)Ord (Trans)
90Twin (Long) + Ord (Trans)Ord (Trans)Ord (Trans) + Sup (Long)Ord (Trans) + Sup (mix)
Model-γD/PST2
Bulk CrystalEmbedded CrystalBulk CrystalEmbedded Crystal
θApplied Load < 400 MPaApplied Load < 400 MPaApplied Load > 600 MPaApplied Load > 600 MPa
0Sup (Mix) + Twin (Trans)Sup (Mix) + Twin (Trans)Sup (Mix) + Sup (Long)Sup (Mix)
30Twin (Long) + Twin (Trans)Twin (Trans) + Ord (Trans)Sup (Mix)Twin (Tans)
45Twin (Long)Ord (Trans)Ord (Trans) + Sup (Long)Ord (Trans)
60Twin (Long)Sup (Mix) + Ord (trans)Ord (Trans) + Sup (Long)Sup (Mix) + Ord (trans)
90Sup (Mix)+ Twin (Long)Sup (Mix)Sup (Mix) + Sup (Long)Sup (Mix)
Table 6. Most active slip systems in α2 phase (in bulk and embedded conditions) with respect to the load-path angle and applied stress level.
Model-α2C/PST1
Free CrystalEmbedded CrystalFree CrystalEmbedded Crystal
θApplied Load < 400 MPaApplied Load < 400 MPaApplied Load > 600 MPaApplied Load > 600 MPa
0PrismaticPrismaticPrismaticPrismatic + Pyramidal
30PrismaticPrismatic + PyramidalPyramidalPyramidal + Prismatic
45PyramidalPyramidalPyramidalPyramidal
60PrismaticPrismatic + PyramidalPyramidalPyramidal
90PrismaticPrismaticPrismaticPyramidal
Model-α2D/PST2
Free CrystalEmbedded CrystalFree CrystalEmbedded Crystal
θApplied Load < 400 MPaApplied Load < 400 MPaApplied Load > 600 MPaApplied Load > 600 MPa
0PrismaticPrismaticPrismaticPrismatic
30Prismatic + PyramidalPrismatic + PyramidalPyramidalPyramidal + Prismatic
45PyramidalPyramidalPyramidalPyramidal
60Prismatic + PyramidalPrismatic + PyramidalPyramidalPyramidal + Prismatic
90PrismaticPrismaticPrismaticPrismatic
Table 7. Cosine and sine coefficients for the first 10 harmonics of the Fourier series fitted yield curves form the models, PST1_σV12 and PST2_σV32.
PST1_σV12PST2_σV32
Harmonicsanbnanbn
196.964542−14.248266139.0082593.504769
214.363645−13.09878724.9727084.822557
32.440508−8.1237270.7278830.342684
45.571881−6.857440−1.450206−4.678004
50.775485−3.635532−9.675343−9.335495
6−18.6092843.048943−21.073787−7.589412
7−1.3081820.0258841.2139723.166239
813.580293−5.56482919.0980352.423240
99.548064−9.4131255.7603391.961615
106.297542−8.787289−1.709833−7.526640
Disclaimer/Publisher’s Note: The statements, opinions and data contained in all publications are solely those of the individual author(s) and contributor(s) and not of MDPI and/or the editor(s). MDPI and/or the editor(s) disclaim responsibility for any injury to people or property resulting from any ideas, methods, instructions or products referred to in the content.

