1. Introduction
In recent years, operators of European distribution systems (DSOs) have observed a rapid increase in PV (photovoltaic) micro-installations connections (
Figure 1) [
1,
2,
3,
4], which was caused, among others, by numerous support programs, e.g., for Poland [
4], a preferential method of energy billing in the form of a discount mechanism, rapidly rising electricity prices [
5,
6] and the necessity of a reduction in greenhouse gas emissions included in EU (European Union) policies for climate protection [
7]. The great interest in PV micro-installations means that more and more manufacturers and distributors of PV inverters are appearing on the market, which is integral and, at the same time, the most expensive element of each PV micro-installation. The correct operation of PV micro-installations, and their impact on the power system and the distribution network at the connection point, depend primarily on the quality of the PV inverter and its correct operation according to the documents regulating the operation of micro-installations in the distribution system [
8,
9,
10].
As an example, in Poland, the legal requirement for connecting the PV micro-installation to the distribution network is to deliver to the local DSO a document confirming that the PV inverter, which is equipped in the installation, meets the requirements set out in the NC RfG (network code for all generators) network code. The list of PV inverters that have been positively verified is published and is constantly updated by Polish DSOs.
Comparing the requirements for PV inverters, it can be concluded that requirements specified by local DSOs [
10] go far beyond the provisions of the network code NC RfG, because these documents contain many more requirements for the operation of micro-installations in the distribution network, including active and reactive power regulation, immunity to voltage events, or unintentional islanding operation detection. NC RfG network code for type A power generation modules focuses mainly on the requirements that are desired by the transmission system operator (TSO), which ensures the proper operation of the transmission system with a high concentration of generation sources. While local distribution system operators (DSOs) nowadays are struggling with the effects of integrating renewables into the grid [
11,
12,
13,
14]. A comparison of the scopes of requirements specified in documents [
8,
9,
10] is presented in
Table 1.
As a result, tests of PV inverters performed by accredited laboratories cover a relatively limited scope of functionality resulting only from the NC RfG network code which, as justified above, does not exhaust the real expectations of the DSOs.
There are several publications in the literature devoted to research on prosumer photovoltaic inverters. In [
15] the compliance of PV microinverters with grid interaction, focusing on technical requirements to facilitate higher PV penetration and improved prosumer economics was explored. Moreover, a review of the technical requirements for plug-and-play PV microinverters in the United States, emphasizing the need for standardized specifications to facilitate higher PV penetration and improve economic outcomes for prosumers was provided. This study highlights the essential technical and safety standards that microinverters must meet to ensure effective grid integration. The authors of paper [
16] discuss the compliance of inverter-interfaced renewable energy sources with the Electric Reliability Council of Texas Grid Code (ERCOT-GC), emphasizing the importance of fault ride-through capabilities for grid resilience. Their work underscores the critical role of UVRT in maintaining grid stability and compliance during electrical disturbances, which is crucial for grid resilience and regulatory adherence. Paper [
17] investigates the Brazilian PV industry, focusing on the compliance of grid-connected inverters and other PV equipment with interconnection codes and certification requirements. This study provides insights into how national regulations impact the deployment and performance of PV inverters and other PV equipment in emerging markets. A comprehensive review of grid-connected PV inverters, focusing on grid codes, inverter topologies, and control techniques for standard compliance and efficient circuit implementation is presented in [
18]. This work provides a detailed analysis of how various inverter designs and control strategies align with grid standards to ensure efficient and compliant operation.
In [
19], the study developed a methodology for defining an overall efficiency index for PV inverters by weighing both static and dynamic efficiency using high-frequency irradiance data. Experimental results with three PV inverters showed that dynamic testing is crucial for identifying inverters with low dynamic performance, impacting overall efficiency. This index is significant for comparing different PV inverters and enhancing simulation accuracy in PV system design. The authors of [
20,
21] explored the limitations of using measurement-based small-signal stability analysis to assess the harmonic stability of single-phase PV inverters. By analyzing inverters under both sinusoidal and distorted background voltages, the research demonstrated that while the Nyquist-based impedance stability criterion can confirm unstable operation, it fails to ensure stable operation. The introduction of typical voltage distortions in public LV networks caused some inverters to shut down, highlighting that harmonic stability analysis, though relevant, does not comprehensively cover immunity assessment in the harmonic frequency range.
This paper is structured to provide a comprehensive examination of the subject matter. It begins with an outline of the research objectives and goals, specifically focusing on the aspects of PV inverters under study, which are detailed in
Section 2.
Section 3 describes the experimental platform setup, including the equipment used, the configuration of the test platform, and the PV inverters tested. Following this,
Section 4 outlines the experimental procedures, detailing the steps taken to collect data and the conditions of the tests. This section also presents an analysis of the obtained results, offering insights into the performance of the inverters. The paper concludes with a summary of the key findings in
Section 5, highlighting the main conclusions. Future research directions are presented in
Section 6.
2. Scope of Conducted Research
The aim of the presented study was to conduct laboratory comparative tests of widely available on the European market PV inverters from various manufacturers. Tests were conducted for compliance with the requirements set out in the NC RfG network code, PN-EN 50549-1:2019, and Polish DSOs’ internal regulations. The research experiment was performed in 2021 and was co-organized by the AGH University of Science and Technology in Krakow and Tauron Dystrybucja S.A. All tested PV inverters were received directly from their manufacturers or local distributors.
The scope of the laboratory tests included correctness verification of:
The response of PV inverters to changes in the frequency of the supply voltage in accordance with the limited frequency sensitive mode—overfrequency (LFSM-O).
The reactive power control modes including Q = f (U) and its behavior with asymmetric AC voltages.
The power factor and current total harmonic distortion indicator (THDI).
Under-voltage ride-through (UVRT) immunity.
2.1. Active Power Response to Overfrequency
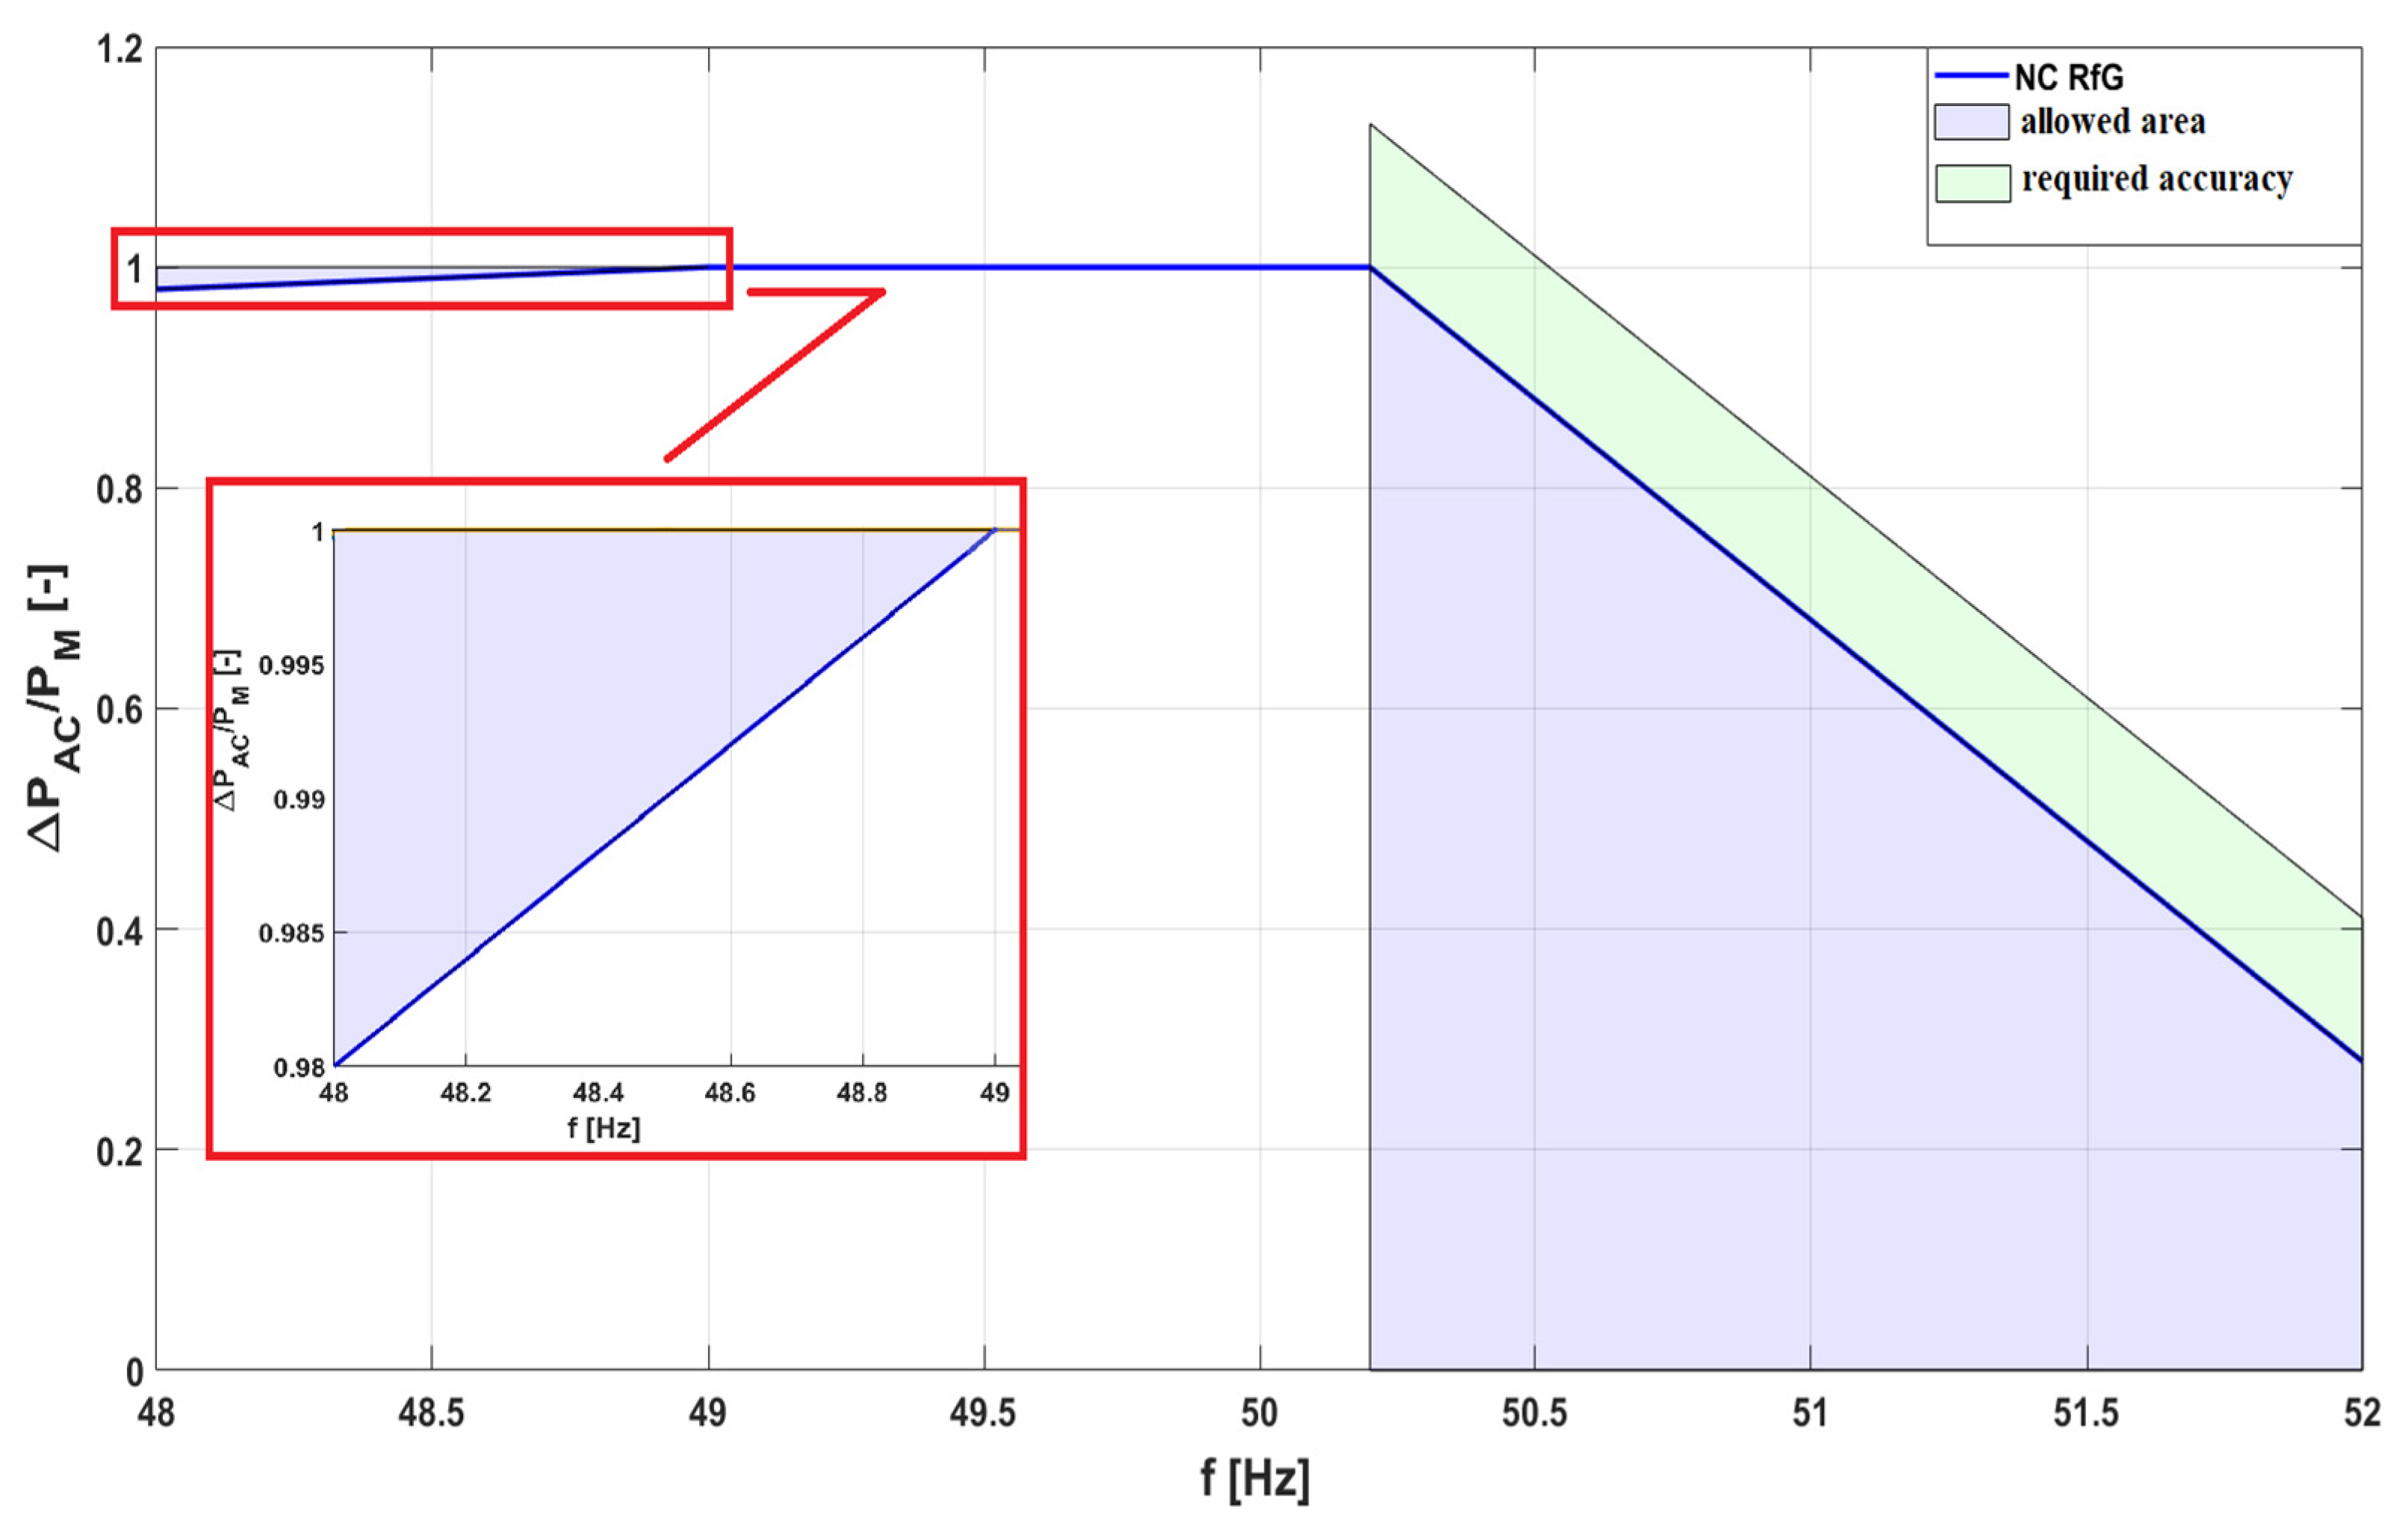
Figure 2 presents the required P(f) characteristic, as presented in the standard EN 50549-1:2019, with the allowed operation area marked in purple. This standard also defines the acceptable accuracy of active power reduction which is ±10% of the inverter-rated active power (applicable only for frequencies above 50.2 Hz). The area defined by this accuracy is marked in green. In
Figure 2 the following symbols are given: P
AC—active power at the output of the power generating module [W], P
M—active power generated at a frequency of 50.2 Hz, i.e., at the LFSM-O mode activation threshold (reduction of active power due to frequency increase).
This mode of operation, abbreviated as LFSM-O, requires active power output reduction in response to an increase in the system frequency above a certain value. PV inverters shall be capable of activating:
Active power response to overfrequency at a programmable frequency threshold above 50.2 Hz and to 52 Hz.
A programmable active power droop shall be in the range of at least 2–12% (default value s = 2%).
The authors of the article would like to point out that for the LFMS-O mode, requirements in the standard 50549-1:2019 are inconsistent with the NC RfG network code. According to the network code NC RfG, P
ref for the Power Park Modules (PPM) is equal to the actual active power P
M at the moment the LFSM-O threshold is reached or P
ref can be equal to the maximum capacity P
max of a PPM, as defined by the relevant TSO. In turn, for the PPM in the standard 50549-1:2019, P
ref is equal only to P
M. In this situation, when a TSO of one of the Member States in the EU defines that for the PPM P
ref = P
max, PV inverters cannot meet the standard 50549-1:2019 requirement. This situation applies to Poland where Polish TSO is defined for the PPM P
ref = P
max. This inconsistency also causes those PV inverter manufacturers or distributors to set LFSM-O parameters according to the standard 50549-1:2019 not to the specific requirement defined by the Member State’s TSO.
Figure 3 presents the differences in the P(f) characteristic drawn according to the standard 50549-1:2019 and the network code NC RfG (P
ref = P
max). The characteristic for P
ref = P
max is valid only for the PV inverter parameters: P
M = 3.75 kW, P
max = 5.5 kW.
Figure 3 presents only the example of the LFSM-O mode maximum active power limit for P
ref = P
max. That is because this characteristic depends on the actual active power generated at the frequency of 50.2 Hz. Both characteristics are the same only when P
ref = P
M = P
max. If P
M < P
max then the LFSM-O mode characteristic for P
ref = P
max is always below the characteristic for P
ref = P
M. The lower is actual active power at a frequency of 50.2 Hz, the steepest is the characteristic for P
ref = P
max. It is different for the characteristic P
ref = P
M because the active power decrease gradient is constant, independent of the actual P
M.
2.2. Reactive Power Control
According to [
9,
10], PV inverters shall have the capability of managing reactive power in a wide range of normal operations. The area of permissible reactive power generation is presented in
Figure 4. The reactive power control shall be within the displacement power factor cosφ ranging from 0.9ue (under-excited) to 0.9oe (over-excited), while actual generating active power
P is greater or equal to 20% of the nominal PV inverter active power.
Moreover, PV inverters shall be capable of operating in four reactive power control modes:
Constant cosφ.
Constant reactive power.
cosφ as a function of generated active power.
Q(U) mode i.e., reactive power as a function of AC grid voltage.
In Q(U) mode, PV inverters shall respond to the RMS (root mean square) voltage changes and prevent them from exceeding RMS voltage over permissible limits for the low-voltage network [
9,
22].
Figure 5 presents the required Q(U) characteristic for 3-phase PV inverters, where Q—reactive power at the output of the power generating module [var], P
D—maximum active power at the output of the power generating module at the phase shift factor between the symmetrical components of the positive sequence of voltage and current cosφ = 0.9 W.
According to EN 50549-1:2019, the reactive power (both inductive and capacitive) should be supplied by the PV inverter with an accuracy of ±2% of the maximum apparent power of the inverter. This accuracy is five times more demanding than in the LFSM-O mode.
2.3. Under-Voltage Ride-Through Immunity
According to the standard [
9], type A power-generating modules should be capable of remaining connected to the distribution network if the network voltage remains above the curve presented in
Figure 6. Under-voltage ride-through capability recommendation for type A modules. After the voltage returns to normal conditions, 90% of pre-fault power (or available power whichever is the smallest) should be resumed as fast as possible, but not later than 1 s unless the DSO or responsible party requires another value.
Figure 6 presents both the default and the more stringent characteristics. After the voltage returns to normal conditions, 90% of pre-fault power (or available power whichever is the smallest) should be resumed as fast as possible, but not later than 1 s unless the DSO and responsible party require another value. The requirements apply to all kinds of faults (1 ph, 2 ph, and 3 ph).
Under-voltage ride-through (UVRT) requirements are defined in the EU network code NC RfG [
8] as recommended for type A. Nevertheless, UVRT is very often seen as an important requirement for type A generation sources, especially where the total power of PV generation systems connected to the grid becomes large. For these reasons, in the standard [
9] the UVRT functionalities for type A modules are not defined as requirements (shall) but as a recommendation (should).
3. Experimental Platform Setup and PV Inverters under Tests
The test stand was prepared at the Power Quality Laboratory at AGH University and was based on the technical report IEC TR 61000-3-15 [
23] specifying the methods of testing low-frequency electromagnetic compatibility for distributed generation systems, and other similar testing approaches presented in [
24,
25,
26,
27]. The block diagram of the test stand is shown in
Figure 7.
Each tested PV inverter (3) was supplied on the DC (direct current) side by the 18 kW PV array simulator ITECH IT6018B (2), which was a DC source with adjustable current–voltage I = f(U) characteristics corresponding to the operation of PV arrays. The AC (alternating current) side of the inverter was connected to the electrical network simulator Chroma 61815 (7)—a 15 kW regenerative programmable AC source 3 × 230 V, which allowed for adjusting the supply conditions at its output. Powers, voltages, and currents on both sides of the tested inverter were measured using the precise power analyzer Yokogawa WT5000 (4).
Figure 8 presents the example of the current–voltage characteristic from the PV array simulator and its simulated changes over time corresponding to different levels of insolation.
Table 2 presents the list of tested PV inverters with information about their nominal active power. All tested devices were made available for the purpose of this experiment by their manufacturers or local distributors. The following inverters were used in the tests: AC INV-1P-37, FoxESS F3600, GoodWe GW3000-XS, Afore Aton 6, BBECO BBE-5-PL1, FoxESS T5, Growatt MOD 3600TL, Fronius Symo GEN24 6.0, Huawei SUN2000-3KTL-L1, Goodwe GW6K-DT, Kostal PIKO MP Plus 3.0-2, Growatt MOD 6000TL3, Sofar Solar 2700TL-G3, Huawei SUN2000-5KTL-M1, SOLAX POWER X1 AIR, KACO 5.0 TL3, Solis-1P3.6K-4G, Kehua SPI6K-B, Solplanet ASW3000-S, Kostal Plenticore 5.5 3F, Sungrow SG2K5-S, Sermatec SMT-6K-TL-TH, TWERD PS100-PV, SMA STP6.0, SOLAX POWER X3 MIC, Solis-3P6K-4G, Solplanet ASW5000-T, Sungrow SG2KTL-MT3, TWERD PS3000-PV.
The target equipment for the tests were PV inverters that are commonly installed by individual prosumers, i.e., with rated powers ca. 3.5 kW and 5–6 kW for 1-phase and 3-phase, respectively. Before performing the laboratory tests all PV inverters were configured for operation with Polish grid code requirements. All tested PV inverters stored in the laboratory are presented in
Figure 9.
4. Experiment Procedure and Obtained Results
4.1. PV Inverters Response to Changes in Frequency
In the procedure for testing the response of PV inverters to changes in the frequency of the supply voltage, the DC side of the inverters was powered with total active power equal to 75% of the nominal power of a given inverter (PPV = 75% PN). After the inverters entered the steady-state mode of operation, the system frequency was stepwise changed in the following range:
From 48.0 Hz to 50.0 Hz with 0.5 Hz step.
From 50.0 Hz to 50.6 Hz with 0.2 Hz step.
From 51.0 Hz to 52.0 Hz with 0.5 Hz step.
For each frequency step, the values of frequency and AC active power P
AC were measured.
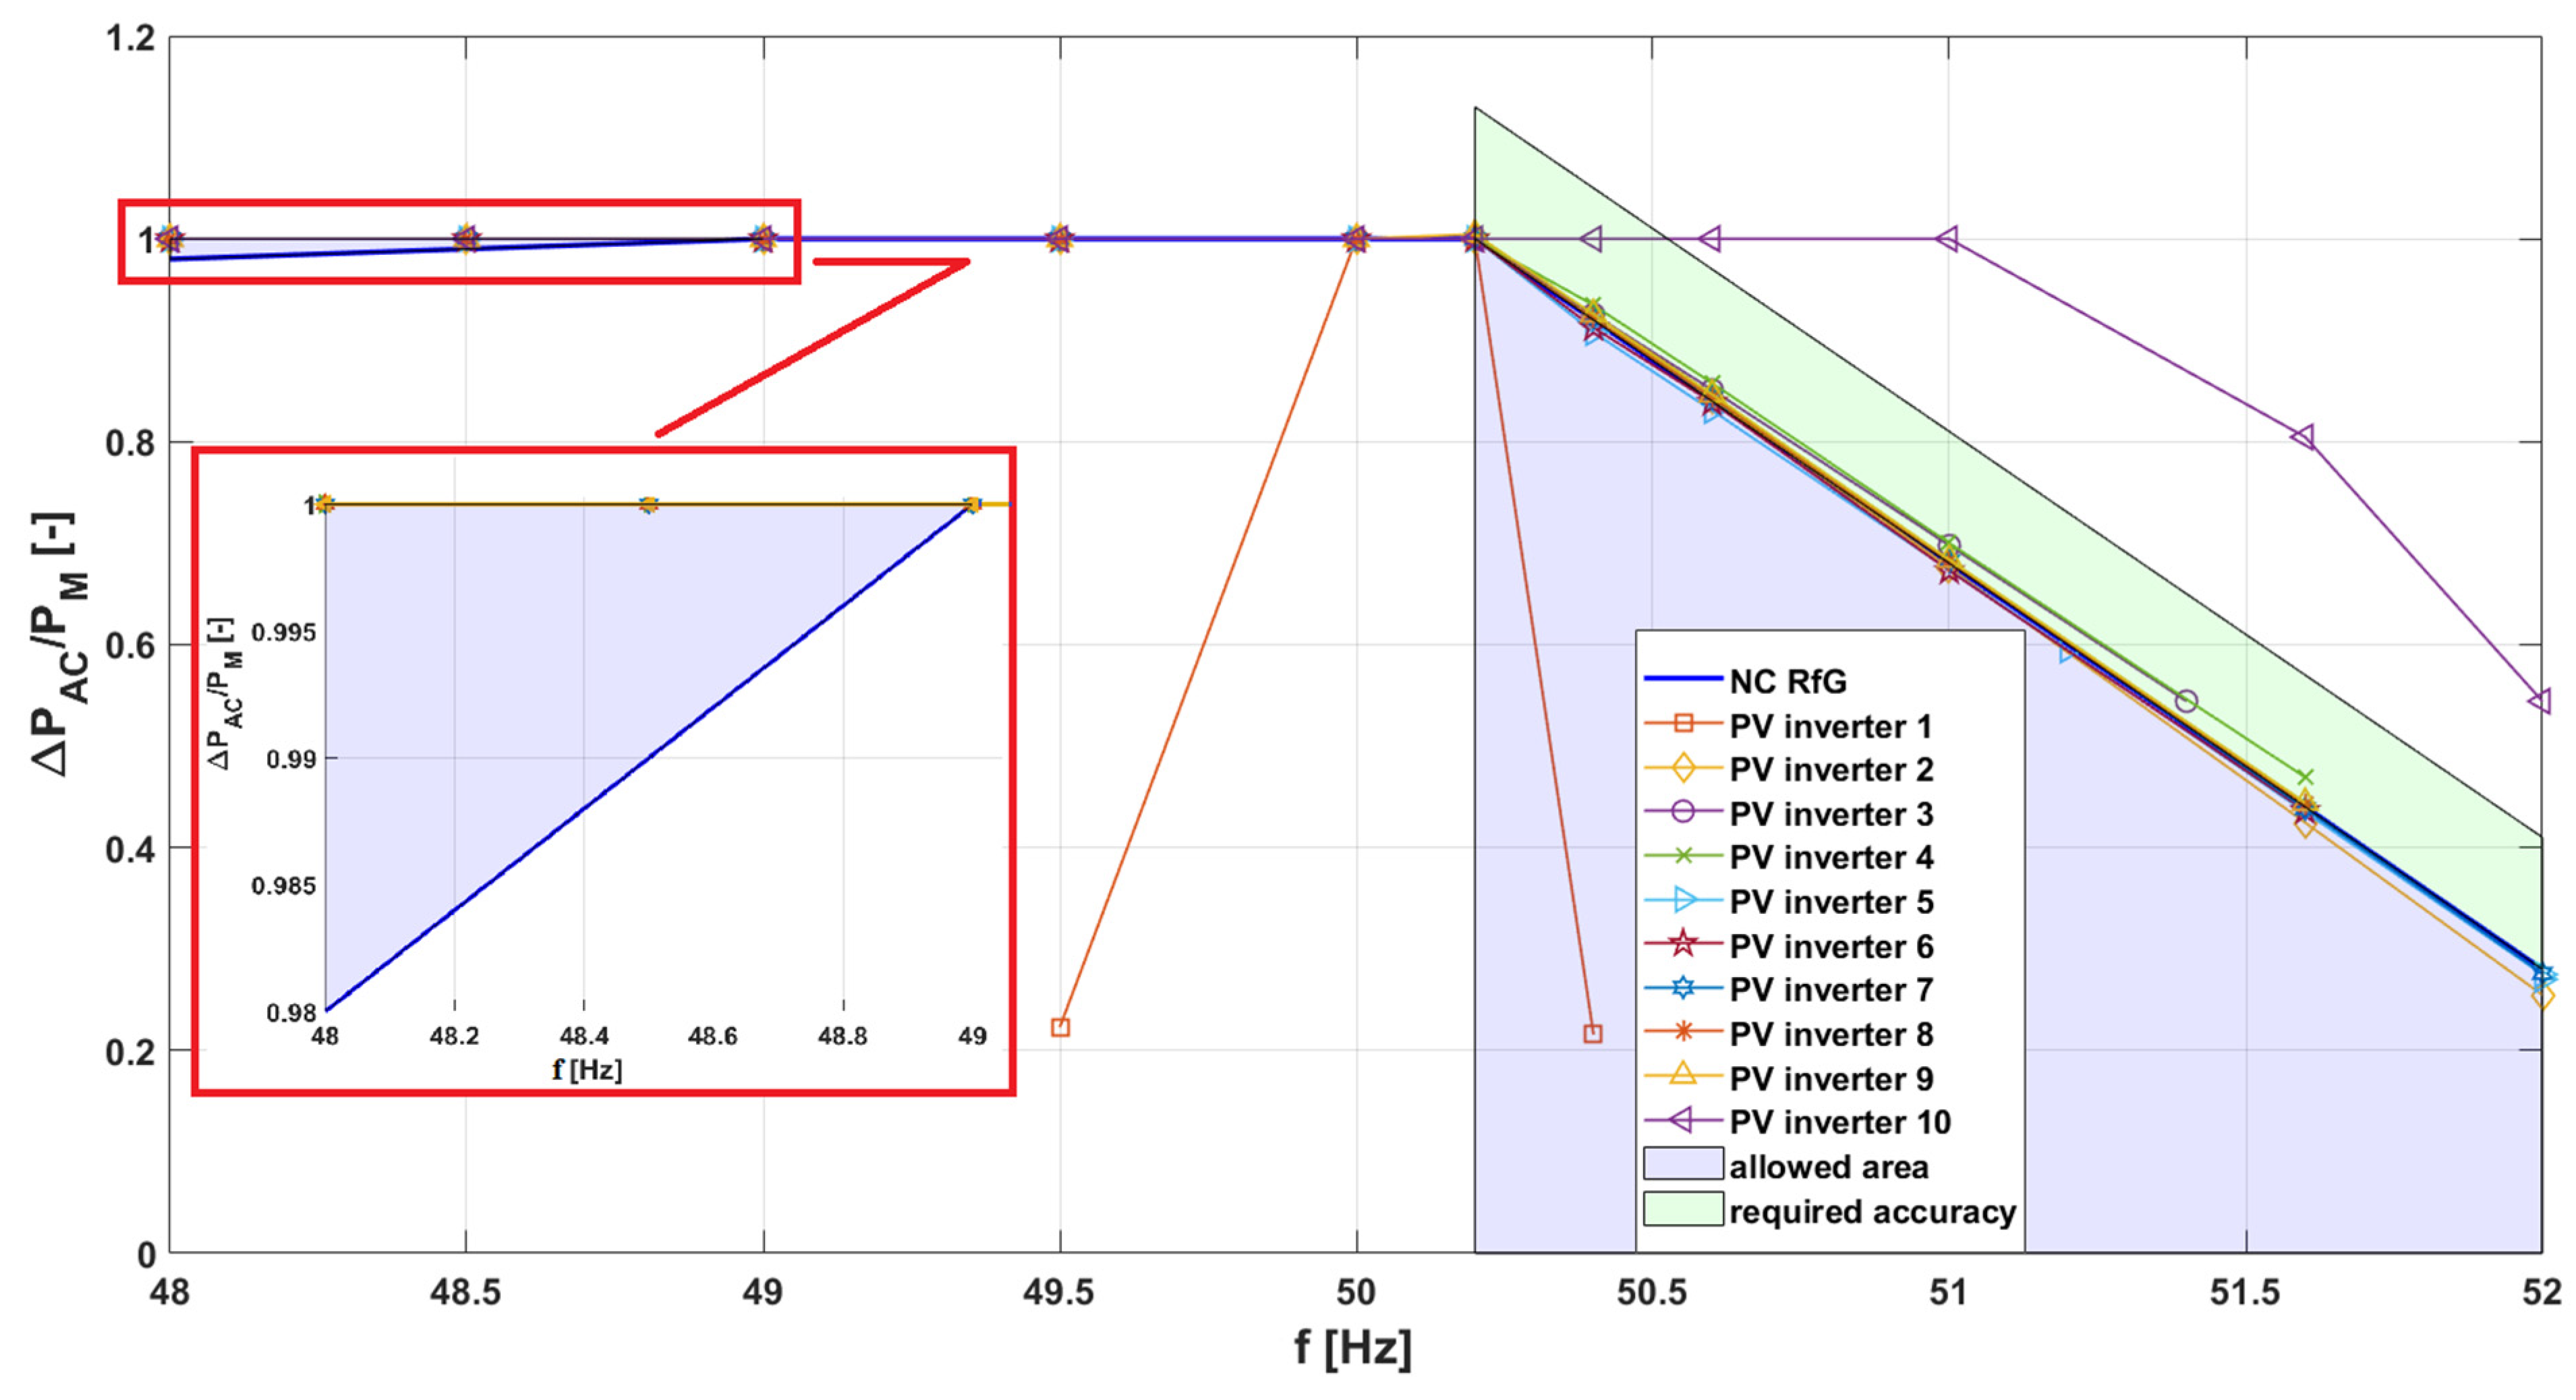
Figure 10 and
Figure 11 present the active power response to frequency changes in single-phase and three-phase inverters, respectively.
Based on the results presented in
Figure 10, it can be concluded that seven of ten inverters tested performed active power regulation in a proper way, i.e., their characteristics were within the permissible area extended by the required accuracy. The responses of inverters no. 1, 4, and 10 were inconsistent with the requirements. In the case of PV inverter no. 1, even a slight upward or downward deviation from the 50 Hz frequency resulted in a sharp decrease in its P
AC output power. Moreover, this inverter was automatically turning off as the frequency deviated further from 50 Hz. PV inverter no. 4 properly decreased its active power however, it was turning off after exceeding 51.6 Hz. In the case of the PV inverter no. 10, the reduction of the P
AC active power output started only from 51 Hz and its characteristic did not fall within the required accuracy range. The two missing inverters, according to the manufacturer’s declarations, did not have this functionality implemented at all and therefore were not tested.
In the case of three-phase inverters (
Figure 11), only twelve out of seventeen performed active power control within the allowed area. Three inverters numbered 6, 7, and 8 did not respond to the frequency increase. Inverters 9 and 10 did not achieve the required operating frequency of 52 Hz, while inverters 9, 10, and 15 reduced power more than required.
The NC RfG P(f) requirement is essential for maintaining grid stability, as it ensures that photovoltaic (PV) inverters can effectively adjust active power output in response to frequency changes. By adhering to the P(f) standards, PV inverters can modulate their power output to support the grid during frequency deviations. This capability allows them to either increase or decrease their power production to counteract frequency fluctuations, thereby helping to stabilize the grid and prevent potential blackouts or power quality issues.
If PV inverters do not have the ability to adjust their active power output in response to frequency changes, inverters may exacerbate frequency deviations instead of mitigating them. This can lead to increased instability in the grid, with a higher risk of frequency-related disturbances and potential cascading failures. Such inverters would be unable to provide the necessary support during critical moments, reducing the overall reliability and resilience of the power system.
4.2. PV Inverters Reactive Power Regulation
The procedure for verification of the reactive power regulation in response to supply voltage changes was performed for seventeen 3-phase PV inverters. During the tests, each PV inverter was supplied with DC power at 75% of the nominal power (P
PV = 75% P
N). Then, every time when a tested inverter reached the steady state, corresponding to the maximum possible AC active power generation, stepwise changes in the AC voltage from 207 V to 253 V with nine steps, corresponding to significant points of the characteristic from
Figure 5 were performed. For each voltage step, the values of reactive power Q were measured. The list of voltage steps with expected outputs expressed as a
Q/
PD ratio is presented in
Table 3. For each voltage step, the values of reactive power Q were measured.
4.2.1. Q(U) Mode Performance
The obtained results for 3-phase PV inverters are shown in
Figure 12. Characteristics of only 12 of 17 PV inverters are available on the graph since it was not possible for 5 PV inverters to set the Q(U) regulation mode using the provided inverters’ service interface, as well as direct support from inverters’ manufacturers.
Based on the obtained results the following conclusions can be formulated:
PV inverters, running in the Q(U) mode, basically perform the reactive power regulation, forcing the flow of inductive reactive power (with a voltage drop below 216.2 V) and capacitive reactive power (with an increase in voltage above 243.8 V), however, readings obtained for individual PV inverters are dispersed and most of them do not meet the given criterion.
The required accuracy for the Q(U) mode, which is ±2% of the maximum apparent power of the inverter, seems to be very demanding when comparing it with the criterion for P(f), which was verified in
Section 4.1 and was defined as 10% of rated active power. The reasonableness of such a difference in requirements for technically similar power indicators raises doubts, especially looking at the market response visible in the example of the overall performance of the tested PV inverters. The obliquity of maintaining such a requirement in the standard [
9] should be verified.
It can be noted that PV inverters running in the Q(U) mode might be able to generate enough reactive power to decrease the cosφ to the limit equal to 0.9, as required by [
9] and presented as the triangular area in
Figure 4. Standards and regulatory documents do not provide unambiguous guidelines on whether these two requirements should be combined with a conjunction or an alternative.
Having no limitation for Q(U) mode would allow the PV inverter to use its full available reactive power capacity for the grid voltage regulation. This feature would be desirable especially when the PV inverter is operating in a low-voltage feeder with a high concentration of other PV micro-installations, which raise voltage above permissible limits. An additional argument for not limiting the cosφ in the Q(U) mode is that low-voltage networks are characterized by high resistance and low reactance (R >> X), which means that more reactive power is needed to affect the voltage level at the PV inverter terminals. To increase the hosting capacity of low-voltage networks, for PV micro-installations, it would be desired by DSOs to not limit the cosφ or to set cosφ limit relatively low, e.g., to 0.1–0.2. In this case, reactive power provided by the PV inverter would be almost independent of actual generating active power and would depend only on the voltage level and inverter current limits.
Only 1 out of 12 tested PV inverters had the cosφ limit set to 0.9 (which corresponds to Q/PD equal to 0.4) as required by the standard EN-505049-1:2019. The other 11 PV inverters did not have limits for cosφ or the limits were set too low for the possibility of their detection in the performed test.
If a PV inverter fails to meet the Q(U) characteristic, it can create significant problems for the grid. The Q(U) characteristic helps maintain stable voltage levels by allowing the inverter to provide or absorb reactive power as needed. Without this feature, the inverter cannot support voltage regulation effectively.
This lack of support can lead to unstable voltage levels, causing problems like voltage drops or surges. Such issues can affect the quality of power and may put extra strain on other parts of the electrical system. In areas with many PV installations, this problem can become more pronounced, leading to more frequent voltage issues and making it harder to integrate renewable energy sources into the grid.
4.2.2. Reactive Power in cosφ = 1 Mode
In normal operation, i.e., when reactive power regulation modes are deactivated, PV inverters should generate energy without reactive power, so their cosφ should be as close as possible to 1. This performance was verified for either 1-phase or 3-phase inverters. Due to organizational reasons for the experiment, only nine single-phase inverters were available in these tests.
For the testing procedure the operating points of PV inverters were successively set to 25, 50, 75, and 100% of their rated powers, and at the rated voltage of 230 V. For each test step the values of cosφ and power factor and were measured.
Figure 13 and
Figure 14 present the obtained results for cosφ and power factor (PF), respectively. Depending on the PV inverter and actual active power, the value of cosφ was within the range of 0.97 to 1.00. The value of PF for 3-phase inverters tends to decline for lower powers. Unlike cosφ, which includes only the first harmonic component, PF considers reactive power from higher harmonics. Its reduced values indicate a relatively high current distortion on the AC side, thus resulting in reactive power of higher harmonics, which was confirmed by measurement of the total harmonic distortion indicator of the current, presented in
Figure 15.
One potential reason for this phenomenon could be the quantization and resolution limitations inherent to the measurement devices within the control system. These limitations can distort the accurate detection and processing of electrical signals, leading to a misrepresentation of harmonic components. Additionally, the closed-loop current control mechanisms, designed specifically to mitigate harmonic distortion, may become less effective or cease to function optimally at lower power outputs. This decline in effectiveness is due to the control system’s decreased ability to accurately regulate the power flow, thereby failing to suppress the harmonic components as intended.
Voltage distortion caused by distorted current is one of the most common disturbances in the quality of electricity occurring in a real power grid. Issues related to distortion of voltages/currents are complex [
28,
29,
30], and the phenomenon itself may intensify other disturbances in the quality of electricity occurring in the power grid (e.g., voltage fluctuations [
31,
32]).
4.2.3. Q(U) Reactive Power Regulation with Voltage Asymmetry
To signal one specific feature of the PV inverter’s power regulation mode, an additional test was conducted on the one exemplary 3-phase PV inverter, which has simultaneously activated the Q(U) reactive power regulation mode. The purpose of the test was to verify the response of the PV inverter to asymmetrical AC voltage.
During the tests, the PV inverter was supplied with DC power at 75% of the nominal power (P
PV = 75% P
N). After the inverter reached the steady state operation, stepwise changes in the individual AC phase voltages were performed in the following way. At the starting point of the test, all three phase voltages were set to 230 V. Then phase L1 was changed at the rate of 5 V/min until reaching 255 V. Next, phase L2 was changed at the rate of 5 V/min until reaching 255 V. In the last step, phase L3 was also reduced in steps of 5 V/min until reaching 200 V. This procedure is presented in
Figure 16. Additionally, the graph is completed with the voltage mean value (black line) and the limit above which the reactive power should be generated (red dotted line). For each voltage step, the values of active power P and reactive power Q were measured and are presented in
Figure 16.
Presented results show that most of the test time, at least one of the phase voltages was at the level of 255 V and still there was no generation of the reactive power. The inverter started to generate reactive power only when the arithmetic mean calculated from 3-phase voltages exceeded the upper threshold resulting from the characteristics included in the DSO requirements, i.e., 243.8 V. Such operation is compliant with the standard [
9], which allows three methods of determining the triggering voltage level (to be selected by the manufacturer of the device):
Determination of the symmetrical positive sequence of voltage.
Determination of the arithmetic means of three independently measured phase or phase-to-phase voltages.
Determination of three independent voltages to determine the reactive power for each phase.
The choice of the voltage determination method for the reactive power control algorithm according to points “a” or “b” means that in the case of high voltage unbalance, combined with voltage increase on one or two phases, the inverter will not counteract voltage increases, which may contribute to its automatic tripping due to overvoltage protection for a given phase. A much more effective solution would be to control the reactive power independently in three phases (implementation of the control algorithm according to point “c”, however, it should be noted that this would require a significant modification of both the structure and the control algorithm of the inverter. An alternative, simple, and faster-reacting solution could be to trigger the reactive power generation when at least one phase voltage exceeds the threshold (e.g., upper) under the condition that voltage levels at other phases are not too close to the lower threshold.
4.3. Under-Voltage Ride-Through Immunity
The procedure for verification of the UVRT was performed for eleven 3-phase PV inverters, as the remaining six were not available at the time of testing for experiment organizational reasons. During the tests, each PV inverter was supplied with DC power at 50% of the nominal power (PPV = 50% PN). Every time after the PV inverter reached the steady state operation, corresponding to stable AC active power generation, a voltage event was generated, simulating voltage sag or short interruption from the AC grid side. Generated voltage events lasted from 100 to 2000 ms and had amplitudes ranging from 2% to 98% of the rated voltage 230 V.
Figure 17 shows a visualization of exemplary voltage sags of different voltage amplitudes along with their approximate mapping on the UVRT characteristic.
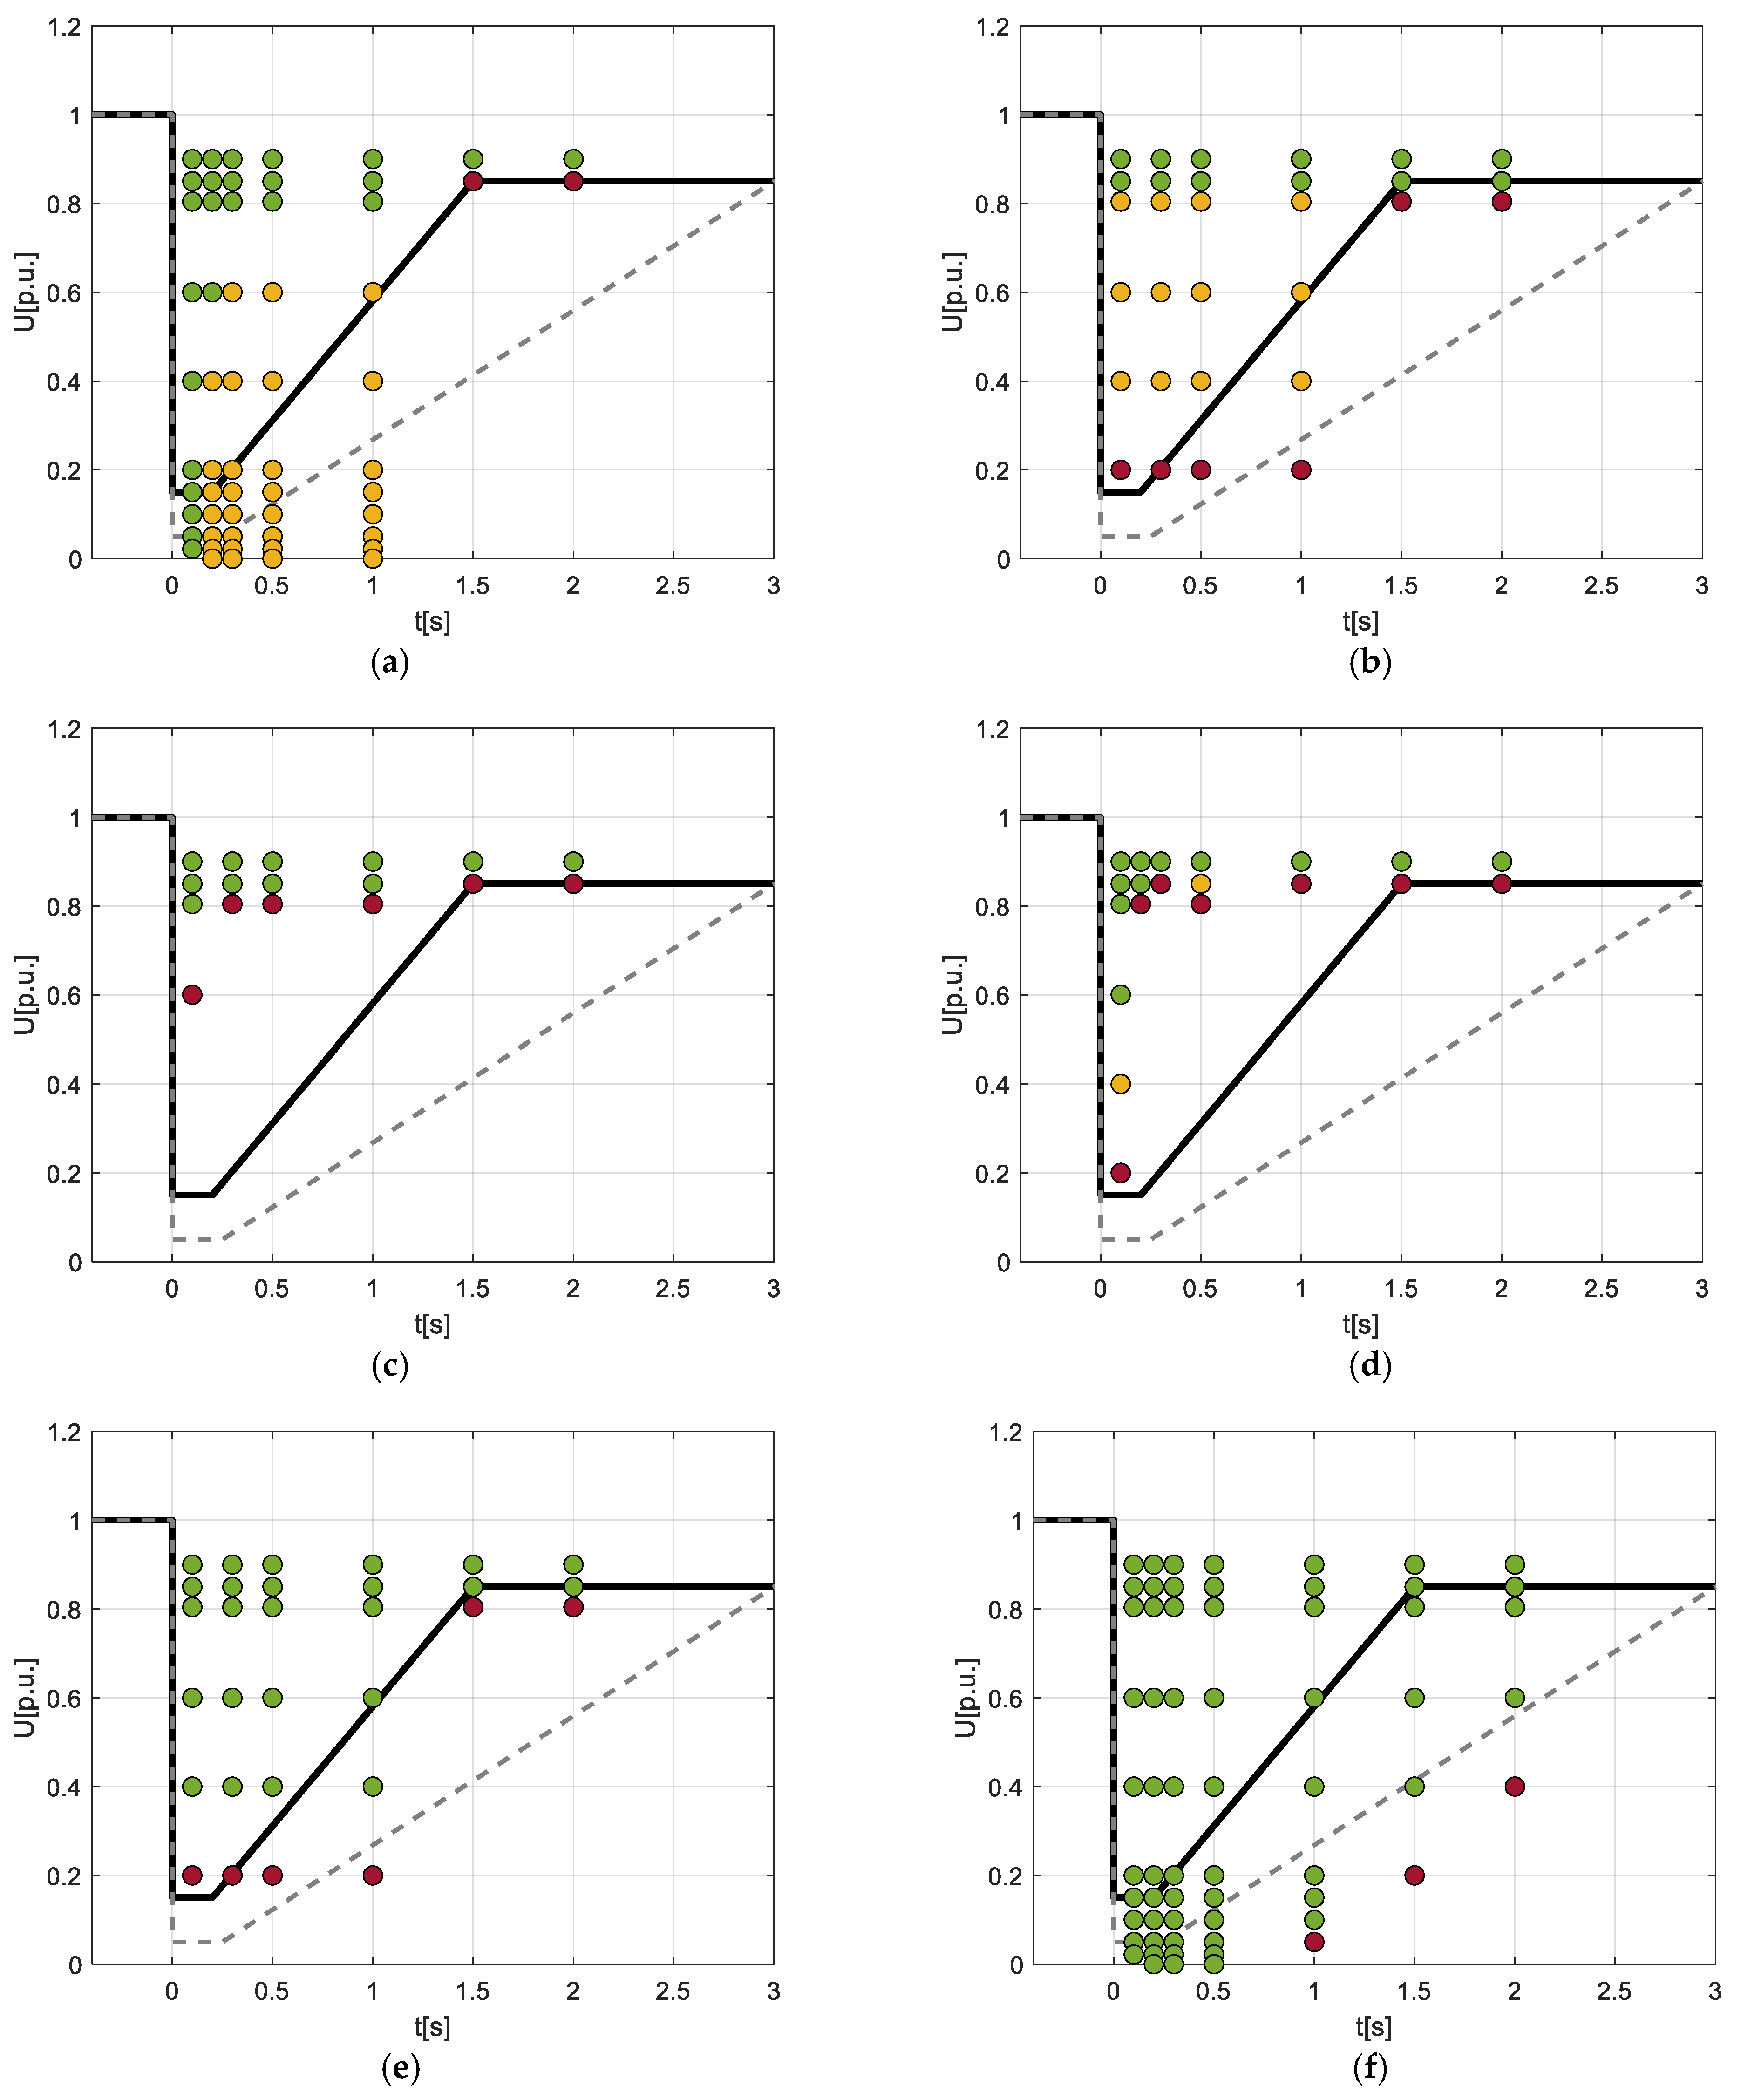
During the tests, PV inverter responses to every voltage event were recorded and classified into three distinct groups (Example event recordings of each group are presented in
Figure 18):
Continuous operation without a significant reduction in phase currents—labeled as green dots in
Figure 19.
Continuous operation with a significant reduction in phase currents below 10% of a pre-event level. The PV inverter returns to operation immediately after the event ends—labeled as orange dots in
Figure 19.
The PV inverter shuts down and starts the grid resynchronization procedure—labeled as red dots in
Figure 19.
Each PV inverter was repeatedly tested for every voltage sag or short interruption until the device shut down and started the grid resynchronization procedure. The results of the tests, obtained for eleven 3-phase PV inverters, are summarized in
Figure 19. Each green, orange, and red dot corresponds to one voltage event and observed inverter’s response.
According to the performed tests, only five out of eleven 3-phase PV inverters tested complied with the UVRT recommendations from the standard [
9]. Operation of the PV inverter during voltage events of different amplitudes does not cause the device to trip, which is a very positive aspect for the prosumer. Operation of the PV inverter with much-reduced power, or even device tripping, could be a danger to the power system stability, especially when many PV micro-installations connected to the low-voltage network are affected by voltage events. The same can be stated for the last PV inverter response presented in
Figure 18c. It is also worth noting that the EU network code NC RfG [
8] and the standard [
9] do not define the active power generation drop during voltage sags. As can be seen from
Figure 18, despite the fact that power generation dropped to zero, the operation of a PV inverter complied with the documents [
9,
10], which only define how fast the power generation should be resumed, but do not mention the maximum allowable level of the power generation drop.
The exclusion of the UVRT mode has an impact on the power output of the PV inverter. If the UVRT mode is not properly configured, the PV inverter will be prone to voltage sags and will turn off. From the prosumer’s point of view, the PV micro-installation should produce as much energy as possible. Following this approach, the UVRT mode should maximize the output power and operation time of the PV inverter, allowing the device to survive voltage events of various depths and durations. The operation of the PV inverter in the UVRT mode is an important functionality, especially in low-voltage networks where voltage events occur relatively frequently.
Moreover, effective UVRT operation contributes to the overall resilience of the electrical grid. When PV inverters are capable of riding through voltage dips, they provide essential support by stabilizing the local voltage and preventing additional stress on the grid infrastructure. This not only helps mitigate the impact of voltage sags but also reduces the likelihood of cascading failures that can arise from widespread inverter disconnections. In areas with high penetration of renewable energy sources, robust UVRT functionality becomes increasingly important to balance and stabilize the grid, ensuring a consistent and reliable power supply. By enabling PV inverters to manage voltage events, UVRT plays a critical role in integrating renewable energy into the grid efficiently and sustainably.
5. Conclusions
In this paper, the essential requirements concerning the PV micro-installation operation in low-voltage distribution networks in Poland and the EU were presented, followed by a series of experimental laboratory tests performed on 29 PV inverters widely available in the EU market. The scope of the laboratory tests included correctness verification of:
The response of PV inverters to changes in the frequency of the supply voltage in accordance with the Limited Frequency Sensitive Mode.
The reactive power control modes including Q = f (U) mode in accordance with the PN-EN 50549-1 and its behavior with asymmetric AC voltages.
The power factor and current total harmonic distortion indicator (THDI).
Under-voltage ride-through (UVRT) immunity.
The first conclusion, in terms of assessing the compliance of PV inverters with the requirements of grid codes, is that:
This means that the currently used procedure for allowing PV inverters to be connected to the grid allows for defective devices that do not meet the requirements of grid regulations.
Based on the obtained results, it can be concluded that many more inverters met the requirements of the NC RfG network code than the requirements specified by the local DSOs. This is mainly because the NC RfG network code is a European-level regulation, published by the European Union Commission. This situation differs in the case of the requirements specified in the standard [
9] and by individual DSOs in EU countries. As presented in the introduction, the NC RfG network code has a very limited list of requirements that do not consider many ones that are significant from the point of view of the DSOs, such as active/reactive power control modes, protection systems activation thresholds, or UVRT immunity. These are usually published by local DSOs, often in the native language of a given country.
Comparing requirements for type A power-generating modules and obtained test results, the following further conclusions can be drawn:
Network code NC RfG for type A power-generating modules focuses on the reaction of the PV inverters on frequency deviation, which is essential for a transmission system operator (TSO), but it lacks requirements that are important for the proper operation of low-voltage networks with high concentration of PV micro-installations.
Equipment certificates complied with the network code NC RfG will not contribute to solving DSO problems with a high concentration of PV micro-installations, because tests of PV inverters performed by accredited laboratories will cover a relatively limited scope of functionalities resulting only from the network code NC RfG for type A power-generating modules.
The local requirements may differ significantly from each other and be less achievable for manufacturers of production devices. Moreover, the network code NC RfG does not contain any provisions that the generating modules should also be certified for compliance with the requirements specified by the DSO. All this together means that manufacturers of inverters, especially those from outside the EU, often do not have knowledge of local requirements determined by the DSO, which results in the lack of their implementation in the generating modules sold in a given country.
There are some inconsistencies between the network code NC RfG and the standard [
9]. For example, for the LFSM-O mode, in the network code NC RfG for the Power Park Modules (PPM), the reference active power
Pref is equal to the actual active power
PM now the LFSM-O threshold is reached or
Pref can be equal to the maximum capacity
Pmax of a PPM, as defined by the relevant TSO. In turn, for the PPM in the standard EN-50549-1:2019,
Pref is equal only to
PM. In this situation, when a TSO of one of the Member States in the EU defines that for the PPM
Pref =
Pmax, PV inverters are not fulfilling the standard [
10].

 ,
, 


