
Numerical Investigation of the Combined Effect of Terrain Slope and Wind Velocity on Fire Spread Rate in Natural Pastures


Abstract
:1. Introduction
2. Materials and Methods
2.1. Simulation
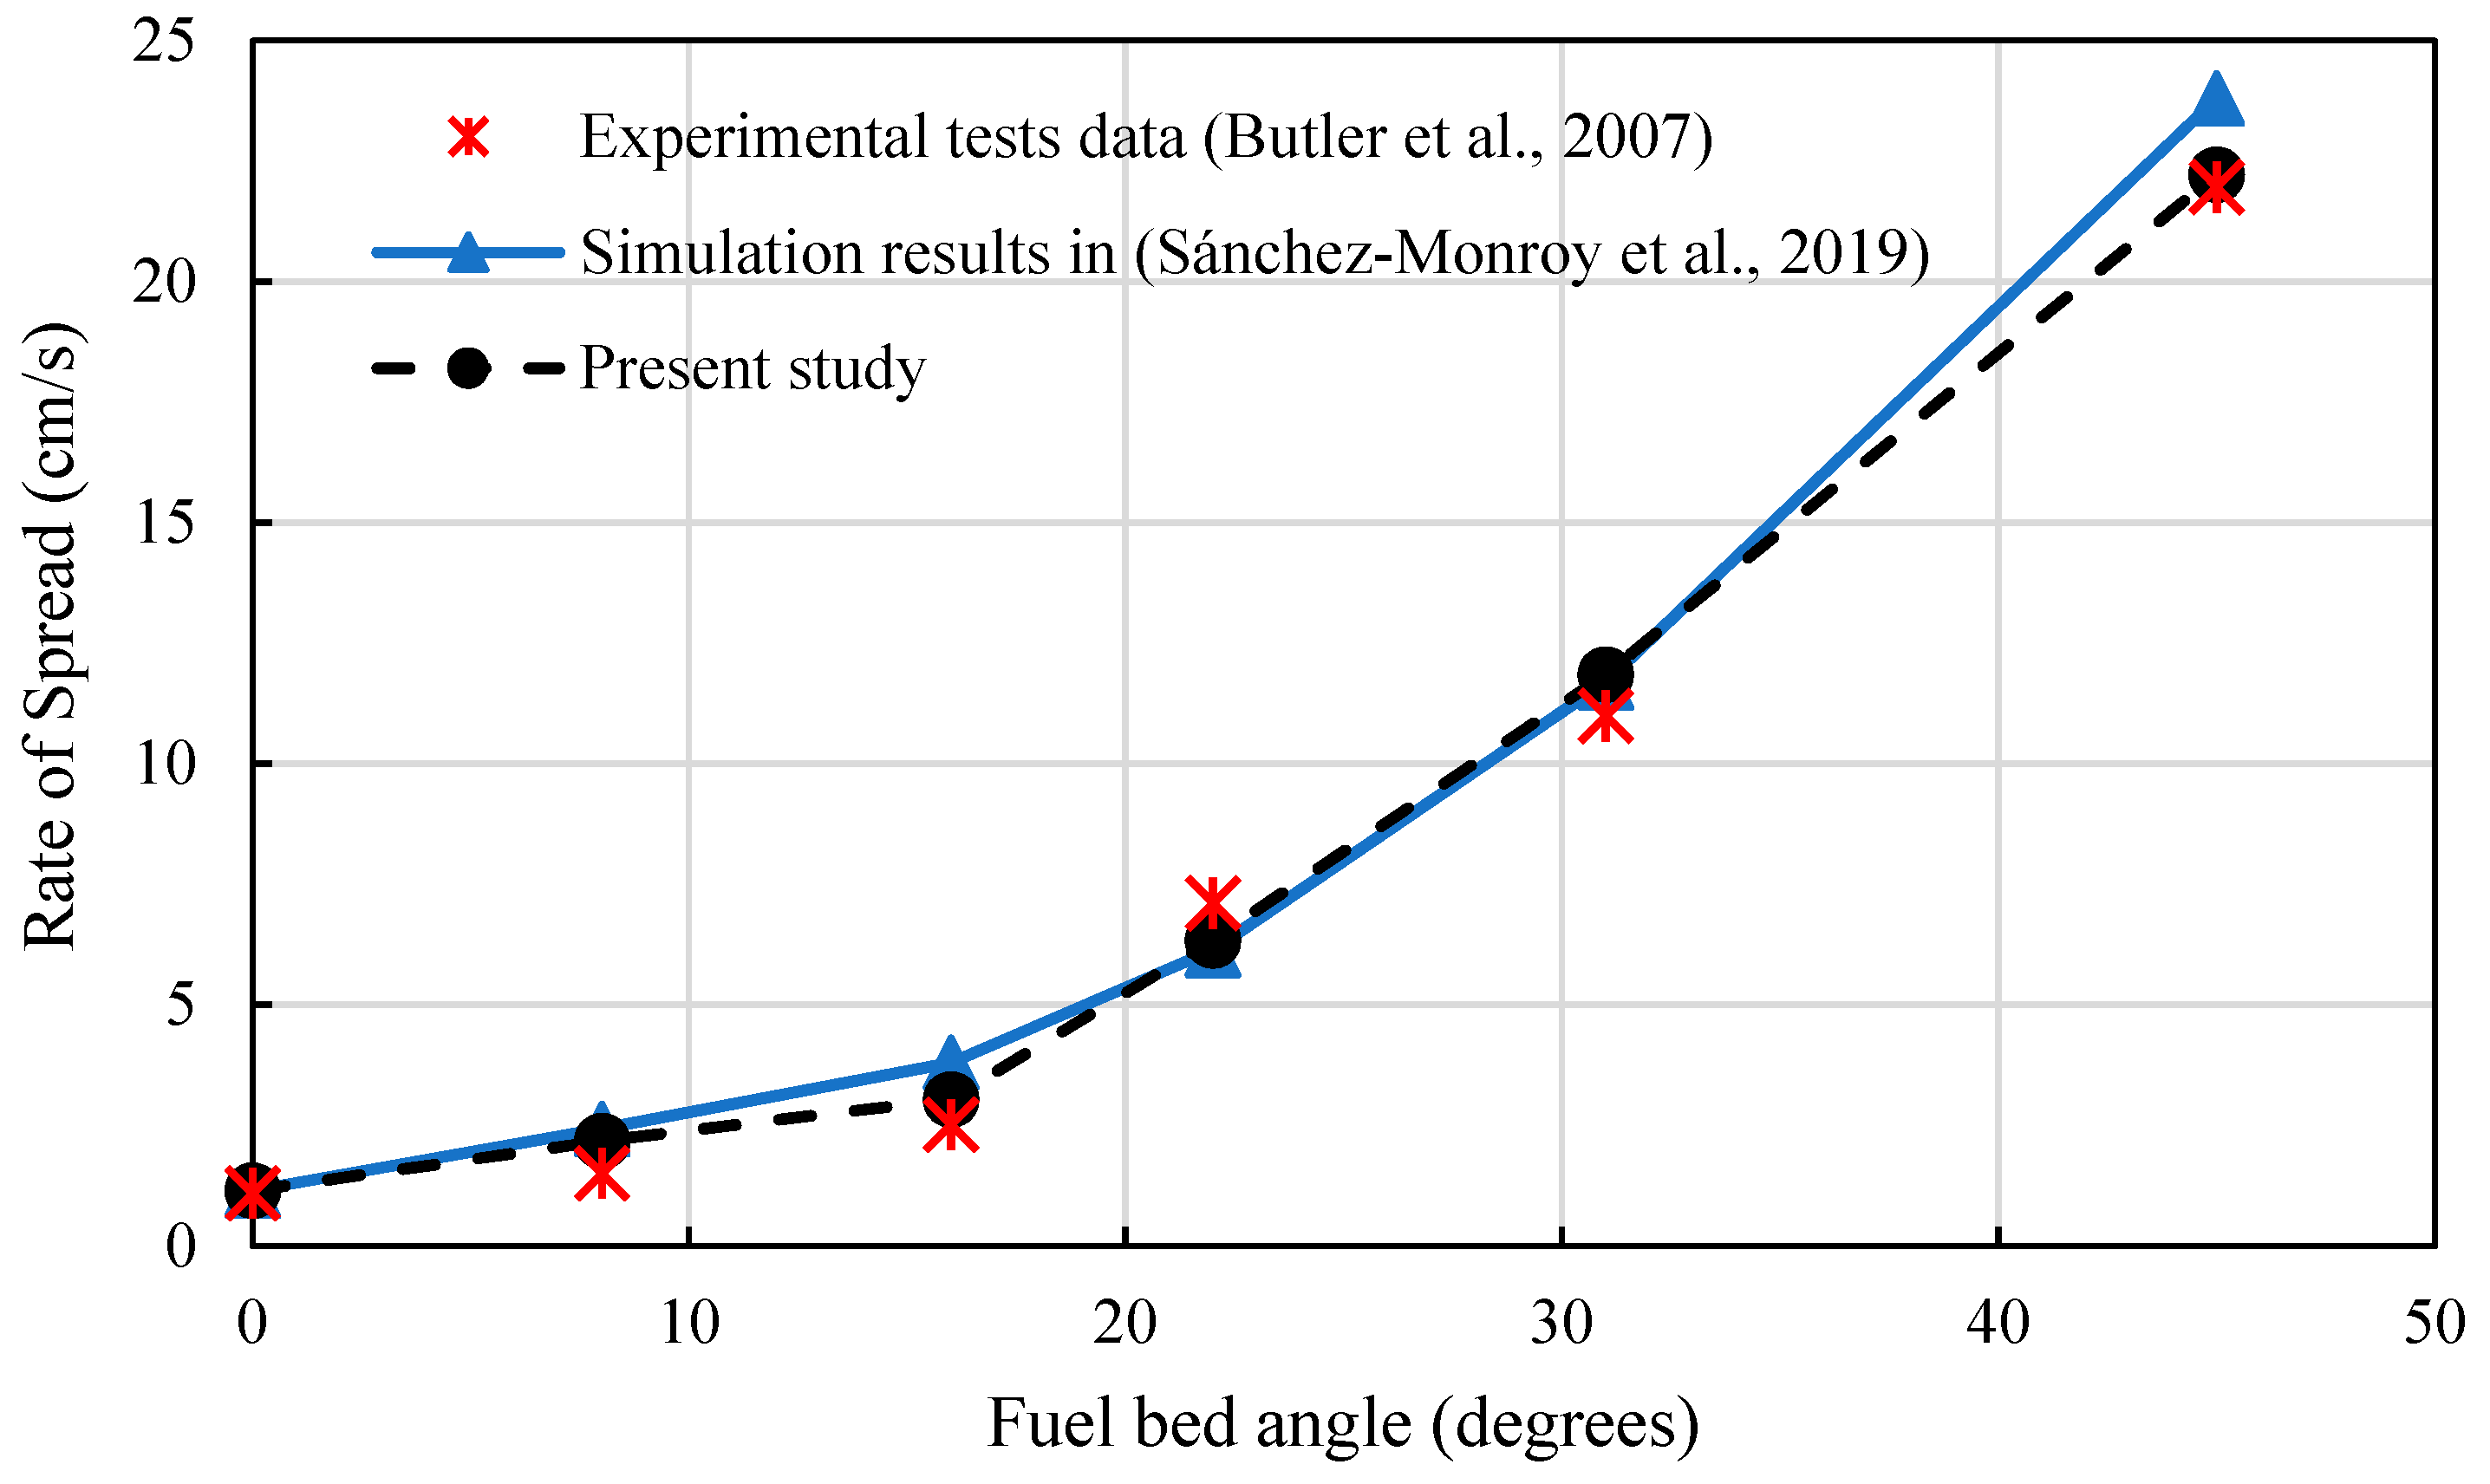
2.2. Validation
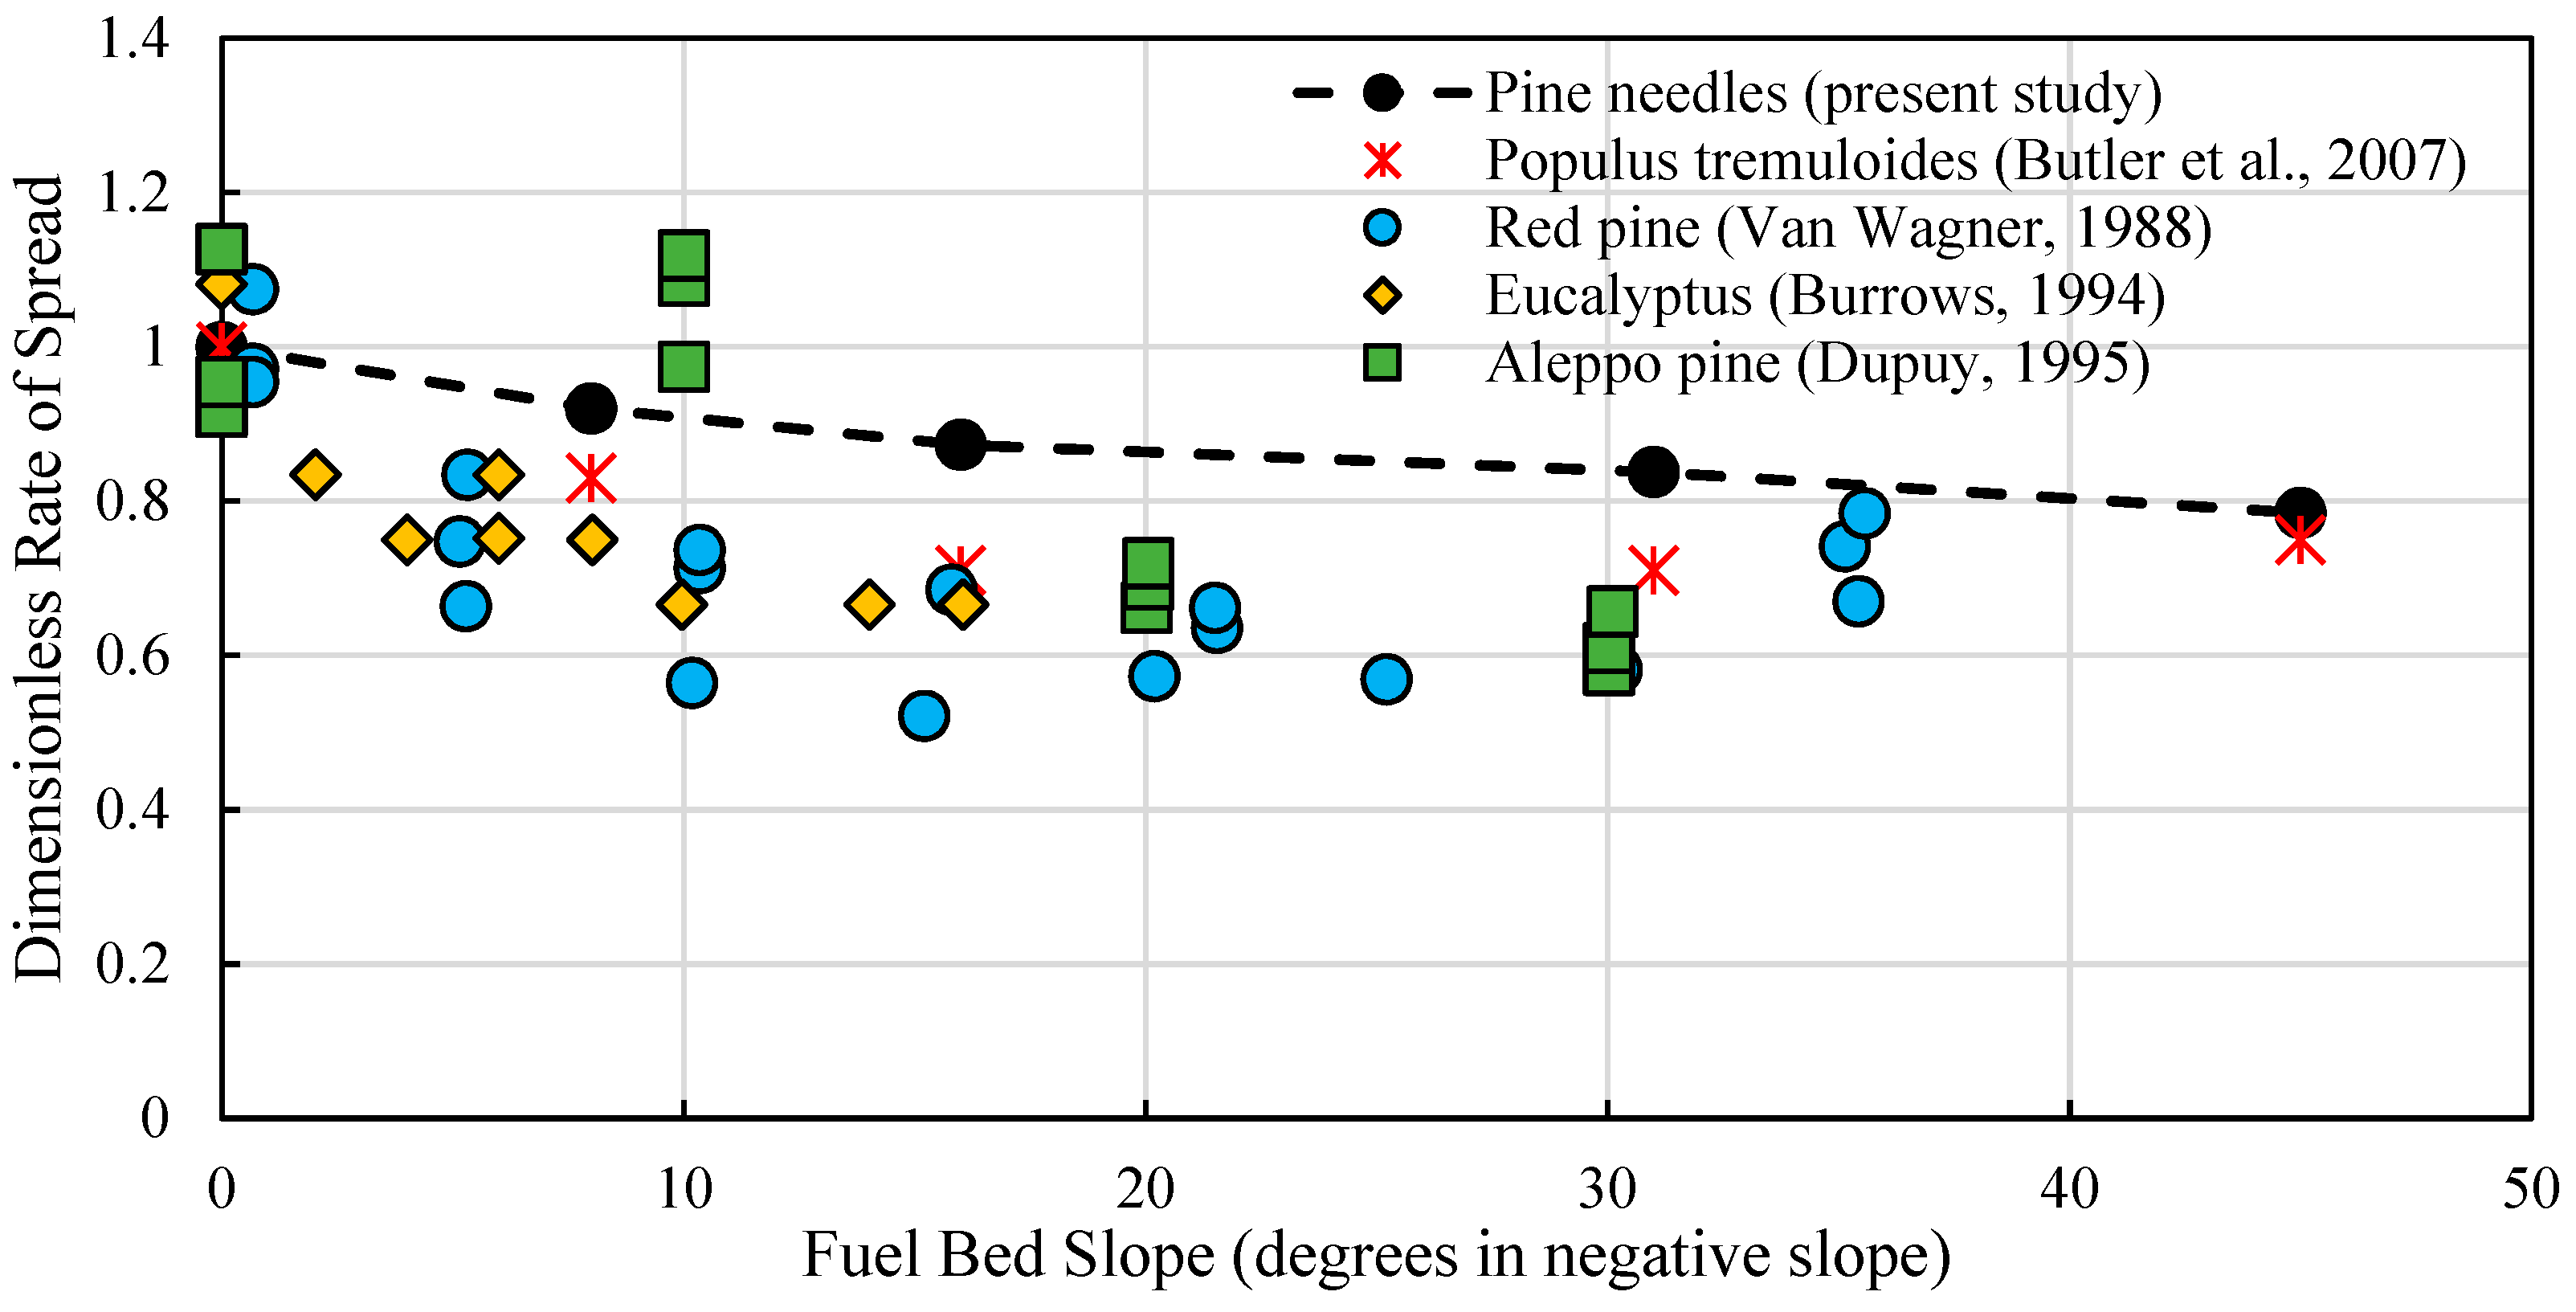
2.3. Negative Slopes
2.4. Grid Independence
3. Results
3.1. Zero Wind Condition
3.2. Backward Wind Combination
4. Conclusions
- Steep slopes: On slopes above 20°, the fire front changes from a U-shape to a V-shape, accelerating the ROS. Quick-response strategies are needed in such areas.
- Negative slopes: Negative slopes slightly reduce ROS (18% reduction in HHR), indicating that suppression efforts should focus more on wind and fuel load in downhill fires.
- Backward wind on sloped fuel bed: Backward wind reduces heat transfer to unburned areas, affecting fire behavior. Higher wind speeds on positive slopes reduce radiant heat transfer, slowing fire spread, with up to 29.81% less heat absorption at 30° and 2 m/s wind. This emphasizes the need for physical studies of wind–flame interactions, as a better understanding of this phenomenon can improve fire prediction models and response strategies, particularly in regions with reversed wind patterns.
- Fire spot modeling: Current models do not simulate fire spots, which accelerate spread. Physical investigations of fire dynamics are crucial for improving predictions and fire management strategies.
Author Contributions
Funding
Institutional Review Board Statement
Informed Consent Statement
Data Availability Statement
Acknowledgments
Conflicts of Interest
Nomenclature
| First coefficient in the convection heat transfer coefficient equation | |
| Drag coefficient | |
| Convective heat transfer coefficient of fuel element | |
| Conductivity of gas element | |
| Second coefficient in the convection heat transfer coefficient equation | |
| Prandtl number | |
| Local Reynolds number for fuel element | |
| Velocity vector | |
| Longitudinal direction | |
| Transverse direction | |
| Height direction | |
| Fuel packing ratio | |
| Fuel element surface-to-volume ratio |
Appendix A

| Parameter | Value | Unit |
|---|---|---|
| Ambient temperature | 27 | °C |
| Ambient relative humidity | 50 | % |
| Ambient pressure | 101,325 | Pa |
| Smagorinsky constant | 0.2 | - |
| Prandtl number | 0.5 | - |
| Schmidt number | 0.5 | - |
| Vegetation fuel specification | ||
| Density | 398 | |
| Conductivity | 0.2 | |
| Emissivity | 0.88 | - |
| Arrhenius constant | 36,300 | |
| Activation energy | 60,276.5 | |
| Pyrolysis reaction heat | 418 | |
| Specific heat (temperature depended) | ||
| Fuel load | 12.4 | |
| Mass fraction of char production | 0.26 | - |
| Surface-to-volume ratio | 3096 | |
| Char specification | ||
| Density | 200 | |
| Thermal conductivity | 0.052 | |
| Mole fraction of oxygen consumption by char | 1.65 | - |
| Char oxidation constant | 0.2 | - |
| Arrhenius constant | 430 | - |
| Activation energy | 74,800 | |
| Char oxidation heat of reaction | −32,740 | |
| Specific heat (temperature depended) | ||
| Ash specification | ||
| Density | 67 | |
| Thermal conductivity | 0.1 | |
| Specific heat | 0.8 | |
| Moisture | ||
| Density | 1000 | |
| Thermal conductivity | 0.6 | |
| Arrhenius constant | 600,000 | - |
| Activation energy | 48,200 | |
| Evaporation enthalpy | 2259 | |
| Specific heat | 4.22 | |
| Fuel vapor specification | ||
| Ash production mass fraction | 0.02 | - |
| Heat of combustion | −17,700 | |
| Chemical formula | - | |
References
- Bishe, E.M.; Norouzi, M.; Afshin, H.; Farhanieh, B. A Case Study on the Effects of Weather Conditions on Forest Fire Propagation Parameters in the Malekroud Forest in Guilan, Iran. Fire 2023, 6, 251. [Google Scholar] [CrossRef]
- Mohammadian Bishe, E.; Afshin, H.; Farhanieh, B. Modified Quasi-Physical Grassland Fire Spread Model: Sensitivity Analysis. Sustainability 2023, 15, 13639. [Google Scholar] [CrossRef]
- Morvan, D. Physical Phenomena and Length Scales Governing the Behaviour of Wildfires: A Case for Physical Modelling. Fire Technol. 2011, 47, 437–460. [Google Scholar] [CrossRef]
- Scott, J.H.; Burgan, R.E. Standard Fire Behavior Fuel Models: A Comprehensive Set for Use with Rothermel’s Surface Fire Spread Model; US Department of Agriculture, Forest Service, Rocky Mountain Research Station: Fort Collins, CO, USA, 2005.
- Shojaee Mehr, R.; Mohammadian Bishe, E.; Jafari, M.; Farhanieh, B.; Afshin, H. Numerical Investigation of the Effect of Land Slope on the Rate of Fire Spread in Natural Pastures. Mater. Chem. Mech. 2023, 1, 15–22. [Google Scholar]
- Kuznetsov, G.V.; Piskunov, M.V.; Strizhak, P.A. How to Improve Efficiency of Using Water When Extinguishing Fires through the Explosive Breakup of Drops in a Flame: Laboratory and Field Tests. Int. J. Therm. Sci. 2017, 121, 398–409. [Google Scholar] [CrossRef]
- Silvani, X.; Morandini, F.; Dupuy, J.-L. Effects of Slope on Fire Spread Observed through Video Images and Multiple-Point Thermal Measurements. Exp. Therm. Fluid. Sci. 2012, 41, 99–111. [Google Scholar] [CrossRef]
- Dupuy, J.-L.; Maréchal, J. Slope Effect on Laboratory Fire Spread: Contribution of Radiation and Convection to Fuel Bed Preheating. Int. J. Wildland Fire 2011, 20, 289. [Google Scholar] [CrossRef]
- Yang, Z.; Chen, H. Experimental Study on Flame Geometry along the Inclined Surface with and without Sidewalls by Using a Gas Burner. Procedia Eng. 2018, 211, 925–933. [Google Scholar] [CrossRef]
- Rodrigues, A.; Ribeiro, C.; Raposo, J.; Viegas, D.X.; André, J. Effect of Canyons on a Fire Propagating Laterally Over Slopes. Front. Mech. Eng. 2019, 5, 41. [Google Scholar] [CrossRef]
- Eftekharian, E.; Rashidi, M.; Ghodrat, M.; He, Y.; Kwok, K.C.S. LES Simulation of Terrain Slope Effects on Wind Enhancement by a Point Source Fire. Case Stud. Therm. Eng. 2020, 18, 100588. [Google Scholar] [CrossRef]
- Eftekharian, E.; Ghodrat, M.; He, Y.; Ong, R.H.; Kwok, K.C.S.; Zhao, M.; Samali, B. Investigation of Terrain Slope Effects on Wind Enhancement by a Line Source Fire. Case Stud. Therm. Eng. 2019, 14, 100467. [Google Scholar] [CrossRef]
- Accary, G.; Fayad, J.; Chatelon, F.-J.; Frangieh, N.; Awad, C.; Meradji, S.; Marcelli, T.; Rossi, J.-L.; Morvan, D.; Rossi, L. Simulation of Induced-Wind-Dominated Fire on Sloping Terrain. In Advances in Forest Fire Research 2022; Imprensa da Universidade de Coimbra: Coimbra, Portugal, 2022; pp. 375–380. [Google Scholar]
- Sánchez-Monroy, X.; Mell, W.; Torres-Arenas, J.; Butler, B.W. Fire Spread Upslope: Numerical Simulation of Laboratory Experiments. Fire Saf. J. 2019, 108, 102844. [Google Scholar] [CrossRef]
- Boboulos, M.; Purvis, M.R.I. Wind and Slope Effects on ROS during the Fire Propagation in East-Mediterranean Pine Forest Litter. Fire Saf. J. 2009, 44, 764–769. [Google Scholar] [CrossRef]
- Ong, R.H.; Patruno, L.; He, Y.; Efthekarian, E.; Zhao, Y.; Hu, G.; Kwok, K.C.S. Large-Eddy Simulation of Wind-Driven Flame in the Atmospheric Boundary Layer. Int. J. Therm. Sci. 2022, 171, 107032. [Google Scholar] [CrossRef]
- Innocent, J.; Sutherland, D.; Moinuddin, K. Field-Scale Physical Modelling of Grassfire Propagation on Sloped Terrain under Low-Speed Driving Wind. Fire 2023, 6, 406. [Google Scholar] [CrossRef]
- Canfield, J.M.; Linn, R.R.; Sauer, J.A.; Finney, M.; Forthofer, J. A Numerical Investigation of the Interplay between Fireline Length, Geometry, and Rate of Spread. Agric. For. Meteorol. 2014, 189–190, 48–59. [Google Scholar] [CrossRef]
- Pimont, F.; Dupuy, J.-L.; Linn, R.R. Coupled Slope and Wind Effects on Fire Spread with Influences of Fire Size: A Numerical Study Using FIRETEC. Int. J. Wildland Fire 2012, 21, 828. [Google Scholar] [CrossRef]
- Moinuddin, K.A.M.; Sutherland, D.; Mell, W. Simulation Study of Grass Fire Using a Physics-Based Model: Striving towards Numerical Rigour and the Effect of Grass Height on the Rate of Spread. Int. J. Wildland Fire 2018, 27, 800. [Google Scholar] [CrossRef]
- Ángel Javaloyes, M.; Pendás-Recondo, E.; Sánchez, M. A General Model for Wildfire Propagation with Wind and Slope. SIAM J. Appl. Algebr. Geom. 2023, 7, 414–439. [Google Scholar] [CrossRef]
- Edalati-nejad, A.; Ghodrat, M.; Sharples, J.J. On the Interaction of Wind, Fire Intensity and Downslope Terrain with Implications for Building Standards in Wildfire-Prone Areas. Int. J. Wildland Fire 2023, 32, 1619–1632. [Google Scholar] [CrossRef]
- McGrattan, K.B.; Baum, H.R.; Rehm, R.G.; Hamins, A.; Forney, G.P.; Floyd, J.E.; Hostikka, S.; Prasad, K. Fire Dynamics Simulator—Technical Reference Guide; National Institute of Standards and Technology: Gaithersburg, MD, USA, 2000. [Google Scholar]
- McGrattan, K.; Hostikka, S.; McDermott, R.; Floyd, J.; Weinschenk, C.; Overholt, K. Fire Dynamics Simulator Technical Reference Guide Volume 1: Mathematical Model. NIST Spec. Publ. 2013, 1018, 175. [Google Scholar]
- Perez-Ramirez, Y.; Mell, W.E.; Santoni, P.A.; Tramoni, J.B.; Bosseur, F. Examination of WFDS in Modeling Spreading Fires in a Furniture Calorimeter. Fire Technol. 2017, 53, 1795–1832. [Google Scholar] [CrossRef]
- Mell, W.; Jenkins, M.A.; Gould, J.; Cheney, P. A Physics-Based Approach to Modelling Grassland Fires. Int. J. Wildland Fire 2007, 16, 1. [Google Scholar] [CrossRef]
- Smagorinsky, J. General Circulation Experiments with the Primitive Equations i. The Basic Experiment. Mon. Weather. Rev. 1963, 91, 99–164. [Google Scholar] [CrossRef]
- Lilly, D.K. The representation of small-scale turbulence in numerical simulation experiments. In Proceedings of the IBM Scientific Computing Symposium on Environmental Sciences, Yorktown Heights, NY, USA, 16–18 March 1967; pp. 29–179. [Google Scholar]
- David, C. Wilcox Turbulence Modeling for CFD, 1st ed.; DCW Industries, Incorporated: La Canada Flintridge, CA, USA, 1994. [Google Scholar]
- Magnussen, B.F.; Hjertager, B.H. On Mathematical Modeling of Turbulent Combustion with Special Emphasis on Soot Formation and Combustion. Symp. Int. Combust. 1977, 16, 719–729. [Google Scholar] [CrossRef]
- Saâdaoui, M.; Mahjoub Saïd, N.; Mhiri, H.; Caminat, P.; Le Palec, G.; Bournot, P. Study of the Behaviour of a Flame Resulting from the Combustion of Pine Needles in a Cylindrical Basket. Int. J. Therm. Sci. 2008, 47, 293–305. [Google Scholar] [CrossRef]
- Incropera, F.P. Fundamentals of Heat and Mass Transfer; John Wiley & Sons: Hoboken, NJ, USA, 2007; ISBN 0471457280, 9780471457282. [Google Scholar]
- Butler, B.W.; Anderson, W.R.; Catchpole, E.A. Influence of Slope on Fire Spread Rate. In Proceedings of the The Fire Environment—Innovations, Management, and Policy; United States Department of Agriculture, Destin, FL, USA, 26 March 2007; pp. 75–83. [Google Scholar]
- Van Wagner, C.E. Effect of Slope on Fires Spreading Downhill. Can. J. For. Res. 1988, 18, 818–820. [Google Scholar] [CrossRef]
- Burrows, N.D. Experimental Development of a Fire Management Model for Jarrah (Eucalyptus Marginata Donn Ex Sm) Forest; Australian National University: Canberra, Australia, 1994. [Google Scholar]
- Dupuy, J. Slope and Fuel Load Effects on Fire Behavior: Laboratory Experiments in Pine Needles Fuel Beds. Int. J. Wildland Fire 1995, 5, 153. [Google Scholar] [CrossRef]


| Fuel Bed Height (cm) | Packing Ratio | Fuel Load (kg/m3) | Slope Variation Range (Degrees) | Moisture Content (%) |
|---|---|---|---|---|
| 15.24 | 0.03 | 1.85 | 0, 8, 16, 22, 31, and 45 | 8.17 |
| Fuel Bed Slope (Degrees) | Percent Study Error (%) | Simulation Results Reported in [14] Error (%) |
|---|---|---|
| 0 | 4.54 | 4.54 |
| 8 | 44.37 | 60.92 |
| 16 | 20.63 | 50.79 |
| 22 | 10.82 | 13.64 |
| 31 | 7.72 | 6.27 |
| 45 | 1.13 | 8.32 |
Disclaimer/Publisher’s Note: The statements, opinions and data contained in all publications are solely those of the individual author(s) and contributor(s) and not of MDPI and/or the editor(s). MDPI and/or the editor(s) disclaim responsibility for any injury to people or property resulting from any ideas, methods, instructions or products referred to in the content. |
© 2025 by the authors. Licensee MDPI, Basel, Switzerland. This article is an open access article distributed under the terms and conditions of the Creative Commons Attribution (CC BY) license (https://creativecommons.org/licenses/by/4.0/).
Share and Cite
Shojaei Mehr, R.; Mohammadian Bishe, E.; Farhanieh, B.; Afshin, H. Numerical Investigation of the Combined Effect of Terrain Slope and Wind Velocity on Fire Spread Rate in Natural Pastures. Modelling 2025, 6, 15. https://doi.org/10.3390/modelling6010015
Shojaei Mehr R, Mohammadian Bishe E, Farhanieh B, Afshin H. Numerical Investigation of the Combined Effect of Terrain Slope and Wind Velocity on Fire Spread Rate in Natural Pastures. Modelling. 2025; 6(1):15. https://doi.org/10.3390/modelling6010015
Chicago/Turabian StyleShojaei Mehr, Reza, Esmaeil Mohammadian Bishe, Bijan Farhanieh, and Hossein Afshin. 2025. "Numerical Investigation of the Combined Effect of Terrain Slope and Wind Velocity on Fire Spread Rate in Natural Pastures" Modelling 6, no. 1: 15. https://doi.org/10.3390/modelling6010015
APA StyleShojaei Mehr, R., Mohammadian Bishe, E., Farhanieh, B., & Afshin, H. (2025). Numerical Investigation of the Combined Effect of Terrain Slope and Wind Velocity on Fire Spread Rate in Natural Pastures. Modelling, 6(1), 15. https://doi.org/10.3390/modelling6010015