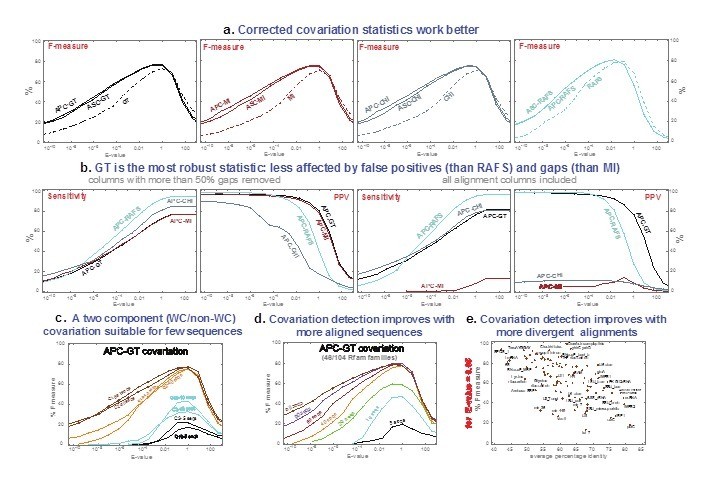
Supplementary Figure 1: Characterization of different covariation statistics on a positive testset of 104 RNAs.
From: A statistical test for conserved RNA structure shows lack of evidence for structure in lncRNAs

(a) Plots of the F measure---the harmonic mean of sensitivity (SEN) and positive predictive value (PPV), F=2*SEN*PPV / (SEN+PPV)---for four different covariation statistics as a function of the score's E-value, over all alignments, using R=scape with default parameters. (b) Effect of alignment gaps on the different covariation statistics, seen by including all alignment columns (right) as compared to the R-scape default (left). (c) Effect of measuring covariation using a binary classification (whether a pair is canonical Watson-Crick/G:U or not) versus using the full sixteen-way classification. (d) Covariation detection as a function of the number of sequences in the alignments. (e) The F measure for each of the 104 RNA Rfam alignments in the positive testset as a function of average percentage identity, at an E-value threshold of 0.05.