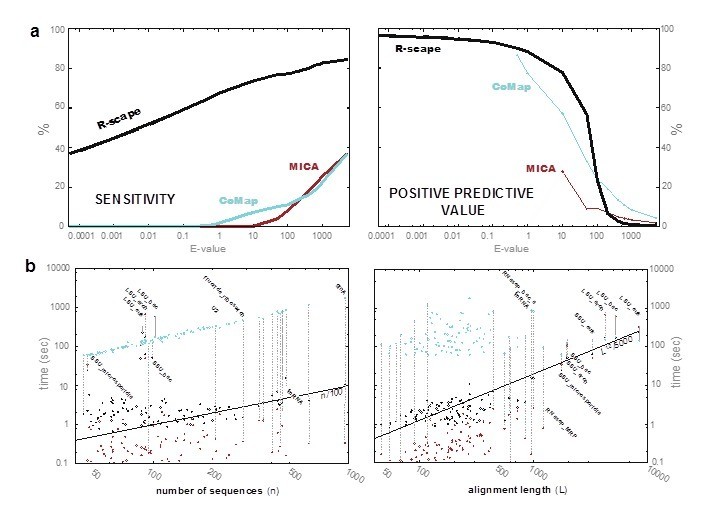
Supplementary Figure 2: Comparison of R-scape to related methods CoMap and MICA [12] on the testset of 104 RNAs.
From: A statistical test for conserved RNA structure shows lack of evidence for structure in lncRNAs

(a) Sensitivity (percentage of significant base pairs) and positive predictive value (percentage of significant pairs that are base pairs) as a function of the score's E-value. (b) Running times for the three methods (R-scape in black, CoMap cyan, MICA red) on a log-log plot as a function of the number of sequences in the alignment (left) and as a function of the alignment length (right). Running times are for a single 3GHz intel Core i7 with 8GB 1600GHz DDR3 RAM. Running times for R-scape and CoMap include the cost of generating a phylogenetic tree using FastTree [26].