Ensuring Maximum Operational Performance in Cement Plant
•
10 likes•1,321 views

Cement Industry is under increasing pressure to become more profitable. Globally, there is overcapacity of production. To be competitive, Production Units need to optimize operations to the maximum possible level so as to lower overall operating costs with/without having to make major capital investments.
Report
Share


Ensuring Maximum Operational Performance in Cement Plant
- 1. March 2018 Ensuring Maximum Operational Performance Fouad Ghoneim, PMP®, SSYB® Electrical Manager - ASEC Cement
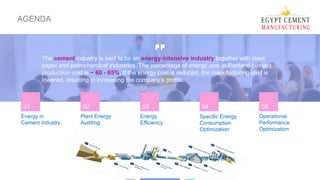
- 2. AGENDA The cement industry is said to be an energy-intensive industry together with steel, paper and petrochemical industries. The percentage of energy cost in Portland cement production cost is ~ 60 - 65%. If the energy cost is reduced, the manufacturing cost is lowered, resulting in increasing the company’s profits. 01 Energy in Cement Industry 02 Plant Energy Auditing 03 Energy Efficiency 04 Specific Energy Consumption Optimization 05 Operational Performance Optimization
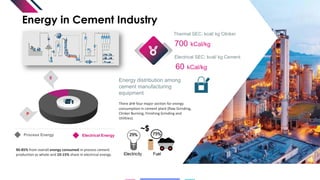
- 3. Energy in Cement Industry Energy distribution among cement manufacturing equipment There are four major section for energy consumption in cement plant (Raw Grinding, Clinker Burning, Finishing Grinding and Utilities). P E Electrical EnergyProcess Energy 700 kCal/kg 60 kCal/kg Thermal SEC: kcal/ kg Clinker Electrical SEC: kcal/ kg Cement 90-85% from overall energy consumed in process cement production as whole and 10-15% share in electrical energy.
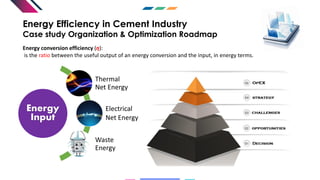
- 4. Energy Efficiency in Cement Industry Case study Organization & Optimization Roadmap Energy Input Thermal Net Energy Electrical Net Energy Waste Energy Energy conversion efficiency (η): is the ratio between the useful output of an energy conversion and the input, in energy terms.
- 5. Before Auditing Pre-audit step & Plant Rader Chart • Get management commitment. • Set energy policy, objectives and structure. • Plant status right image. Time Different types of positions require different kinds of selection techniques. Choosing the right techniques will help you to recruit the best person for the position. The selection techniques you choose will depend on the particular skills, attributes and knowledge required for the position. Tools & Techniques Energy Auditing is an inspection, survey and analysis of energy flows, for energy conservation in a process or system to reduce the amount of energy input into the system without negatively affecting the output(s). Audit is should be a periodic examination of an energy system to ensure that energy is being used as efficiently as can as possible.
- 6. Energy Management Auditing Audit Roadmap: 1. Thermal efficiency 2. Electric efficiency 3. Alternative fuel use 4. Clinker substitution 5. Carbon capture and storage Step-by-step Auditing Roadmap
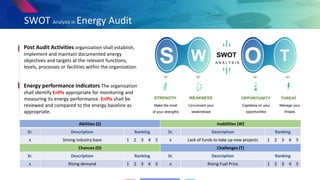
- 7. WS TOSWOT A N A L Y S I S Make the most of your strengths STRENGTH Circumvent your weaknesses WEAKNESS Capitalize on your opportunities OPPORTUNITY Manage your threats THREAT SWOT Analysis in Energy Audit Post Audit Activities organization shall establish, implement and maintain documented energy objectives and targets at the relevant functions, levels, processes or facilities within the organization. Energy performance indicators The organization shall identify EnPIs appropriate for monitoring and measuring its energy performance. EnPIs shall be reviewed and compared to the energy baseline as appropriate. Abilities (S) Inabilities (W) Sr. Description Ranking Sr. Description Ranking x Strong industry base 1 2 3 4 5 x Lack of funds to take up new projects 1 2 3 4 5 Chances (O) Challenges (T) Sr. Description Ranking Sr. Description Ranking x Rising demand 1 2 3 4 5 x Rising Fuel Price 1 2 3 4 5
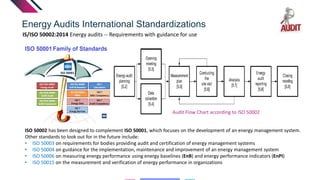
- 8. Energy Audits International Standardizations IS/ISO 50002:2014 Energy audits -- Requirements with guidance for use ISO 50002 has been designed to complement ISO 50001, which focuses on the development of an energy management system. Other standards to look out for in the future include: • ISO 50003 on requirements for bodies providing audit and certification of energy management systems • ISO 50004 on guidance for the implementation, maintenance and improvement of an energy management system • ISO 50006 on measuring energy performance using energy baselines (EnB) and energy performance indicators (EnPI) • ISO 50015 on the measurement and verification of energy performance in organizations Audit Flow Chart according to ISO 50002
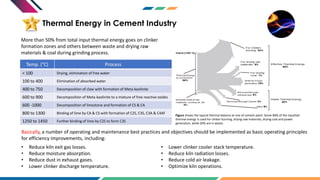
- 9. Thermal Energy in Cement Industry Figure shows the typical thermal balance at one of cement plant. Some 80% of the inputted thermal energy is used for clinker burning, drying raw materials, drying coal and power generation, while 20% are in waste. • Reduce kiln exit gas losses. • Reduce moisture absorption. • Reduce dust in exhaust gases. • Lower clinker discharge temperature. • Lower clinker cooler stack temperature. • Reduce kiln radiation losses. • Reduce cold air leakage. • Optimize kiln operations. Basically, a number of operating and maintenance best practices and objectives should be implemented as basic operating principles for efficiency improvements, including: More than 50% from total input thermal energy goes on clinker formation zones and others between waste and drying raw materials & coal during grinding process. Temp. (°C) Process < 100 Drying, elimination of free water 100 to 400 Elimination of absorbed water 400 to 750 Decomposition of claw with formation of Meta-kaolinite 600 to 900 Decomposition of Meta-kaolinite to a mixture of free reactive oxides 600 -1000 Decomposition of limestone and formation of CS & CA 800 to 1300 Binding of lime by CA & CS with formation of C2S, C3S, C3A & C4AF 1250 to 1450 Further binding of lime by C2S to form C3S
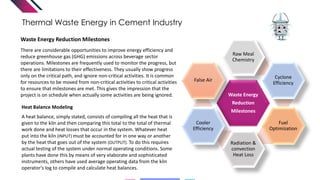
- 10. Thermal Waste Energy in Cement Industry Waste Energy Reduction Milestones Raw Meal Chemistry Cyclone Efficiency Fuel Optimization Radiation & convection Heat Loss Cooler Efficiency False Air Heat Balance Modeling A heat balance, simply stated, consists of compiling all the heat that is given to the kiln and then comparing this total to the total of thermal work done and heat losses that occur in the system. Whatever heat put into the kiln (INPUT) must be accounted for in one way or another by the heat that goes out of the system (OUTPUT). To do this requires actual testing of the system under normal operating conditions. Some plants have done this by means of very elaborate and sophisticated instruments, others have used average operating data from the kiln operator’s log to compile and calculate heat balances. Waste Energy Reduction Milestones There are considerable opportunities to improve energy efficiency and reduce greenhouse gas (GHG) emissions across beverage sector operations. Milestones are frequently used to monitor the progress, but there are limitations to their effectiveness. They usually show progress only on the critical path, and ignore non-critical activities. It is common for resources to be moved from non-critical activities to critical activities to ensure that milestones are met. This gives the impression that the project is on schedule when actually some activities are being ignored.
- 11. Waste Energy Reduction Milestones Raw Meal Chemistry 1 C3S = 4.071 CaO - 7.600 SiO2 - 6.718 Al2O3 - 1.430 Fe2O3 - 2.852 SO3 Required burning temperature T (°C) = 1300 +4.51 C3S + 3.74 C3A-12.64 C4AF Burnability factor % Free-lime1400 =0.33 (%LSFto100)+1.8 (S/R-2)+0.93Q+0.33C+0.34A Case Study Snapshot Cyclone Efficiency 2 Preheater dust losses depend on the efficiency of top stage cyclone. Modern cement plants are operating with top stage cyclone efficiency of about 95-97%. Raw meal to clinker factor = (1- (C x A)/104)/ (1- LOI/100) Kiln feed to clinker factor = Raw meal to clinker factor/ (1- DL/100) Case Study Snapshot Cyclone Efficiency Every 1.0 hPa Saving 103 to 129 kcal/t Cli. Dust Load Every 1.0 kg/wt/kg Cli. Saving 30 to 40 kcal/t Cli. Drying Calcining Sintering Raw Mill Moisture 5 to 6 % to be dried <1% Cal. Value 63 to 69 kcal/t Cli. % CaO Target 64 to 66 % Cal. Value 736 to 751 kcal/t Cli.
- 12. Waste Energy Reduction Milestones Fuel Optimization 3 The minimizing excess air in rotary kiln without any formed of CO leads to improvement in the performance of the kiln and consequently leads to reduce the fuel energy consumption shorten and intensity the flame leads to reduce the fuel energy consumption. Furthermore, optimize kiln burner primary air is to consider as potential for decreasing of fuel energy consumption. Case Study Snapshot Best optimization style is the mathematical model which consists of the material balances and fuel specs that are expressed as equality constraints and product specification constraints that are expressed as inequality constraints to get the performed of the maximum TSR (Thermal Substitution Rate). Fuel Moisture 65 to 70 °C Losses 76.8 kg-oil/h + 29.3 kWh/h Excess Air 8,690 Nm3/h Losses 76.8 kg-oil/h + 29.3 kWh/h
- 13. Waste Energy Reduction Milestones Radiation & convection Heat Loss 4 Heat loss through the shell of the kiln can be reduce by selecting the type of refractory which having lower thermal conductivity (high insulation brick). It also can be decrease by achieve a uniformity and stable coating inside the rotary kiln. This can be achieved by adjusting of the flame shape inside the kiln and by selecting a raw materials which having stable coating tendency by selecting appropriate module like LSF, SM and AM of raw materials. Case Study Snapshot Radiation Loss <45 kcal/kg Cli. for 4500tpd <60 kcal/kg Cli. for 3000tpd kcal/kg Cli. T1 T2 In case of excessive temperature increase its surface can deflect. High value of local deformations can cause problems with kiln's internal lining, shortening its durability. Thermal crank (shell temperature distribution) of main areas of stress that you should focus during kiln shell inspection.
- 14. Waste Energy Reduction Milestones False Air6 Air leakage through an aperture of area A (m2) with pressure differential dP (mm H2O) can be approximately calculated from Volume (m3/hr) = 8900*A* dP0.5 Air leakage between 2 points in the kiln exhaust system can be determined by oxygen measurement False air (in terms of outlet) % = 100 (G2-G1)/(20.9-G2) Where G1 = initial O2 % 7& G2 = final O2 Case Study Snapshot False air @ kiln inlet 8,690 Nm3/h Losses 29 kWh/h + 15 Kcal/kg/h Cooler Efficiency 5 Faster cooling of clinker has the following effects;- • Smaller C3A crystals resulting in a more reactive and easier to grind clinker, producing faster cement setting times and improved early strengths. • Prevents the decomposition of C3S into C2S and (sub-microscopic) free lime, resulting in improved cement strength, compared to slow cooled clinker. • Increases the chances of other elements (eg Mg, Al, Fe etc) being trapped in the crystal structure of the clinker silicate minerals. Such chemical substitutions cause the clinker minerals to become more reactive during hydration, thus increasing strengths and shortening setting time. Case Study Snapshot Cooler Efficiency 70 to 74 % Saving 28 kcal/kg Cli. Cooler Efficiency 65 to 70 % Saving 48 kcal/kg Cli. Cooler Efficiency (η)= ((A-B)/A)*100 where A = Heat content of clinker leaving the kiln B = Heat losses of clinker cooler
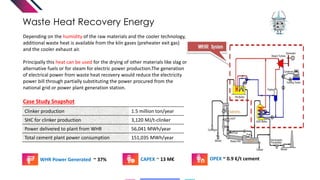
- 15. Waste Heat Recovery Energy Case Study Snapshot Depending on the humidity of the raw materials and the cooler technology, additional waste heat is available from the kiln gases (preheater exit gas) and the cooler exhaust air. Principally this heat can be used for the drying of other materials like slag or alternative fuels or for steam for electric power production.The generation of electrical power from waste heat recovery would reduce the electricity power bill through partially substituting the power procured from the national grid or power plant generation station. CAPEX ~ 13 M€ OPEX ~ 0.9 €/t cementWHR Power Generated ~ 37% Clinker production 1.5 million ton/year SHC for clinker production 3,120 MJ/t-clinker Power delivered to plant from WHR 56,041 MWh/year Total cement plant power consumption 151,035 MWh/year
- 16. Electrical Energy in Cement Industry 5% 24% 6% 22% 38% 5% ELECTRICAL ENERGY CONSUMED BY PROCESS SECTION Raw Material Extraction & Belnding Raw Material Grinding Raw Material Homogenization Clinker Production Cement Production Conveying, Packing & Loading Energy Allocation Center (EAC)
- 17. Electrical Waste Energy in Cement Industry Electrical energy consumption breakdown at a typical cement plant Optimizing all aspects of a plant lifecycle requires putting asset reliability on par with design and operational improvement efforts. Optimum reliability is defined as the ideal asset reliability threshold that will drive a higher return on capital employed and extend the life of existing assets. Grinding accounts for more than 60% of the electrical power demand during cement production while also being of greatest importance for the final product quality. With today’s and tomorrow’s challenges regarding energy and resource efficiency in mind, grinding within the cement industry has to be rethought. Equipment Performance Efficiency & Process Optimization
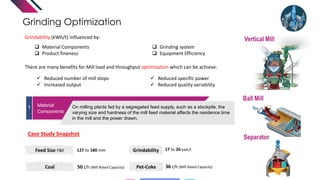
- 18. Grinding Optimization Grindability (kWh/t) influenced by: There are many benefits for Mill load and throughput optimization which can be achieve: Reduced number of mill stops Increased output Reduced specific power Reduced quality variability Material Components Product fineness Grinding system Equipment Efficiency Vertical Mill Ball Mill Material Components 1 On milling plants fed by a segregated feed supply, such as a stockpile, the varying size and hardness of the mill feed material affects the residence time in the mill and the power drawn. Case Study Snapshot Coal 50 t/h (Mill Rated Capacity) Pet-Coke 36 t/h (Mill Rated Capacity) Separator Feed Size F80 127 to 180 mm Grindability 17 to 26 kwh/t
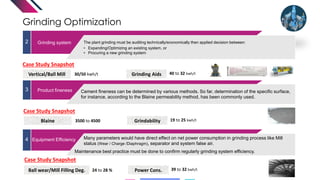
- 19. Grinding Optimization Grinding system2 The plant grinding must be auditing technically/economically then applied decision between: • Expanding/Optimizing an existing system, or • Procuring a new grinding system Product fineness3 Cement fineness can be determined by various methods. So far, determination of the specific surface, for instance, according to the Blaine permeability method, has been commonly used. Equipment Efficiency4 Many parameters would have direct effect on net power consumption in grinding process like Mill status (Wear / Charge /Diaphragm), separator and system false air. Blaine 3500 to 4500 Grindability 19 to 25 kwh/t Case Study Snapshot Vertical/Ball Mill 30/50 kwh/t Grinding Aids 40 to 32 kwh/t Case Study Snapshot Ball wear/Mill Filling Deg. 24 to 28 % Power Cons. 39 to 32 kwh/t Case Study Snapshot Maintenance best practice must be done to confirm regularly grinding system efficiency.
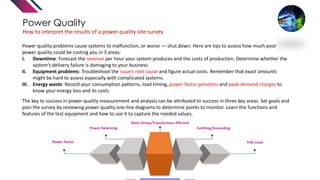
- 20. Power Quality How to interpret the results of a power quality site survey Power quality problems cause systems to malfunction, or worse — shut down. Here are tips to assess how much poor power quality could be costing you in 3 areas: I. Downtime: Forecast the revenue per hour your system produces and the costs of production. Determine whether the system’s delivery failure is damaging to your business. II. Equipment problems: Troubleshoot the issue’s root cause and figure actual costs. Remember that exact amounts might be hard to assess especially with complicated systems. III. Energy waste: Record your consumption patterns, load timing, power factor penalties and peak demand charges to know your energy loss and its costs. The key to success in power quality measurement and analysis can be attributed to success in three key areas. Set goals and plan the survey by reviewing power quality one-line diagrams to determine points to monitor. Learn the functions and features of the test equipment and how to use it to capture the needed values. Main Drives/Transformers Efficient Power Factor Power Balancing THD Level Earthing/Grounding
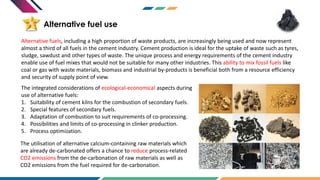
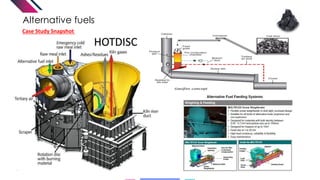
- 21. Alternative fuel use Alternative fuels, including a high proportion of waste products, are increasingly being used and now represent almost a third of all fuels in the cement industry. Cement production is ideal for the uptake of waste such as tyres, sludge, sawdust and other types of waste. The unique process and energy requirements of the cement industry enable use of fuel mixes that would not be suitable for many other industries. This ability to mix fossil fuels like coal or gas with waste materials, biomass and industrial by-products is beneficial both from a resource efficiency and security of supply point of view. The integrated considerations of ecological-economical aspects during use of alternative fuels: 1. Suitability of cement kilns for the combustion of secondary fuels. 2. Special features of secondary fuels. 3. Adaptation of combustion to suit requirements of co-processing. 4. Possibilities and limits of co-processing in clinker production. 5. Process optimization. The utilisation of alternative calcium-containing raw materials which are already de-carbonated offers a chance to reduce process-related CO2 emissions from the de-carbonation of raw materials as well as CO2 emissions from the fuel required for de-carbonation.
- 22. Variety of alternative fuels Characteristics Fuel Lower heat value (GJ/DT) Moisture or Water content (%) Ash Content (%) C content (% by dry wt) Carbon Emissions Factor (Ton C/ ton of fuel) Agriculture Biomass Rice Husk 13.2 – 16.2 10 20.6 38.80 0.35 Wheat Straw 15.8 – 18.2 7.3 – 14.2 4.5 – 8.9 44.9 – 48.8 0.42 Corn Stover 15.4 9.41 – 35 3.2 – 7.4 42.5 0.28 Sugarcane Leaves 15.8 <15 7.7 39.8 0.34 Waste Wood 15.5 – 17.4 33.3 0.9 50 0.33 – 0.49 Animal Waste 16 – 19 15 - 34 0.29 Dewatered Sewage Sludge 10.5 – 29 75 21.8 30 – 53.92 0.21 – 0.39 Petroleum-Based waste Tires 27.8 – 37.1 0.3 - - 0.56 Waste Oils 21.6 5 - 46 0.44 Polypropylene 46 2.1 27.4 71 0.7 Petroleum Coke (Petcoke) 18.9 – 33.7 0.4 0.5 – 1.0 82 – 87 0.5 – 0.9
- 23. Alternative fuels Case Study Snapshot HOTDISC
- 24. Clinker Substitution Innovation and quality optimisation remain key objectives for the cement industry. The currently acquisition of modern plant and processes allows to produce highly quality- assured cementitious products. State-of-the-art online sampling combined with X-ray fluorescence (XRF) and quantitative X-ray diffraction (XRD) enable to remain at the forefront in terms of product quality and consistency. Clinker can be blended with a range of alternative materials, including pozzolana, finely ground limestone and waste materials or industrial by- products. The clinker-to-cement ratio (percentage of clinker compared to other non- clinker components) has an impact on the properties of cement so standards determine the type and proportion of alternative main constituents that can be used. There are a number of factors that can limit the use of alternative cementitious materials as a clinker substitute, including: availability, physical and chemical properties, national standards and building codes and market acceptance. National/International Standards Guide ES 4756 -1 :2013 BS EN 197 -1 :2011 PhysicalTest Fineness m2/kg - ChemicalAnalysis SiO2 - SO3 - Setting time Minutes Initial - IR - LOI - Final AI2O3 - C3A - Comprehensive Strength (Mpa) 2 days - Fe2O3 - Cl ¯ - 7 days - CaO - Na2O - 28 days - MgO - ASTM C150 / C150M to 17 AS 3972-2010
- 25. Alternative Cementitious Materials Clinker substitute Source Positive Characteristics Limiting Characteristics Limestone Quarries Improved Workability Maintaining strength may require additional power for grinding clinker Fly ash Flue gases from coal-fired furnaces Lower water demand, improved workability, higher long term strength, better durability Lower early strength, availability may be reduced by change in fuel sources by the power sector Ground blast furnace slag Iron or steel production Higher long term strength and improved chemical resistance Lower early strength and higher electric power demand for grinding Natural pozzolana, rice husk ash, silica fume Volcanoes, some sedimentary rocks, other industries Demonstrate better workability, higher long term strength and improved chemical resistance Most natural pozzolana lead to reduced early strength, cement properties may vary significantly Artificial Pozzolana Specific Manufacture Similar to natural pozzolana Calcination requires extra thermal energy and so reduces positive CO2 abatement effect Source: ECRA Technology Papers (2009)
- 26. Alternative Cementitious Materials A list of credentials that should addressed when examining the sustainability of a material is provided: • Energy required to produce the material. • CO2 emissions resulting from the material’s manufacture. • Toxicity of the material. • Transportation of the material during its manufacturing and delivery. • Degree of pollution resulting from the material at the end of its useful life. • Maintenance required and the materials required for maintenance. • Lifetime of the material and its potential for reuse if the building is demolished. A Wayne State University researcher has developed a novel method to make sustainable Hybrid Green Cements (HGC) from low cost minerals and waste minerals such as coal, ash, bio-mass ash, or mine tailings. Key issues that the researcher has identified include optimal ranges of hybrid mix compositions, processing, and curing conditions. Several parallel novel cement types are being developed including: • Magnesium silicates rather than limestone (calcium carbonate). • Calcium sulfo-aluminate belite binders. • A mixture of calcium and magnesium carbonates and calcium and magnesium hydroxides. • New production techniques, using an autoclave instead of a kiln and a special activation grinding that requires far less heat and reduces process emissions. • Dolomite rock rapidly calcined in superheated steam, using a separate CO2-scrubbing system to capture emissions. • Geo-polymers using by-products from the power industry (fly ash, bottom ash), steel industry (blast-furnace slag), and concrete to make alkali-activated cements. • Geo-polymer cements have been commercialised in small-scale facilities, but have not yet been used for large-scale applications.
- 27. Carbon capture and storage (CCS) Producing one tonne of cement releases an estimated 0.73 to 0.99 t CO2 depending on the clinker-per-cement ratio and other factors. A major difference between the cement industry and most other industries is that fuel consumption is not the dominant driver of CO2 emissions. More than 50 percent of the CO2 released during cement manufacture, or approximately 540 kilograms (kg) CO2 per t of clinker (WBCSD 2009), is from calcination, in which CaCO3 is transformed into lime (CaO) in the following reaction: CaCO3 + Heat ➝ CaO + CO2 There is global agreement to reduce emissions and limit increases in temperatures to two degrees Celsius by 2100, with the need to stem the peak in emissions as soon as possible. Carbon capture and storage (CCS) uses a group of known technologies to capture, transport and store carbon emissions from fossil fuel power plants and energy intensive industries like cement, steel and chemical production.
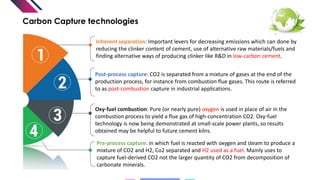
- 28. Carbon Capture technologies Post-process capture: CO2 is separated from a mixture of gases at the end of the production process, for instance from combustion flue gases. This route is referred to as post-combustion capture in industrial applications. Oxy-fuel combustion: Pure (or nearly pure) oxygen is used in place of air in the combustion process to yield a flue gas of high-concentration CO2. Oxy-fuel technology is now being demonstrated at small-scale power plants, so results obtained may be helpful to future cement kilns. Inherent separation: Important levers for decreasing emissions which can done by reducing the clinker content of cement, use of alternative raw materials/fuels and finding alternative ways of producing clinker like R&D in low-carbon cement. Pre-process capture: in which fuel is reacted with oxygen and steam to produce a mixture of CO2 and H2, Co2 separated and H2 used as a fuel. Mainly uses to capture fuel-derived CO2 not the larger quantity of CO2 from decomposition of carbonate minerals.
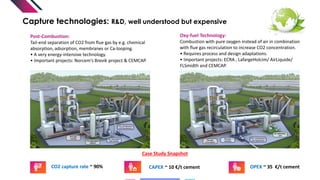
- 29. Capture technologies: R&D, well understood but expensive Post-Combustion: Tail-end separation of CO2 from flue gas by e.g. chemical absorption, adsorption, membranes or Ca-looping. • A very energy-intensive technology. • Important projects: Norcem‘s Brevik project & CEMCAP. Oxy-fuel Technology: Combustion with pure oxygen instead of air in combination with flue gas recirculation to increase CO2 concentration. • Requires process and design adaptations. • Important projects: ECRA , LafargeHolcim/ AirLiquide/ FLSmidth and CEMCAP. Case Study Snapshot CAPEX ~ 10 €/t cement OPEX ~ 35 €/t cementCO2 capture rate ~ 90%
- 30. Turning CO2 into a Valuable Asset CO2 to methane using H2 By adding carbon dioxide to waste to give it commercial value. It’s solution called Accelerated Carbonation Technology (ACT) that is a rapid, cost-effective treatment suitable for soil and waste. Examples of wastes that have been successfully treated: Slag (from steel manufacture), MSWI ashes (bottom ash and APC residues), Galligu (from soap manufacture), Soils contaminated with pyrotechnics waste, Water treatment sludge and Quarry fines. CO2 to light weight aggregates By adding carbon dioxide to waste to give it commercial value. It’s solution called Accelerated Carbonation Technology (ACT) that is a rapid, cost-effective treatment suitable for soil and waste. Examples of wastes that have been successfully treated: Slag (from steel manufacture), MSWI ashes (bottom ash and APC residues), Galligu (from soap manufacture), Soils contaminated with pyrotechnics waste, Water treatment sludge and Quarry fines. Curbing emissions by 2050 will require a new greenfield and brownfield investments for CO2 capture-ready plants. These decisions have clear short term economic and political implications that must be carefully evaluated by all stakeholders and one of goals that is supported by The United Nations Framework Convention on Climate Change in the Paris Agreement. 1.5 to 2 degrees Celsius Scenario >>>> USD 100 billion per year
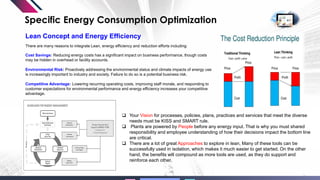
- 31. Specific Energy Consumption Optimization There are many reasons to integrate Lean, energy efficiency and reduction efforts including: Cost Savings: Reducing energy costs has a significant impact on business performance, though costs may be hidden in overhead or facility accounts. Environmental Risk: Proactively addressing the environmental status and climate impacts of energy use is increasingly important to industry and society. Failure to do so is a potential business risk. Competitive Advantage: Lowering recurring operating costs, improving staff morale, and responding to customer expectations for environmental performance and energy efficiency increases your competitive advantage. Lean Concept and Energy Efficiency Your Vision for processes, policies, plans, practices and services that meet the diverse needs must be KISS and SMART rule. Plants are powered by People before any energy input. That is why you must shared responsibility and employee understanding of how their decisions impact the bottom line are critical. There are a lot of great Approaches to explore in lean, Many of these tools can be successfully used in isolation, which makes it much easier to get started. On the other hand, the benefits will compound as more tools are used, as they do support and reinforce each other.
- 32. LEAN ENERGY MANAGEMENT Reduce the energy use could be done through some of lean activities such as the following: Energy Efficiencies: Look at your plant’s equipment to see if there are opportunities to improve . Energy Kaizen Events: Identify and implement employee ideas for saving energy and reducing wastes through rapid process improvement events. Total Productive Maintenance (TPM): Incorporate energy reduction best practices into day-to-day autonomous maintenance activities to ensure that equipment and processes run smoothly and efficiently. Right-Sized Equipment: Identify and replace oversized and inefficient equipment with smaller equipment tailored to the specific needs of manufacturing cells. Plant Layout and Flow: Design or rearrange plant layout to improve product flow while also reducing energy use and associated impacts. Standard Work, Visual Controls, Employee Engagement and Mistake-Proofing: Sustain and support additional Lean and energy performance gains through standardized work, procedures and visual signals that encourage energy conservation, and by making it easy or “mistake-proof” to be energy efficient.
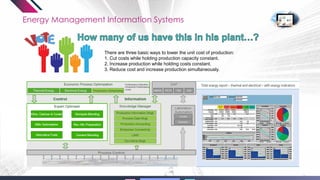
- 33. Energy Management Information Systems There are three basic ways to lower the unit cost of production: 1. Cut costs while holding production capacity constant. 2. Increase production while holding costs constant. 3. Reduce cost and increase production simultaneously.
- 34. Energy Management Information System Energy Management Information Systems (EMIS) can enable significant energy savings, often with rapid payback. Businesses are continually learning how to apply these technologies which include advanced energy information systems, benchmarking and utility tracking tools, equipment-specific fault detection and diagnostic systems and automated system optimization. EMIS Features Example: True Enterprise: Data quality assurance, data warehouse, web framework. Web Portal: Personalized dashboards, key performance indicators, charts, trends, real-time conditions. Reporting Engine: Rich and customized content, support for complex data and graphics, scheduled distribution. Trend Analysis: Advanced visualization, dimensional analysis, prediction, statistical roll-ups. Energy Modelling: Regression analysis, normalization, correlation, integration of all relevant drivers and contextual data. Bill Analysis: Built-in rate engine with rate wizard. Emissions Reporting: Reports on energy-related emissions from direct and indirect sources, aggregates all locations, breakdowns by fuel type, compares performance of business units, regions, buildings, facilities, departments. Cost Allocation: Allocates energy costs for all utility types to cost centre's’, departments, production lines, or for user-defined time periods. Power quality analysis: Wide-area event monitoring, classification, filtering, correlation. Integration: Import data for all consumed utilities (water, air, gas, electricity, steam), emissions, production or business process data from enterprise system databases (e.g. metering, BAC, ERP); export data to other enterprise business or automation systems.
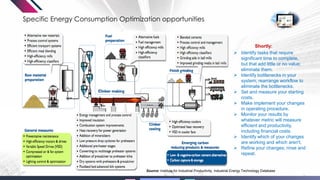
- 35. Specific Energy Consumption Optimization opportunities Shortly: Identify tasks that require significant time to complete, but that add little or no value; eliminate them. Identify bottlenecks in your system; rearrange workflow to eliminate the bottlenecks. Set and measure your starting costs. Make implement your changes in operating procedure. Monitor your results by whatever metric will measure efficient and productivity, including financial costs. Identify which of your changes are working and which aren't. Refine your changes; rinse and repeat. Source: Institute for Industrial Productivity, Industrial Energy Technology Database
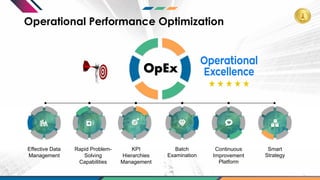
- 36. Operational Performance Optimization OpEx Effective Data Management Rapid Problem- Solving Capabilities KPI Hierarchies Management Batch Examination Continuous Improvement Platform Smart Strategy
- 37. Operational Performance Optimization Effective Data Management Rapid Problem-Solving Capabilities KPI Hierarchies Management Users spend 50% of their problem- solving time just collecting and preparing the data. In many cases, users report that it takes hours, if not days to perform these tasks. Automation can play a significant role in completing those tasks and others in the analysis workflows by supplementing the skills of users with best practice- based approaches to data conditioning. This is an area that receives little attention in the plans of many companies. Time is money. That’s especially true in the process industries where every minute of sub-par performance is an unrecoverable loss. The ability to rapidly hone in on root causes and take effective corrective action can mean the difference between minor and major losses due to a production disruption. Your manufacturing execution system (MES) infrastructure should have the ability to capture unstructured data, such as comments and annotations from production staff to provide context to support raw process data. You can’t improve what you don’t measure. It’s a philosophy that’s drilled into our heads in engineering classes and reinforced with lessons learned on the job. Measurement is not easy. Instruments drift. Communication links fail. Benchmarking assets across the enterprise can allow plants to better track and improve plant performance. An effective asset management program uses benchmarks to identify poor performing assets, and perhaps more importantly, to identify star performers and demonstrate the highest achievable levels of performance for an asset class.
- 38. Operational Performance Optimization Batch Examination Continuous Improvement Platform SMART Strategy Effective batch analysis depends on the ability to capture, align and analyse information with complete context. Understanding batch variability—over time, within batch and batch-to-batch—can be improved through batch overlay capabilities. Your analytics model should provide the ability to create alarms for significant batch deviations that may lead to poor product quality, while correlating process behaviours, with product characteristics in your best batches, should provide the ability to consistently produce an excellent product. The tools for routine reporting are very different than those needed for ad hoc problem solving. The Lean Enterprise Institute has a nice, concise description of the differences between ad hoc problem solving and lean daily management. Toyota Way brought the concept to a wider audience, says the philosophy comes down to four Ps: 1. Philosophy: Think long-term. 2. Process: Eliminate waste in value streams. 3. People: Develop, grow and challenge employees. 4. Problem-solving: Engage employees in continuous learning. SMART is the acronym Francis T. Hartman, coined for his style of management: ■ SM = Strategically Managed ■ A = Aligned ■ R = Regenerative work environment ■ T = Transitional management. SMART is a way to work at the serious business of getting projects done. It focuses on the goals while letting team members create innovative solutions. Be smart and keep it simple as can as possible.
- 39. World Class Certification Rewards A profession indicates that the application of knowledge, processes, skills, tools, and techniques can have a significant impact on project success. Management Any decision making will upon your examination results which will be the drivers of the performance roadmap. So, it is very important to be sure that is your examination style performed in correct, efficient and right way. Examination Formulation, publication, and implementation of guidelines, rules, and specifications for common and repeated use, aimed at achieving optimum degree of order or uniformity in a given context, discipline, or field. Standardization Value Improving/Best Practices in conjunction with a systematic Management Process can help achieve World Class Performance. Implementation of these practices can optimize cost, schedule, performance and safety aspects of any project. World Class Certification ENERGY STAR Plant The Energy Performance Indicator (EPI) of Energy Star Plant will help your company improve its energy efficiency by comparing your energy performance to similar cement manufacturing plants in the U.S. The spreadsheet includes instructions for using the EPI, a State of Energy Performance form, and a Facility Performance Report. Manufacturing plants that earn a 75 or higher using this EPI are eligible to earn the ENERGY STAR certification for superior energy performance.
- 40. All References available, Be In Touch March 2018