Energy Efficiency of Industrial Utilities
•Download as PPTX, PDF•
2 likes•1,633 views

This document discusses energy efficiency and auditing of industrial utilities. It begins by defining energy efficiency as reducing energy input without negatively affecting output. The objectives of industrial energy efficiency are outlined as minimizing costs and energy waste, optimizing energy use, improving environmental performance, and enhancing reputation. Key industrial utilities discussed include boilers, furnaces, electric motors, pumps, compressors, and HVAC systems. Methods of assessing the efficiency of these systems and opportunities for improved energy efficiency are also presented.
Report
Share


Energy Efficiency of Industrial Utilities
- 1. Presented by: Pratap Jung Rai Institute of Engineering, Thapathali Campus, Nepal 11/16/20141
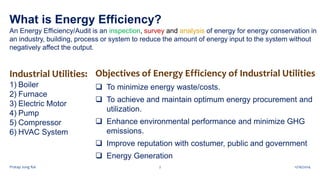
- 2. What is Energy Efficiency? An Energy Efficiency/Audit is an inspection, survey and analysis of energy for energy conservation in an industry, building, process or system to reduce the amount of energy input to the system without negatively affect the output. Objectives of Energy Efficiency of Industrial Utilities To minimize energy waste/costs. To achieve and maintain optimum energy procurement and utilization. Enhance environmental performance and minimize GHG emissions. Improve reputation with costumer, public and government Energy Generation Industrial Utilities: 1) Boiler 2) Furnace 3) Electric Motor 4) Pump 5) Compressor 6) HVAC System 11/16/2014Pratap Jung Rai 2
- 3. Types of Energy Audit 1) Preliminary Energy Audit Shortly, called Walk-Through Audit. Its name implies, is a tour of the facility to visually inspect each of the energy using systems. 2) Targeted Energy Audit It often results from preliminary audits. They provide data and detailed analysis on specified target projects. For example, industries may target its lighting system or boiler system. 3) Detailed Energy Audit It is a comprehensive audit and results in a detailed energy project implementation plan for a facility, since it accounts for the energy use of all major equipment. Detailed energy auditing is carried out in three phases a) Pre-audit Phase b) Audit Phase c) Post-Audit Methodology of Energy Efficiency Pratap Jung Rai 4 Source: UNEP
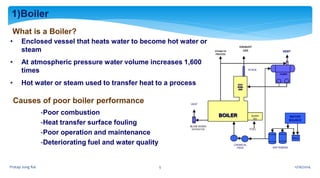
- 4. 1)Boiler What is a Boiler? • Enclosed vessel that heats water to become hot water or steam • At atmospheric pressure water volume increases 1,600 times • Hot water or steam used to transfer heat to a process BURN ER WATER SOURCE Brine SOFTENERS CHEMICAL FEED FUEL BLOW DOWN SEPARATOR VENT VENT EXHAUST GASSTEAM TO PROCESS STACK PUMPS BOILER ECO- NOMI- ZER -Poor combustion -Heat transfer surface fouling -Poor operation and maintenance -Deteriorating fuel and water quality Causes of poor boiler performance 11/16/2014Pratap Jung Rai 5
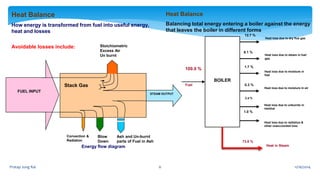
- 5. Heat in Steam BOILER Heat loss due to dry flue gas Heat loss due to steam in fuel gas Heat loss due to moisture in fuel Heat loss due to unburnts in residue Heat loss due to moisture in air Heat loss due to radiation & other unaccounted loss 12.7 % 8.1 % 1.7 % 0.3 % 1.0 % 100.0 % Fuel 73.8 % 2.4 % Heat Balance Balancing total energy entering a boiler against the energy that leaves the boiler in different forms Heat Balance How energy is transformed from fuel into useful energy, heat and losses Avoidable losses include: Stoichiometric Excess Air Un burnt FUEL INPUT STEAM OUTPUT Stack Gas Ash and Un-burnt parts of Fuel in Ash Blow Down Convection & Radiation 11/16/2014Pratap Jung Rai 6 Energy flow diagram
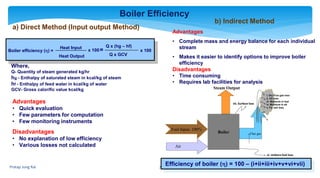
- 6. Boiler Flue gas Steam Output Efficiency = 100 – (i + ii + iii + iv + v + vi + vii) Air Fuel Input, 100% i. Dry Flue gas loss ii. H2 loss iii. Moisture in fuel iv. Moisture in air v. Fly ash loss vii. Surface loss vi. Unborn fuel loss Boiler efficiency () = Heat Input Heat Output x 100 Q x (hg – hf) Q x GCV x 100= Where, Q- Quantity of steam generated kg/hr hg - Enthalpy of saturated steam in kcal/kg of steam hf - Enthalpy of feed water in kcal/kg of water GCV- Gross calorific value kcal/kg Boiler Efficiency a) Direct Method (Input output Method) b) Indirect Method Advantages • Complete mass and energy balance for each individual stream • Makes it easier to identify options to improve boiler efficiency Disadvantages • Time consuming • Requires lab facilities for analysis Advantages • Quick evaluation • Few parameters for computation • Few monitoring instruments Disadvantages • No explanation of low efficiency • Various losses not calculated Efficiency of boiler () = 100 – (i+ii+iii+iv+v+vi+vii)Pratap Jung Rai 7
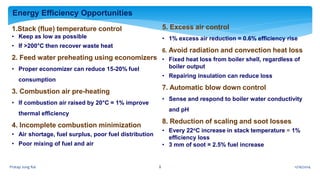
- 7. 1.Stack (flue) temperature control • Keep as low as possible • If >200°C then recover waste heat 2. Feed water preheating using economizers • Proper economizer can reduce 15-20% fuel consumption 3. Combustion air pre-heating • If combustion air raised by 20°C = 1% improve thermal efficiency 4. Incomplete combustion minimization • Air shortage, fuel surplus, poor fuel distribution • Poor mixing of fuel and air Energy Efficiency Opportunities 5. Excess air control • 1% excess air reduction = 0.6% efficiency rise 6. Avoid radiation and convection heat loss • Fixed heat loss from boiler shell, regardless of boiler output • Repairing insulation can reduce loss 7. Automatic blow down control • Sense and respond to boiler water conductivity and pH 8. Reduction of scaling and soot losses • Every 22oC increase in stack temperature = 1% efficiency loss • 3 mm of soot = 2.5% fuel increase 11/16/2014Pratap Jung Rai 8
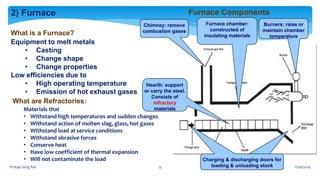
- 8. 2) Furnace What is a Furnace? Equipment to melt metals • Casting • Change shape • Change properties Low efficiencies due to • High operating temperature • Emission of hot exhaust gases Furnace Components Furnace chamber: constructed of insulating materials Hearth: support or carry the steel. Consists of refractory materials Burners: raise or maintain chamber temperature Chimney: remove combustion gases Charging & discharging doors for loading & unloading stock Charging & discharging doors for loading & unloading stock Materials that • Withstand high temperatures and sudden changes • Withstand action of molten slag, glass, hot gases • Withstand load at service conditions • Withstand abrasive forces • Conserve heat • Have low coefficient of thermal expansion • Will not contaminate the load What are Refractories: 11/16/2014Pratap Jung Rai 9
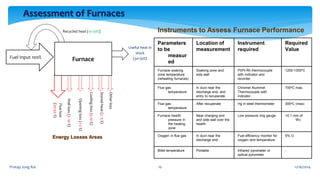
- 9. Assessment of Furnaces Fuel Input 100% Useful heat in stock (30-50%) Wallloss(3-10%) Flueloss (20-50%) Openingloss(1-2%) Coolingloss(5-10%) Storedheat(2-5%) Otherloss Recycled heat (10-30%) Furnace Parameters to be measur ed Location of measurement Instrument required Required Value Furnace soaking zone temperature (reheating furnaces) Soaking zone and side wall Pt/Pt-Rh thermocouple with indicator and recorder 1200-1300oC Flue gas temperature In duct near the discharge end, and entry to recuperate Chromel Alummel Thermocouple with indicator 700oC max. Flue gas temperature After recuperate Hg in steel thermometer 300oC (max) Furnace hearth pressure in the heating zone Near charging end and side wall over the hearth Low pressure ring gauge +0.1 mm of Wc Oxygen in flue gas In duct near the discharge end Fuel efficiency monitor for oxygen and temperature 5% O2 Billet temperature Portable Infrared pyrometer or optical pyrometer - Instruments to Assess Furnace Performance 11/16/2014Pratap Jung Rai 10 Energy Losses Areas
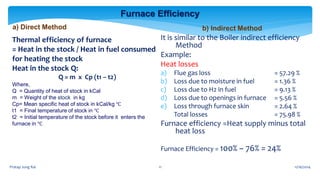
- 10. Furnace Efficiency a) Direct Method Thermal efficiency of furnace = Heat in the stock / Heat in fuel consumed for heating the stock Heat in the stock Q: Q = m x Cp (t1 – t2) Where, Q = Quantity of heat of stock in kCal m = Weight of the stock in kg Cp= Mean specific heat of stock in kCal/kg ℃ t1 = Final temperature of stock in ℃ t2 = Initial temperature of the stock before it enters the furnace in ℃ b) Indirect Method It is similar to the Boiler indirect efficiency Method Example: Heat losses a) Flue gas loss = 57.29 % b) Loss due to moisture in fuel = 1.36 % c) Loss due to H2 in fuel = 9.13 % d) Loss due to openings in furnace = 5.56 % e) Loss through furnace skin = 2.64 % Total losses = 75.98 % Furnace efficiency =Heat supply minus total heat loss Furnace Efficiency = 100% – 76% = 24% 11/16/2014Pratap Jung Rai 11
- 11. 1. Complete combustion with minimum excess air 2. Proper heat distribution 3. Operation at the optimum furnace temperature 4. Reducing heat losses from furnace openings 5. Maintaining correct amount of furnace draft 6. Optimum capacity utilization 7. Waste heat recovery from the flue gases 8. Minimize furnace skin losses 9. Use of ceramic coatings 10. Selecting the right refractories Energy Efficiency Opportunities 11/16/2014Pratap Jung Rai 12
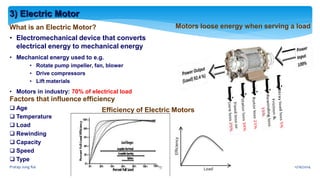
- 12. What is an Electric Motor? • Electromechanical device that converts electrical energy to mechanical energy • Mechanical energy used to e.g. • Rotate pump impeller, fan, blower • Drive compressors • Lift materials • Motors in industry: 70% of electrical load 3) Electric Motor Motors loose energy when serving a load Factors that influence efficiency Age Temperature Load Rewinding Capacity Speed Type Efficiency of Electric Motors 11/16/2014Pratap Jung Rai 13 Load Efficiency
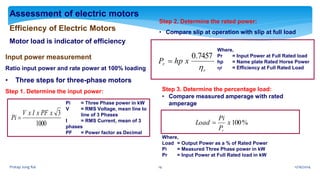
- 13. Assessment of electric motors Efficiency of Electric Motors Motor load is indicator of efficiency Input power measurement Ratio input power and rate power at 100% loading • Three steps for three-phase motors Step 1. Determine the input power: Pi = Three Phase power in kW V = RMS Voltage, mean line to line of 3 Phases I = RMS Current, mean of 3 phases PF = Power factor as Decimal 1000 3xPFxIxV Pi Step 2. Determine the rated power: • Compare slip at operation with slip at full load r r xhpP 7457.0 Where, Pr = Input Power at Full Rated load hp = Name plate Rated Horse Power r = Efficiency at Full Rated Load Step 3. Determine the percentage load: • Compare measured amperage with rated amperage Where, Load = Output Power as a % of Rated Power Pi = Measured Three Phase power in kW Pr = Input Power at Full Rated load in kW %100x P Pi Load r 11/16/2014Pratap Jung Rai 14
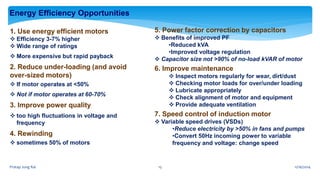
- 14. Energy Efficiency Opportunities 1. Use energy efficient motors Efficiency 3-7% higher Wide range of ratings More expensive but rapid payback 2. Reduce under-loading (and avoid over-sized motors) If motor operates at <50% Not if motor operates at 60-70% 3. Improve power quality too high fluctuations in voltage and frequency 4. Rewinding sometimes 50% of motors 5. Power factor correction by capacitors Benefits of improved PF •Reduced kVA •Improved voltage regulation Capacitor size not >90% of no-load kVAR of motor 6. Improve maintenance Inspect motors regularly for wear, dirt/dust Checking motor loads for over/under loading Lubricate appropriately Check alignment of motor and equipment Provide adequate ventilation 7. Speed control of induction motor Variable speed drives (VSDs) •Reduce electricity by >50% in fans and pumps •Convert 50Hz incoming power to variable frequency and voltage: change speed 11/16/2014Pratap Jung Rai 15
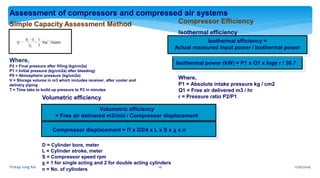
- 15. Assessment of compressors and compressed air systems Simple Capacity Assessment Method Where, P2 = Final pressure after filling (kg/cm2a) P1 = Initial pressure (kg/cm2a) after bleeding) P0 = Atmospheric pressure (kg/cm2a) V = Storage volume in m3 which includes receiver, after cooler and delivery piping T = Time take to build up pressure to P2 in minutes Compressor Efficiency Isothermal efficiency Where, P1 = Absolute intake pressure kg / cm2 Q1 = Free air delivered m3 / hr r = Pressure ratio P2/P1 Isothermal power (kW) = P1 x Q1 x loge r / 36.7 Isothermal efficiency = Actual measured input power / Isothermal power Volumetric efficiency D = Cylinder bore, meter L = Cylinder stroke, meter S = Compressor speed rpm χ = 1 for single acting and 2 for double acting cylinders n = No. of cylinders Volumetric efficiency = Free air delivered m3/min / Compressor displacement Compressor displacement = Π x D2/4 x L x S x χ x n 11/16/2014Pratap Jung Rai 16
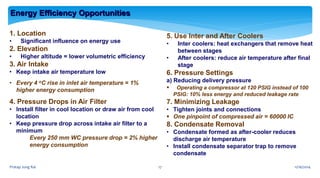
- 16. 1. Location • Significant influence on energy use 2. Elevation • Higher altitude = lower volumetric efficiency 3. Air Intake • Keep intake air temperature low • Every 4 oC rise in inlet air temperature = 1% higher energy consumption 4. Pressure Drops in Air Filter • Install filter in cool location or draw air from cool location • Keep pressure drop across intake air filter to a minimum Every 250 mm WC pressure drop = 2% higher energy consumption 5. Use Inter and After Coolers • Inter coolers: heat exchangers that remove heat between stages • After coolers: reduce air temperature after final stage 6. Pressure Settings a) Reducing delivery pressure Operating a compressor at 120 PSIG instead of 100 PSIG: 10% less energy and reduced leakage rate 7. Minimizing Leakage • Tighten joints and connections One pinpoint of compressed air = 60000 IC 8. Condensate Removal • Condensate formed as after-cooler reduces discharge air temperature • Install condensate separator trap to remove condensate Energy Efficiency Opportunities 11/16/2014Pratap Jung Rai 17
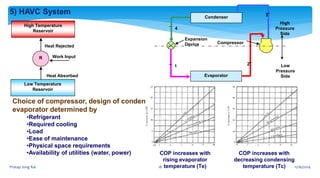
- 17. 5) HAVC System High Temperature Reservoir Low Temperature Reservoir R Work Input Heat Absorbed Heat Rejected Condenser Evaporator High Pressure Side Low Pressure Side Compressor Expansion Device 1 2 3 4 Choice of compressor, design of condenser, evaporator determined by •Refrigerant •Required cooling •Load •Ease of maintenance •Physical space requirements •Availability of utilities (water, power) COP increases with rising evaporator temperature (Te) COP increases with decreasing condensing temperature (Tc) 11/16/2014Pratap Jung Rai 18
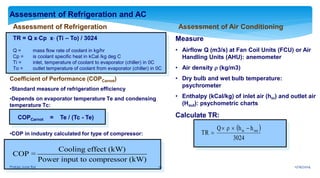
- 18. Assessment of Refrigeration and AC Assessment of Refrigeration TR = Q xCp x (Ti – To) / 3024 Q = mass flow rate of coolant in kg/hr Cp = is coolant specific heat in kCal /kg deg C Ti = inlet, temperature of coolant to evaporator (chiller) in 0C To = outlet temperature of coolant from evaporator (chiller) in 0C Coefficient of Performance (COPCarnot) •Standard measure of refrigeration efficiency •Depends on evaporator temperature Te and condensing temperature Tc: •COP in industry calculated for type of compressor: COPCarnot = Te / (Tc - Te) Cooling effect (kW) COP = Power input to compressor (kW) Assessment of Air Conditioning 3024 hhρQ TR outin Measure • Airflow Q (m3/s) at Fan Coil Units (FCU) or Air Handling Units (AHU): anemometer • Air density (kg/m3) • Dry bulb and wet bulb temperature: psychrometer • Enthalpy (kCal/kg) of inlet air (hin) and outlet air (Hout): psychometric charts Calculate TR: 11/16/2014Pratap Jung Rai 19
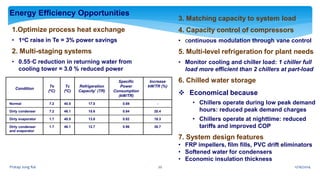
- 19. Energy Efficiency Opportunities 1.Optimize process heat exchange • 1oC raise in Te = 3% power savings 2. Multi-staging systems • 0.55◦C reduction in returning water from cooling tower = 3.0 % reduced power Condition Te (0C) Tc (0C) Refrigeration Capacity* (TR) Specific Power Consumption (kW/TR) Increase kW/TR (%) Normal 7.2 40.5 17.0 0.69 - Dirty condenser 7.2 46.1 15.6 0.84 20.4 Dirty evaporator 1.7 40.5 13.8 0.82 18.3 Dirty condenser and evaporator 1.7 46.1 12.7 0.96 38.7 3. Matching capacity to system load 4. Capacity control of compressors • continuous modulation through vane control 5. Multi-level refrigeration for plant needs • Monitor cooling and chiller load: 1 chiller full load more efficient than 2 chillers at part-load 6. Chilled water storage Economical because • Chillers operate during low peak demand hours: reduced peak demand charges • Chillers operate at nighttime: reduced tariffs and improved COP 7. System design features • FRP impellers, film fills, PVC drift eliminators • Softened water for condensers • Economic insulation thickness 11/16/2014Pratap Jung Rai 20
- 20. Thank You 11/16/2014Pratap Jung Rai 21
Editor's Notes
- “Energy Audit means the verification, monitoring and analysis of use of energy including submission of technical report containing recommendations for improving energy efficiency with cost benefit analysis and an action plan to reduce energy consumption.”
- A boiler is an enclosed vessel that provides a means for combustion heat to be transferred to water until it becomes heated water or steam. When water at atmospheric pressure is boiled into steam its volume increases about 1,600 times, producing a force that is almost as explosive as gunpowder. This causes the boiler to be an equipment that must be treated with utmost care The hot water or steam under pressure is then usable for transferring the heat to a process.
- Stack (flue) temperature control Keep as low as possible If >200°C then recover waste heat 2. Feed water preheating using economizers Proper economizer can reduce 15-20% fuel consumption 3. Combustion air pre-heating If combustion air raised by 20°C = 1% improve thermal efficiency 4. Incomplete combustion minimization Air shortage, fuel surplus, poor fuel distribution Poor mixing of fuel and air 5. Excess air control 1% excess air reduction = 0.6% efficiency rise 6. Avoid radiation and convection heat loss Fixed heat loss from boiler shell, regardless of boiler output Repairing insulation can reduce loss 7. Automatic blow down control Sense and respond to boiler water conductivity and pH 8. Reduction of scaling and soot losses Every 22oC increase in stack temperature = 1% efficiency loss 3 mm of soot = 2.5% fuel increase
- A furnace’s efficiency increases when the percentage of heat that is transferred to the stock or load inside the furnace increases. The efficiency of the furnace can be calculated in two ways, similar to that of the boiler: direct method and indirect method. Direct method The efficiency of a furnace can be determined by measuring the amount heat absorbed by the stock and dividing this by the total amount of fuel consumed. Thermal efficiency of the furnace =Heat in the stock / Heat in the fuel consumed for heating the stock The quantity of heat (Q) that will be transferred to stock can be calculated with this equation: Q = m x Cp (t1 – t2) Where, Q = Quantity of heat of stock in kCal m = Weight of the stock in kg Cp= Mean specific heat of stock in kCal/kg oC t1 = Final temperature of stock in oC t2 = Initial temperature of the stock before it enters the furnace in oC The furnace efficiency can also be determined through the indirect method, similar to the evaluation of boiler efficiency. The principle is simple: the heat losses are subtracted from the heat supplied to the furnace. (Note that a detailed methodology to calculate each individual heat loss is provided in the chapter) Adding the losses a to f up gives the total losses: Flue gas loss = 57.29 % Loss due to moisture in fuel = 1.36 % Loss due to H2 in fuel = 9.13 % Loss due to openings in furnace = 5.56 % Loss through furnace skin = 2.64 % Total losses = 75.98 % (Click once) The furnace efficiency calculated through the indirect method = 100 – 75.98 = 24.02%
- Motor performance is affected considerably by the quality of input power, which is determined by the actual volts and frequency compared to rated values. Fluctuation in voltage and frequency much larger than the accepted values has detrimental impacts on motor performance. Voltage unbalance can be even more detrimental to motor performance and occurs when the voltages in the three phases of a three-phase motor are not equal. Several factors can affect voltage balance: single-phase loads on any one phase, different cable sizing, or faulty circuits. An unbalanced system increases distribution system losses and reduces motor efficiency. An example of the effect of voltage unbalance on motor performance is shown in the table. Give one example: small voltage unbalances are acceptable but, for example, a voltage unbalance of 5.4% results in a temperature increase of 40oC!!!
- The refrigeration cycle is shown in the Figure and can be broken down into the following stages (note to the trainer: the next slides will explain what is happening between 1 to 4)