Heat Treatment: Lecture Q&P, M3 concept
•Download as PPTX, PDF•
4 likes•2,201 views

1. The document discusses the Schaeffler diagram, which is used to predict the microstructure of stainless steel welds based on their composition. It also discusses modifications to the diagram by Delong. 2. The M3 concept for developing third generation advanced high strength steels is described, which aims to achieve ultrahigh strength and ductility through a multi-phase, meta-stable, multi-scale microstructure. 3. Quenching and partitioning heat treatments are summarized as a novel method to produce multi-phase steels with significant retained austenite through quenching to form martensite and austenite, followed by an isothermal treatment to partition carbon into the a
Report
Share

Heat Treatment: Lecture Q&P, M3 concept
- 1. 1. Schaeffler diagram 2. M3 Concept 3. Quenching & Partitioning Heat Treatments 1 Lecture Series- C
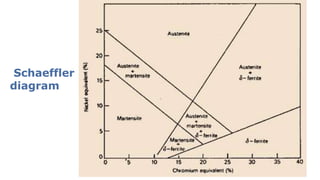
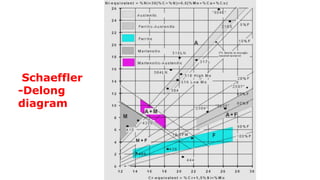
- 2. 2 • The Schaeffler diagram is an important tool for predicting the constitution of austenitic Cr-Ni steel welds with carbon contents up to 0.12%. However, it does not allow determination of the composition and volume • of the carbide phase. • This Schaeffler diagram is especially suited to weld metals in order to predict the structure. Schaeffler diagram
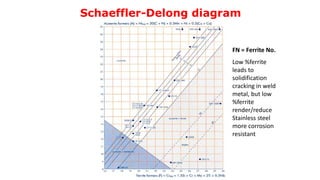
- 3. Schaeffler and Delong diagrams are used to predict structure on the basis of alloying elements. (Stainless Steel Weld) Plots the compositional limits at room temperature of austenite, ferrite and martensite, in terms of nickel and chromium equivalents The Cr and Ni equivalent can be empirically determined as: Cr equivalent = (Cr) + 2(Si) + 1.5(Mo) + 5(V) + 5.5(Al) + 1.75(Nb) + 1.5(Ti) + 0.75(W) Ni equivalent = (Ni) + (Co) + 0.5(Mn) + 0.3(Cu) + 25(N) + 30(C)
- 4. 4 Chrome and nickel are among the most important alloying elements here. All ferrite formers have a chromium equivalent and all austenite formers a nickel equivalent.
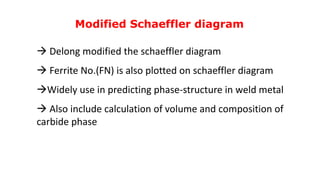
- 6. Modified Schaeffler diagram Delong modified the schaeffler diagram Ferrite No.(FN) is also plotted on schaeffler diagram Widely use in predicting phase-structure in weld metal Also include calculation of volume and composition of carbide phase
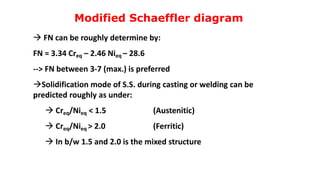
- 7. Modified Schaeffler diagram FN can be roughly determine by: FN = 3.34 Creq – 2.46 Nieq – 28.6 --> FN between 3-7 (max.) is preferred Solidification mode of S.S. during casting or welding can be predicted roughly as under: Creq/Nieq < 1.5 (Austenitic) Creq/Nieq > 2.0 (Ferritic) In b/w 1.5 and 2.0 is the mixed structure
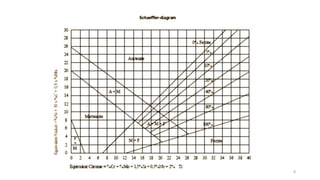
- 8. 8
- 9. Schaeffler-Delong diagram FN = Ferrite No. Low %ferrite leads to solidification cracking in weld metal, but low %ferrite render/reduce Stainless steel more corrosion resistant
- 11. M3 Concept
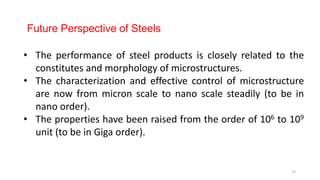
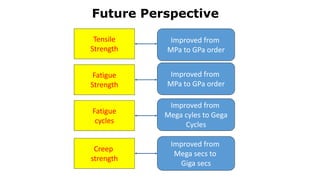
- 12. 12 • The performance of steel products is closely related to the constitutes and morphology of microstructures. • The characterization and effective control of microstructure are now from micron scale to nano scale steadily (to be in nano order). • The properties have been raised from the order of 106 to 109 unit (to be in Giga order). Future Perspective of Steels
- 13. Future Perspective Tensile Strength Fatigue Strength Fatigue cycles Creep strength Improved from MPa to GPa order Improved from MPa to GPa order Improved from Mega cyles to Gega Cycles Improved from Mega secs to Giga secs
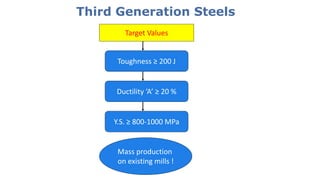
- 14. Third Generation Steels Toughness ≥ 200 J Ductility ‘A’ ≥ 20 % Y.S. ≥ 800-1000 MPa Target Values Mass production on existing mills !
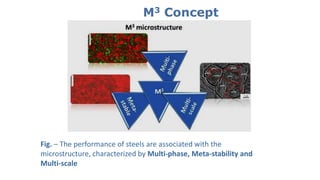
- 15. M3 Concept Fig. – The performance of steels are associated with the microstructure, characterized by Multi-phase, Meta-stability and Multi-scale
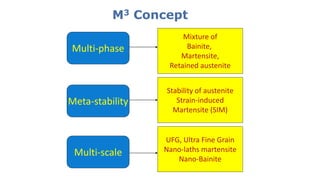
- 16. M3 Concept Multi-phase Meta-stability Multi-scale Mixture of Bainite, Martensite, Retained austenite Stability of austenite Strain-induced Martensite (SIM) UFG, Ultra Fine Grain Nano-laths martensite Nano-Bainite
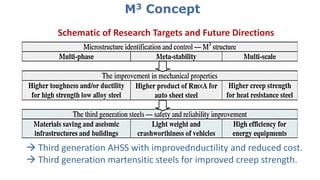
- 17. M3 Concept Schematic of Research Targets and Future Directions Third generation AHSS with improvednductility and reduced cost. Third generation martensitic steels for improved creep strength.
- 18. 18 Quenching & Partitioning Heat Treatments
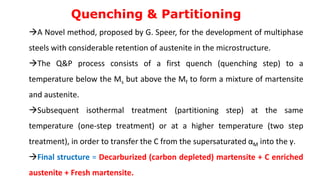
- 19. Quenching & Partitioning A Novel method, proposed by G. Speer, for the development of multiphase steels with considerable retention of austenite in the microstructure. The Q&P process consists of a first quench (quenching step) to a temperature below the Ms but above the Mf to form a mixture of martensite and austenite. Subsequent isothermal treatment (partitioning step) at the same temperature (one-step treatment) or at a higher temperature (two step treatment), in order to transfer the C from the supersaturated αM into the γ. Final structure = Decarburized (carbon depleted) martensite + C enriched austenite + Fresh martensite.
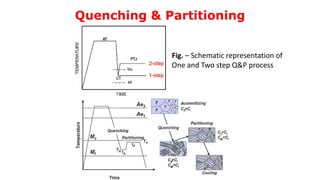
- 20. Quenching & Partitioning Fig. – Schematic representation of One and Two step Q&P process
- 21. Quenching & Partitioning In addition to carbon partitioning into austenite, other processes that could occur during the ‘‘partitioning’’ step are: Tempering of Martensite Carbon trapping at dislocations and interfaces in the martensite Formation of carbides (both transition carbides and/or cementite) Decomposition of the austenite to bainite or other transformation products Competition occurs b/w theses processes. *Bainite has been recognized as a potential constituent particularly at increased quench temperatures where the amount of martensite is limited and bainite transformation kinetics are more rapid than at a lower temperature.
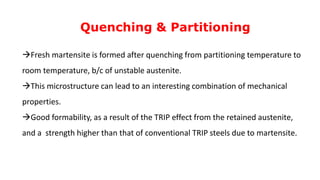
- 22. Quenching & Partitioning Fresh martensite is formed after quenching from partitioning temperature to room temperature, b/c of unstable austenite. This microstructure can lead to an interesting combination of mechanical properties. Good formability, as a result of the TRIP effect from the retained austenite, and a strength higher than that of conventional TRIP steels due to martensite.
- 23. Q&P – Design Requirements (a) Absence of ferrite and/or pearlite formation during the quenching step. (b) Retardation or inhibition of bainite formation, in order to minimize possible overlapping of carbon partitioning and formation of bainite. (c) Retardation or minimization of the precipitation of carbides, which consumes carbon that is then no longer available for carbon enrichment of the austenite. (d) A sufficiently high carbon content for thermal stabilization of a considerable fraction of retained austenite at room temperature.
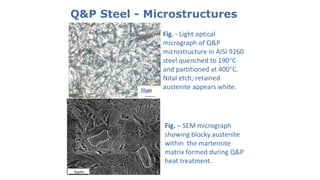
- 24. Q&P Steel - Microstructures Fig. - Light optical micrograph of Q&P microstructure in AISI 9260 steel quenched to 190°C and partitioned at 400°C. Nital etch; retained austenite appears white. Fig. – SEM micrograph showing blocky austenite within the martensite matrix formed during Q&P heat treatment.
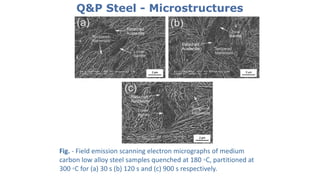
- 25. Q&P Steel - Microstructures Fig. - Field emission scanning electron micrographs of medium carbon low alloy steel samples quenched at 180 ◦C, partitioned at 300 ◦C for (a) 30 s (b) 120 s and (c) 900 s respectively.
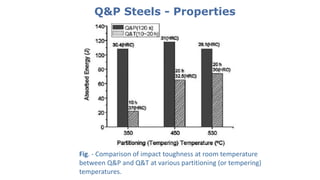
- 26. Q&P Steels - Properties Fig. - Comparison of impact toughness at room temperature between Q&P and Q&T at various partitioning (or tempering) temperatures.
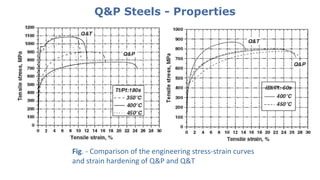
- 27. Q&P Steels - Properties Fig. - Comparison of the engineering stress-strain curves and strain hardening of Q&P and Q&T