


Notes 4 of fe 501 physical properties of food materials
- 1. FE-501 PHYSICAL PROPERTIES OF FOOD MATERIALS ASSOC PROF. DR. YUS ANIZA YUSOF DEPARTMENT OF PROCESS & FOOD ENGINEERING & FACULTY OF ENGINEERING UNIVERSITI PUTRA MALAYSIA
- 3. INTRODUCTION • Optical properties of foods are those properties which govern how food materials respond to absorption of electromagnetic radiation in the range of optical wavelengths and frequencies. • These include visible light and color, but also transmission, reflection and refraction of visible light.
- 4. REFRACTION BASICS • The speed of light is maximum in a vacuum. • The speed of light is much lower when it must travel through a material substance ( di ) and th speed th h t i l bt (medium), d the d will depend on the physical properties of the medium. • When a beam of light (electromagnetic waves) crosses the interface between two different media, the different physical properties of these media will cause the light waves to travel at different propagation velocities in each medium. d • This results in the electromagnetic light beam changing direction when it crosses the interface Between the two different media, as shown in Figure 4.1
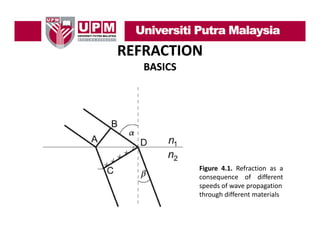
- 5. REFRACTION BASICS Figure 4.1. Refraction as a consequence of different speeds of wave propagation through different materials
- 6. REFRACTION BASICS • A light beam that shown in Figure 4.2, where the light is p passing from medium 1 into medium 2, part of the light g p g “bounces back” (is reflected) at the interface, while the other part is refracted as it enters material 2. • According to Huygen’s principle, all points at the interface are starting points of spherical waves propagating through medium 2 2. • If these waves have a lower propagation speed in medium 2 than they did in medium 1, they will change y y g the direction of the light beam as a consequence.
- 7. REFRACTION BASICS Figure 4.2. Angles of reflection (α) and refraction (β) when light strikes an i ik interface of diff f f different materials with refraction indices n1 and n2
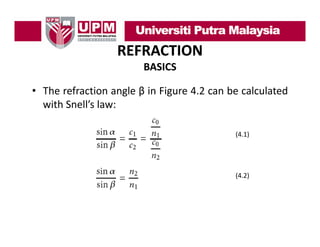
- 8. REFRACTION BASICS • The refraction angle β in Figure 4.2 can be calculated with Snell’s law: Snell s (4.1) (4.2)
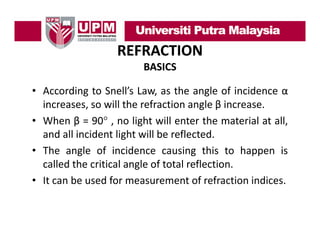
- 9. REFRACTION BASICS • According to Snell’s Law, as the angle of incidence α increases, so will the refraction angle β increase. • When β = 90° , no light will enter the material at all, and all incident light will be reflected. g • The angle of incidence causing this to happen is called the critical angle of total reflection. • It can be used for measurement of refraction indices.
- 10. REFRACTION MEASUREMENTS OF REFRACTION INDEX • The refraction index can be determined experimentally from Snell’s law by being able to Snell s measure the angle of incidence and the angle of refraction in a light beam experiment. • From the same experiment is also possible to determine the critical angle of total reflection by finding the angle of incidence at which the angle of refraction goes to 90°
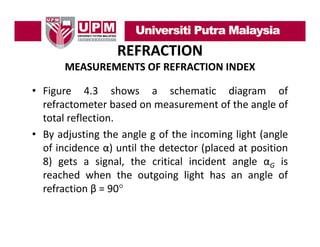
- 11. REFRACTION MEASUREMENTS OF REFRACTION INDEX • Figure 4.3 shows a schematic diagram of refractometer based on measurement of the angle of total reflection. y j g g g g ( g • By adjusting the angle g of the incoming light (angle of incidence α) until the detector (placed at position 8) gets a signal, the critical incident angle αG is reached when the outgoing light has an angle of refraction β = 90°
- 12. REFRACTION MEASUREMENTS OF REFRACTION INDEX Figure 4.3. Measurement of refraction by total reflection: 1: window, 2: sample, 3: cover, 4: incoming beam, 5: reflected beam, 6: refracted b f t d beam, 7 t t l reflected 7: total fl t d beam, 8: detector
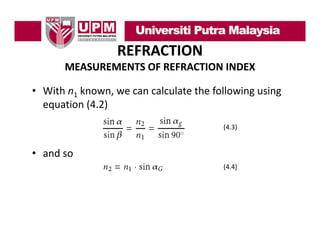
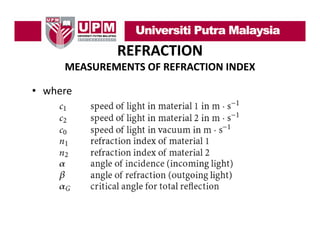
- 13. REFRACTION MEASUREMENTS OF REFRACTION INDEX • With n1 known, we can calculate the following using equation (4.2) equation (4.2) (4.3) • and so ( ) (4.4)
- 15. REFRACTION MEASUREMENTS OF REFRACTION INDEX • Because the refraction index n1 of the refractometer material is known from equation (4.4),we can obtain the refraction index n2 of the sample very easily. p • Table 4.1 shows some examples of refraction index data.
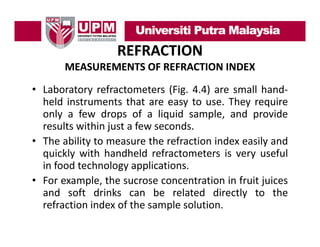
- 17. REFRACTION MEASUREMENTS OF REFRACTION INDEX • Laboratory refractometers (Fig. 4.4) are small hand‐ held instruments that are easy to use. They require only a few drops of a liquid sample, and provide results within just a few seconds. • Th ability t measure th refraction i d easily and The bilit to the f ti index il d quickly with handheld refractometers is very useful in food technology applications. gy pp • For example, the sucrose concentration in fruit juices and soft drinks can be related directly to the refraction i d of the sample solution. f i index f h l l i
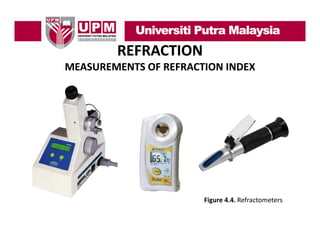
- 18. REFRACTION MEASUREMENTS OF REFRACTION INDEX Figure 4.4. Refractometers Figure 4.4. Refractometers
- 19. COLORIMETRY • Color and its measurement (colorimetry) involve organoleptic perception of properties. • The different colors we see with visible light are the result of how our eyes perceive electromagnetic radiation at different frequencies and wavelengths wavelengths. • The sensation of color occurs when light rays (electromagnetic radiation) of a certain frequency and wavelength strike the retina of the h l h ik h i f h human eye. • The retina, in turn, transforms this sensation into a nerve signal that is transmitted to our brain, and we perceive color.
- 20. COLORIMETRY LIGHT AND COLOR • Visible light is electromagnetic radiation with wavelength between 380 nm and 750 nm. • Larger wavelengths belong to infra red radiation (IR) and smaller wavelengths belong to ultraviolet g g radiation (UV), and are invisible to the human eye. • The speed of light is the speed at which the light waves propagate, and can be calculated mathematically as the product of wavelength and frequency.
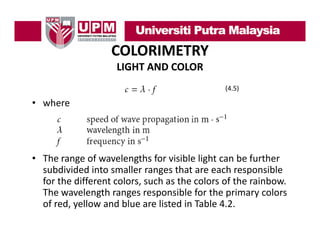
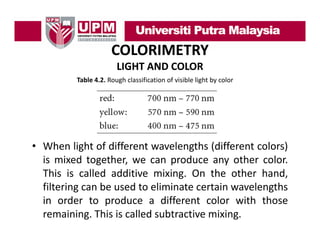
- 21. COLORIMETRY LIGHT AND COLOR (4.5) • where • The range of wavelengths for visible light can be further subdivided into smaller ranges that are each responsible subdivided into smaller ranges that are each responsible for the different colors, such as the colors of the rainbow. The wavelength ranges responsible for the primary colors of red, yellow and blue are listed in Table 4.2. f d ll d bl li t d i T bl 4 2
- 22. COLORIMETRY LIGHT AND COLOR Table 4.2. Rough classification of visible light by color • When light of different wavelengths (different colors) is mixed together, we can produce any other color. This is ll d ddi i Thi i called additive mixing. O the other h d i i On h h hand, filtering can be used to eliminate certain wavelengths in order to produce a different color with those remaining. This is called subtractive mixing.
- 23. COLORIMETRY LIGHT AND COLOR • The perception of color is also dependent on particle size. This is the result of what we call light scattering. • As the particles become smaller and smaller, the specific surface area of the particle aggregates increases dramatically This causes more and more of dramatically. the incident light striking each particle to be fully reflected. • Our eye receives only the light that is reflected from an object. When this light contains all the wavelengths in the visible light spectrum, we are receiving the additive mixing of all the colors, which is perceived as white.
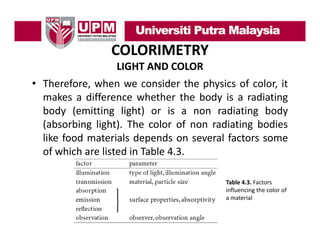
- 24. COLORIMETRY LIGHT AND COLOR • Therefore, when we consider the physics of color, it makes a difference whether the body is a radiating body (emitting li ht) or i a non radiating b d b d ( itti light) is di ti body (absorbing light). The color of non radiating bodies like food materials depends on several factors some of which are listed in Table 4.3. Table 4.3. Factors influencing the color of a material
- 25. COLORIMETRY PHYSIOLOGY OF COLOR PERCEPTION • There are two different types of light receptors on the retina of the human eye that are called rods and cones. • The rods are sensitive to relative brightness and darkness, darkness while the cones are sensitive to colors colors. • There are three different types of cones, which have pigments that are sensitive to different wavelengths of light. These include wavelengths with absorption maxima of 420 nm (blue), 535 nm (green) and 565 ( ), (g ) nm (red).
- 26. COLORIMETRY PHYSIOLOGY OF COLOR PERCEPTION • Thus, we can simply say that we have cones sensitive to blue, green and red light. By mixing and blending the i l from all th th signals f ll three cone sensors, we can perceive all colors made up of added mixtures of light with these wavelengths wavelengths. • Figure 4.5 shows all colors which can be observed in a so‐called color triangle. Here, each place in the so called diagram is a perception of color defined by x, y coordinates.
- 27. COLORIMETRY PHYSIOLOGY OF COLOR PERCEPTION Figure 4.5. Chromaticity diagram. In the triangle are all colors which can be g observed. Colors with maximum brilliance are on the horse shoe curve. Point E in the middle is zero brilliance (white)
- 28. COLORIMETRY PHYSIOLOGY OF COLOR PERCEPTION • As we move along the perimeter of the triangle in a clockwise direction, we encounter a system of increasing wavelength. wavelength The points on the horseshoe like curve are horseshoe‐like the points of maximum brilliance. These are the spectral colors (colors of the rainbow). At the bottom line of the color triangle, we have purple colors which are not spectral colors (not components of the rainbow). • Moving inward f d from the outer points of the d h f h diagram to the center of the triangle, we come to colors with less brilliance, to pale colors and at last to the point where a color is so pale that it appears white. This is the point of zero brilliance E.
- 29. COLORIMETRY PHYSIOLOGY OF COLOR PERCEPTION • The mixing of two colors on the color triangle can be represent by drawing a straight line from one color to the other in order to see what resulting color is possible possible. • For example, mixing red and green will produce a line going through the region of yellow colors. • This illustrates the principle of additive mixing of colors. All lines passing through the point E represent possibilities for reaching a perfect white. • Colors which result in white when mixed together are called complementary colors. ll d l t l
- 30. COLORIMETRY COLOR AS A VECTOR QUANTITY • A convenient way to describe a color as a quantity is to treat it like a vector with three components. • Based on this vector system with three components, we can indicate a color with numbers. • For example, we can say color number 80‐70‐50 after CIE or number 7:3:2 after DIN 6164. • I thi way, th communication f d In this the i ti for describing a color ibi l is immune from problems with human perception and subjective judgement This is important in judgement. technical applications.
- 31. COLORIMETRY COLOR AS A VECTOR QUANTITY • For technical purposes we can describe a color by three attributes; –h hue – chroma – brightness Table 4.4. Terms used in colorimetry
- 32. COLORIMETRY COLOR AS A VECTOR QUANTITY • The human eye can distinguish about 200 different hues, 20–25 degrees of chroma and about 500 degrees of b i ht d f brightness. B combination of th By bi ti f these we can perceive some millions of different colors.
- 33. COLORIMETRY LAB SYSTEM FOR COLOR QUANTIFICATION • One of the first laboratory methods for quantifying colors is the system devised by Munsell (Munsell, 1905). In this system, a color is marked by a vector. The vector points to a system a color is marked by a vector The vector points to a place in the color space indicating the hue of the color. • The length of the vector d indicates the distance from the point of zero color, and quantifies the chroma of the color, while the angle α gives the hue. • Th vertical axis i scaled f th b i ht The ti l i is l d for the brightness of th color f the l (see Figure 4.6). So, to describe the color of interest we have to specify α and d of the vector and the value of p y brightness.
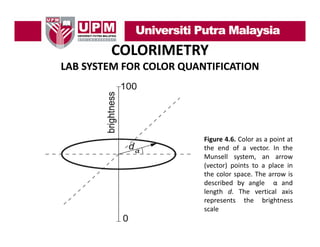
- 34. COLORIMETRY LAB SYSTEM FOR COLOR QUANTIFICATION Figure 4 6 Color as a point at 4.6. the end of a vector. In the Munsell system, an arrow (vector) points to a place in the color space. The arrow is described by angle α and length d. The vertical axis represents the brightness scale
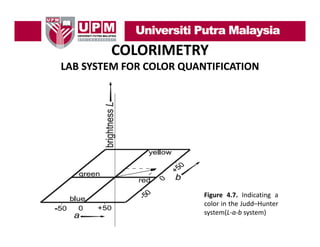
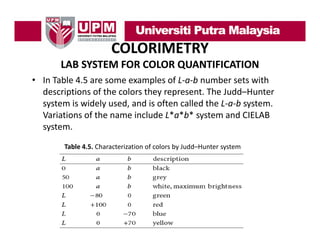
- 35. COLORIMETRY LAB SYSTEM FOR COLOR QUANTIFICATION • Another presentation of the color vector is made in the Judd–Hunter system (Judd & Wyszecki, 1967). • The vector pointing to the place in the color space is indicated with the coordinates a and b. • The brightness L again is scaled on the vertical axis (see Figure 4.7). This system often is called the L‐a‐b system. The a‐axis and b‐axis are scaled from –100 to +100. So, with the Judd–Hunter system we d h h dd describe a color with b l h three numbers (L‐a‐b) which are all between 0 and 100. Using the L‐a‐b system we see positive values of a Lab represent red,−a for green, +b for yellow, and −b for blue.
- 36. COLORIMETRY LAB SYSTEM FOR COLOR QUANTIFICATION Figure 4.7. Indicating a color i the Judd–Hunter l in h dd system(L‐a‐b system)
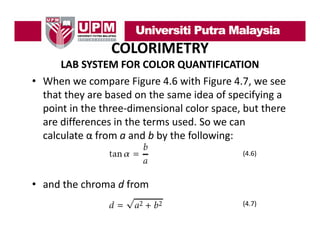
- 37. COLORIMETRY LAB SYSTEM FOR COLOR QUANTIFICATION • When we compare Figure 4.6 with Figure 4.7, we see that they are based on the same idea of specifying a point in the three‐dimensional color space, but there point in the three dimensional color space but there are differences in the terms used. So we can ca cu ate α o a a d b by t e o o g calculate α from a and b by the following: (4.6) • and the chroma d from (4.7) (4 7)
- 38. COLORIMETRY LAB SYSTEM FOR COLOR QUANTIFICATION • When we examine Figure 4.8,we will recognize the quantities h ll h a, b and α again. They describe the vector lying in the plane. When we now use the vertical axis and let the vector also point to the value for the brightness L, then we can get a three‐dimensional vector pointing to our designated color. Figure 4.8. Color as a point in a three‐dimensional space of polar coordinates
- 40. COLORIMETRY COLOR MEASUREMENT • Color measurements can be performed by visual techniques or a class of spectrometric techniques. Classic tri stimulus colorimeters belong to the class tri‐stimulus of spectrometric techniques, and try to adopt the function of the human eye. u ct o o t e u a eye • Visual color measurement involves observing a sample without instruments, but under controlled p , conditions of illumination, along with reference to a set of color standards with which to compare the sample colors observed.
- 41. COLORIMETRY COLOR MEASUREMENT • Spectrometric measurements involve measurements of the absorption of specified wavelengths by the sample under controlled defined conditions of sample under controlled defined conditions of illumination. • Tri‐stimulus techniques make use of three filters to Tri‐stimulus techniques make use of three filters to simulate the function of the three different types of cones in the human eye retina. y
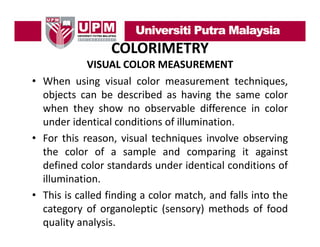
- 42. COLORIMETRY VISUAL COLOR MEASUREMENT • When using visual color measurement techniques, objects can be described as having the same color when they show no observable difference in color under identical conditions of illumination. • For this reason visual techniques involve observing reason, the color of a sample and comparing it against defined color standards under identical conditions of illumination. • This is called finding a color match, and falls into the category of organoleptic (sensory) methods of food quality analysis.
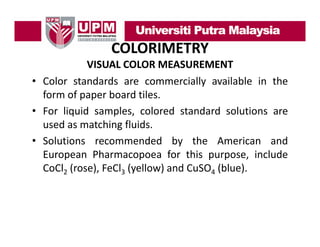
- 43. COLORIMETRY VISUAL COLOR MEASUREMENT • Color standards are commercially available in the form of paper board tiles. • F li id samples, colored standard solutions are For liquid l l d d d l i used as matching fluids. • Sol tions re ommended b the Ameri an and Solutions recommended by American European Pharmacopoea for this purpose, include CoCl2 (rose) FeCl3 (yellow) and CuSO4 (blue) (rose), (blue).
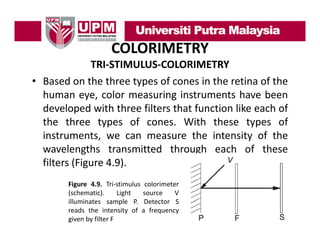
- 44. COLORIMETRY TRI‐STIMULUS‐COLORIMETRY • Based on the three types of cones in the retina of the human eye, color measuring instruments have been developed with three filters that function like each of the three types of cones. With these types of instruments, we can measure the intensity of the st u e ts, e ca easu e t e te s ty o t e wavelengths transmitted through each of these filters (Figure 4.9). Figure 4.9. Tri‐stimulus colorimeter (schematic). Light source V illuminates sample P Detector S P. reads the intensity of a frequency given by filter F
- 45. ULTRAVIOLET (UV) • Ultraviolet (UV) light is electromagnetic radiation with a wavelength shorter than that of visible light, but longer than soft X rays X‐rays. • It can be subdivided into near UV radiation with wavelengths in the range (380–200 nm) far or (380 200 nm), vacuum UV (FUV or VUV) with wavelengths in the range (200–10 nm), and extreme UV (EUV or XUV) g ( ), ( ) with wavelengths in the range (1–31 nm).
- 46. ULTRAVIOLET (UV) • When considering the effect of UV radiation on human health and the environment, the range of near UV wavelengths is even further subdivided into UVA (UV α, 380–315 nm), also called long wave or “black light; ”UVB (UV β, 315–280 nm), also called b ac g t; U (U 3 5 80 ), a so ca ed medium wave; and UVC (UV γ, < 280 nm), also called short wave or “germicidal.”
- 47. ULTRAVIOLET (UV) • Ultraviolet radiation is often used in connection with visible spectroscopy or photometry (UV/VIS) to determine the existence of fluorescence in a given sample, and it is widely used as a technique in c e st y, o a a ys s o c e ca st uctu e, ost chemistry, for analysis of chemical structure, most notably conjugated systems. p p y, • Perhaps more importantly, UV radiation has become increasingly used as an effective disinfecting agent in treatment of drinking water and in cold food processing.
- 48. ULTRAVIOLET (UV) ULTRAVIOLET (UV) DISINFECTING DRINKING WATER • One important application for UV radiation is in the treatment of drinking water because it acts as a very effective disinfecting agent agent. • Disinfection using UV radiation was historically more commonly used in wastewater treatment applications, but is now finding increased usage in drinking water treatment. It used to be thought that UV disinfection was more effective for bacteria and viruses which have more viruses, exposed genetic material, than for larger pathogens which have outer coatings or that form spore states that g p shield their DNA from UV light.
- 49. ULTRAVIOLET (UV) ULTRAVIOLET (UV) DISINFECTING DRINKING WATER • However, it was recently discovered that ultraviolet radiation can be somewhat effective for treating the microorganism Cryptosporidium Cryptosporidium. • These findings resulted in the use of UV radiation as a viable method to treat drinking water. a viable method to treat drinking water
- 50. ULTRAVIOLET (UV) ULTRAVIOLET (UV) FOOD PROCESSING • As consumer demand for fresh and “fresh like” food products increases, the demand for non thermal methods of food pasteurization is likewise on the rise. In addition, public awareness regarding the da ge s o ood bo e ess ( ood po so g) s a so dangers of food‐borne illness (food poisoning) is also raising demand for improved food processing methods that assure safety to the consumer with minimum loss in quality.
- 51. ULTRAVIOLET (UV) ULTRAVIOLET (UV) FOOD PROCESSING • Ultraviolet radiation is used in several food processes to inactivate (destroy) unwanted microorganisms from liquid food products with suitable optical properties (transparent). • Among the most common applications today is the use of UV light to pasteurize fruit juices by pumping the juice over a high intensity ultraviolet light source. j g y g • The effectiveness of such a process depends on the UV absorbance of the juice.
- 52. REFERENCES 1. Judd DB, Wyszecki G (1967).Colour in Business, Science, and Industry.Wiley, NewYork. 2. Munsell AH (1905) A C l 2 M ll Colour N Notation. M i Munsell ll Colour Company, Boston MA.