PEPSICO Presentation to CAGNY Conference Feb 2024
•
13 likes•18,517 views

PepsiCo provided a safe harbor statement noting that any forward-looking statements are based on currently available information and are subject to risks and uncertainties. It also provided information on non-GAAP measures and directing readers to its website for disclosure and reconciliation. The document then discussed PepsiCo's business overview, including that it is a global beverage and convenient food company with iconic brands, $91 billion in net revenue in 2023, and nearly $14 billion in core operating profit. It operates through a divisional structure with a focus on local consumers.
Report
Share


PEPSICO Presentation to CAGNY Conference Feb 2024
- 1. February 21, 2024 Performing to Potential Ramon Laguarta Chairman & CEO Jamie Caulfield EVP & CFO
- 2. Safe Harbor Statement & Non-GAAP Information Safe Harbor Statement Statements in this communication that are “forward- looking statements,” including our long-term targets, are based on currently available information, operating plans and projections about future events and trends. Terminology such as “aim,” “anticipate,” “believe,” “drive,” “estimate,” “expect,” “expressed confidence,” “forecast,” “future,” “goal,” “guidance,” “intend,” “may,” “objective,” “outlook,” “plan,” “position,” “potential,” “project,” “seek,” “should,” “strategy,” “target,” “will” or similar statements or variations of such words and other similar expressions are intended to identify forward-looking statements, although not all forward-looking statements contain such terms. Forward-looking statements inherently involve risks and uncertainties that could cause actual results to differ materially from those predicted in such forward-looking statements. Such risks and uncertainties include, but are not limited to: the risks associated with the deadly conflict in Ukraine; future demand for PepsiCo’s products; damage to PepsiCo’s reputation or brand image; product recalls or other issues or concerns with respect to product quality and safety; PepsiCo’s ability to compete effectively; PepsiCo’s ability to attract, develop and maintain a highly skilled and diverse workforce or effectively manage changes in our workforce; water scarcity; changes in the retail landscape or in sales to any key customer; disruption of PepsiCo’s manufacturing operations or supply chain, including continued increased commodity, packaging, transportation, labor and other input costs; political, social or geopolitical conditions in the markets where PepsiCo’s products are made, manufactured, distributed or sold; PepsiCo’s ability to grow its business in developing and emerging markets; changes in economic conditions in the countries in which PepsiCo operates; future cyber incidents and other disruptions to our information systems; failure to successfully complete or manage strategic transactions; PepsiCo’s reliance on third-party service providers and enterprise-wide systems; climate change or measures to address climate change and other sustainability matters; strikes or work stoppages; failure to realize benefits from PepsiCo’s productivity initiatives; deterioration in estimates and underlying assumptions regarding future performance of our business or investments that can result in impairment charges; fluctuations or other changes in exchange rates; any downgrade or potential downgrade of PepsiCo’s credit ratings; imposition or proposed imposition of new or increased taxes aimed at PepsiCo’s products; imposition of limitations on the marketing or sale of PepsiCo’s products; changes in laws and regulations related to the use or disposal of plastics or other packaging materials; failure to comply with personal data protection and privacy laws; increase in income tax rates, changes in income tax laws or disagreements with tax authorities; failure to adequately protect PepsiCo’s intellectual property rights or infringement on intellectual property rights of others; failure to comply with applicable laws and regulations; and potential liabilities and costs from litigation, claims, legal or regulatory proceedings, inquiries or investigations. For additional information on these and other factors that could cause PepsiCo’s actual results to materially differ from those set forth herein, please see PepsiCo’s filings with the Securities and Exchange Commission, including its most recent annual report on Form 10-K and subsequent reports on Forms 10-Q and 8-K. Investors are cautioned not to place undue reliance on any such forward-looking statements, which speak only as of the date they are made. PepsiCo undertakes no obligation to update any forward-looking statements, whether as a result of new information, future events or otherwise. Non-GAAP Information Please refer to PepsiCo’s website at www.pepsico.com in the “Investors” section under “Financial Information – Events and Presentations,” and PepsiCo’s filings with the Securities and Exchange Commission, to find disclosure and a reconciliation of any non-GAAP financial measures contained herein. PepsiCo provides guidance on a non- GAAP basis as the Company cannot predict certain elements which are included in reported GAAP results, including the impact of foreign exchange and mark-to- market adjustments. 2
- 3. WHO WE ARE 1 WHO WE ARE WHERE WE ARE WHERE WE ARE GOING CAPITAL ALLOCATION & FINANCIAL TARGETS 3
- 4. We are a global beverage and convenient food company with large, iconic and trusted brands 4 NET REVENUE More than $91 BILLION in 2023 ICONIC GLOBAL BRANDS Sold in OVER 200 countries and territories CORE OPERATING PROFIT Nearly $14 BILLION in 2023 2023 reported operating profit was $12.0 billion. Core operating profit is a non-GAAP financial measure that excludes certain items.
- 5. $91B Net Revenue That are well- positioned in large, attractive categories 5 Leader in savory snacks CONVENIENT FOOD Expanding into other convenient food occasions Strong position in all LRB categories Expanding across beverage occasions $53B $38B PepsiCo data based on 2023 reported net revenue. Market share data (retail sales for savory snacks and beverages) based on 2023 Euromonitor. 59% 41%
- 6. Europe 14% LatAm 13% AMESA 7% APAC 5% PBNA 30% FLNA 27% QFNA 3% INCLUDING A DIVISIONAL STRUCTURE DESIGNED TO OPERATE WITH A LOCAL FOCUS ON THE CONSUMER 6 PepsiCo data based on 2023 reported net revenue. Percentages may not sum due to rounding. Developed and Developing & Emerging Markets were 69% and 31% of PepsiCo’s 2023 reported net revenue, respectively. International $36B North America $55B Division / Geography Net Revenue Breakdown 61% 39% $91B
- 7. LED BY A DIVERSE PORTFOLIO OF TRUSTED BRANDS LOVED BY CONSUMERS IN NORTH AMERICA 7 PepsiCo data based on 2023 reported net revenue. Net Revenue ~$28B Net Revenue ~$25B Net Revenue ~$3B PEPSICO BEVERAGES NORTH AMERICA FRITO LAY NORTH AMERICA QUAKER FOODS NORTH AMERICA Brands that span across Salty, Savory and Macrosnacks Broad presence across LRB including CSD, Sports/Hydration, RTD Coffee/Tea and Energy Strong presence in Breakfast offerings, Lite snacks and Side/Pasta dishes #1 Manufacturer Ranking Kantar PoweRanking Survey 8th Consecutive Year
- 8. AND AN EXPANSIVE REACH ACROSS INTERNATIONAL MARKETS 8 PepsiCo data based on 2023 reported net revenue. Food and beverage mix sourced from 2023 Form 10-K filed with the SEC. Net Revenue ~$12B Net Revenue ~$13B Net Revenue ~$6B Net Revenue ~$5B Brazil Mexico Colombia U.K. France Turkey Egypt India South Africa China Australia Thailand Saudi Pakistan Vietnam Philippines Chile Poland Spain Peru Food / Beverage % 52% / 48% Food / Beverage % Food / Beverage % Food / Beverage % 91% / 9% 71% / 29% 77% / 23% EUROPE LATIN AMERICA AMESA APAC
- 9. SHARING A STRATEGIC FRAMEWORK AND CULTURE THAT EMPHASIZES PERFORMANCE, OWNERSHIP AND INCLUSIVITY 9 Create more smiles with every sip and every bite Be the global leader in beverages and convenient foods by winning with FASTER Winning in the marketplace, being more consumer-centric and accelerating investment for topline growth STRONGER Transforming our capabilities, cost and culture by operating as one PepsiCo, leveraging technology, winning locally and globally enabled BETTER Creating growth and value by operating within planetary boundaries and inspiring positive change for the planet and people MISSION VISION THE PEPSICO WAY
- 10. WHO WE ARE WHERE WE ARE 2 WHERE WE ARE WHERE WE ARE GOING CAPITAL ALLOCATION & FINANCIAL TARGETS 10
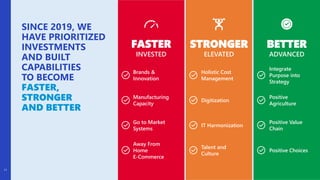
- 11. SINCE 2019, WE HAVE PRIORITIZED INVESTMENTS AND BUILT CAPABILITIES TO BECOME FASTER, STRONGER AND BETTER 11 FASTER INVESTED Brands & Innovation Manufacturing Capacity Go to Market Systems Away From Home E-Commerce STRONGER ELEVATED Holistic Cost Management Digitization IT Harmonization Talent and Culture BETTER ADVANCED Positive Choices Integrate Purpose into Strategy Positive Value Chain Positive Agriculture
- 12. INCLUDING INVESTMENTS TO ACCELERATE GROWTH AND BUILD FOR THE FUTURE 12 STRONGER FASTER BETTER $4.2B $5.7B 2018 2023 $3.1B $5.3B 2018 2023 ADVERTISING & MARKETING NET CAPEX +36% +69% Net capex is capital spending less cash proceeds from sales of property, plant and equipment which is a non-GAAP financial measure.
- 13. AS WE ELEVATED OUR FOCUS ON CONSUMER-CENTRIC INNOVATION THAT DRIVES CONSUMPTION 13 FUNCTIONAL AND HYDRATION POSITIVE CHOICES Pepsi Low/Zero Sugar >$9B SunChips/ Baked >$2B Reduced sugar and sodium, whole grain and baked offerings Expanding our presence to meet consumer preferences PACKAGE SIZES Variety Multipack & Canisters >$3B Expansive set of portion control options BOLD FLAVORS Bold flavors with greater assortment and variety Gatorade + Propel >$11B Based on 2023 global estimated Retail Sales Value (RSV). Variety Multipack is U.S. MULOC retail sales. STRONGER FASTER BETTER Energy >$6B
- 14. WHICH HAS RESULTED IN STRONG REVENUE GROWTH ACROSS OUR GLOBAL CATEGORIES AND BRANDS 14 2016 –2018 average reported net revenue grew 0.1% for Global Beverage and 1.6% for Global Convenient Food. 2019-2023 average reported net revenue growth was 5.0% for Global Beverage and 9.1% for Global Convenient Food. Brand growth rates are 2021-2023 CAGR based on constant currency net revenue data from 25 key markets. Organic revenue growth and constant currency net revenue are non-GAAP financial measures that exclude certain items. Reported Brand 2021-2023 net revenue CAGR are 12% Gatorade, 8% Pepsi, 8% Mountain Dew, 15% Doritos, 14% Cheetos and 10% Lay's. 2% 5% 7% 10% Global Beverage Global Convenient Food 2016-18 Average 2019-23 Average ORGANIC REVENUE GROWTH BY CATEGORY NET REVENUE GROWTH BY BRAND (2021-’23 CAGR) +13% +16% +14% +10% +8% +12% STRONGER FASTER BETTER
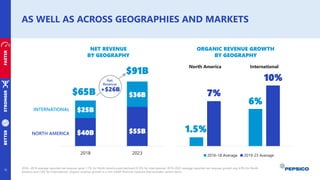
- 15. AS WELL AS ACROSS GEOGRAPHIES AND MARKETS 15 2016 –2018 average reported net revenue grew 1.7% for North America and declined (0.3)% for International. 2019-2023 average reported net revenue growth was 6.9% for North America and 7.8% for International. Organic revenue growth is a non-GAAP financial measure that excludes certain items. NET REVENUE BY GEOGRAPHY ORGANIC REVENUE GROWTH BY GEOGRAPHY 1.5% 6% 7% 10% North America International 2016-18 Average 2019-23 Average $40B $55B $25B $36B 2018 2023 NORTH AMERICA INTERNATIONAL STRONGER FASTER BETTER $65B $91B Net Revenue +$26B
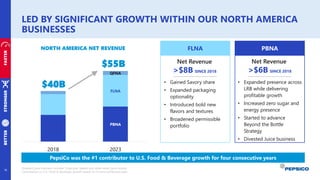
- 16. LED BY SIGNIFICANT GROWTH WITHIN OUR NORTH AMERICA BUSINESSES 16 Divested juice business includes Tropicana, Naked and other select juice brands Contribution to U.S. Food & Beverage growth based on Circana syndicated data STRONGER FASTER BETTER $40B $55B NORTH AMERICA NET REVENUE PBNA FLNA QFNA 2018 2023 • Expanded presence across LRB while delivering profitable growth • Increased zero sugar and energy presence • Started to advance Beyond the Bottle Strategy • Divested Juice business PBNA FLNA Net Revenue >$6B SINCE 2018 Net Revenue >$8B SINCE 2018 • Gained Savory share • Expanded packaging optionality • Introduced bold new flavors and textures • Broadened permissible portfolio PepsiCo was the #1 contributor to U.S. Food & Beverage growth for four consecutive years
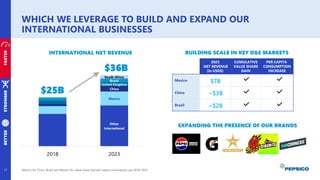
- 17. WHICH WE LEVERAGE TO BUILD AND EXPAND OUR INTERNATIONAL BUSINESSES 17 Metrics for China, Brazil and Mexico for value share and per capita consumption are 2018-2023. STRONGER FASTER BETTER Other International Mexico China United Kingdom Brazil South Africa 2018 2023 $25B $36B INTERNATIONAL NET REVENUE 2 2023 NET REVENUE (in USD$) CUMULATIVE VALUE SHARE GAIN PER CAPITA CONSUMPTION INCREASE Mexico China Brazil BUILDING SCALE IN KEY D&E MARKETS EXPANDING THE PRESENCE OF OUR BRANDS $7B ~$3B ~$2B
- 18. WITH A BROAD SET OF PRODUCTIVITY INITIATIVES THAT HELP FUND INVESTMENTS AND IMPROVE GLOBAL PROFITABILITY 18 STRONGER FASTER BETTER DRIVING EXCELLENCE AT THE BASICS KEY INITIATIVES Optimized Labor Through Global Business Services Network & Route Optimization Automated Plants & Warehouses Transitioned from functional silos to end-to-end approach Digitally connected GTM to optimize selling and merchandising Simplified and harmonized route design and aligned products with optimal GTM system Automated Warehouse storage and optimized packaging operations DIVISION PROFIT Elevated Store GTM & Execution Delivering Productivity Across Many Dimensions $8B $10B $4B $6B 2018 2023 $12B $16B NORTH AMERICA INTERNATIONAL Figures for profit are division core operating profit which is a non-GAAP financial measure that excludes certain items. Division reported operating profit in 2018 was $7.9B and $3.6B for North America and International, respectively and in 2023 was $9.8B and $4.5B for North America and International, respectively.
- 19. AS WE CONTINUE TO MAKE PROGRESS AGAINST OUR GOALS 19 STRONGER FASTER BETTER Metrics through 2022, PepsiCo 2022 ESG Summary. 1 Metric counts the cumulative number of regenerative acres globally since 2021. Regenerative acres reported for 2022 include U.S., Mexico, Canada and 17 European countries only. 2 Metric counts the cumulative people impacted since 2021 3 Measured versus a 2015 baseline. In 2022, we remeasured the 2015 baseline to reflect the divestiture of Tropicana, enhancements in our calculation methodology and the inclusion of additional data. 4 25% improvement goal measured against 2015 baseline. In 2022, we remeasured the 2015 baseline and prior results to reflect the divestiture of Tropicana. 5 PepsiCo considers packaging to be recyclable, compostable, biodegradable or reusable (RCBR) if certain end-of-life waste management criteria is achieved. 6 As of 2022, based on Top 26 Beverage markets, which represented 78% of our global beverages volume and Top 23 Convenient Foods markets, which represented 86% of our global convenient foods volume. Results reflect exclusion of Be & Cheery portfolio. POSITIVE AGRICULTURE POSITIVE VALUE CHAIN POSITIVE CHOICES 2M+ Acre collaboration with Walmart that aims to adopt regenerative agriculture 0.9M+ Acres adopted regenerative practices since 20211 11K+ Livelihoods improved in our supply chain and communities2 23% Reduction in Scope 1 and Scope 2 emissions3 22% Water efficiency improvement vs 2025 goal of 25%3, 4 ~8.7B Liters of water replenished into watersheds in 2022 88% Of global packaging is recyclable, compostable, biodegradable or reusable5 56% Of beverages portfolio meeting added sugars reduction target6 68% Of convenient foods portfolio meeting sodium reduction target6 75% Of convenient foods portfolio meeting saturated fat reduction target6
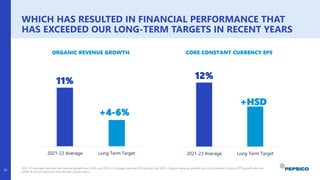
- 20. WHICH HAS RESULTED IN FINANCIAL PERFORMANCE THAT HAS EXCEEDED OUR LONG-TERM TARGETS IN RECENT YEARS 20 2021-23 average reported net revenue growth was 9.2% and 2021-23 average reported EPS growth was 8.8%. Organic revenue growth and core constant currency EPS growth are non- GAAP financial measures that exclude certain items. ORGANIC REVENUE GROWTH CORE CONSTANT CURRENCY EPS 11% 2021-23 Average Long Term Target +4-6% 12% 2021-23 Average Long Term Target +HSD
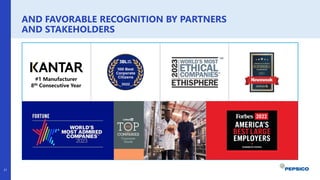
- 21. AND FAVORABLE RECOGNITION BY PARTNERS AND STAKEHOLDERS 21 #1 Manufacturer 8th Consecutive Year
- 22. WHERE WE ARE GOING WHO WE ARE WHERE WE ARE 3 WHERE WE ARE GOING CAPITAL ALLOCATION & FINANCIAL TARGETS 22
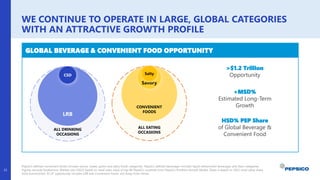
- 23. WE CONTINUE TO OPERATE IN LARGE, GLOBAL CATEGORIES WITH AN ATTRACTIVE GROWTH PROFILE 23 PepsiCo defined convenient foods includes savory, sweet, grains and dairy foods categories. PepsiCo defined beverages includes liquid refreshment beverages and dairy categories. Figures exclude foodservice. Market size (2022) based on retail sales value of top 80 PepsiCo countries from PepsiCo Portfolio Growth Model. Share is based on 2022 retail value share from Euromonitor. $1.2T opportunity includes LRB and Convenient Foods, not Away From Home. GLOBAL BEVERAGE & CONVENIENT FOOD OPPORTUNITY Savory Salty CONVENIENT FOODS ALL EATING OCCASIONS LRB CSD ALL DRINKING OCCASIONS HSD% PEP Share of Global Beverage & Convenient Food >$1.2 Trillion Opportunity +MSD% Estimated Long-Term Growth
- 24. AND WILL AIM TO GROW OUR GLOBAL PRESENCE ACROSS OUR KEY CATEGORIES Population information sourced from Central Intelligence Agency 2021 “The World Factbook”. GLOBAL PRESENCE Multiple opportunities to build our international presence where population trends are favorable PepsiCo Net Revenue Population PER CAPITA CONSUMPTION OPPORTUNITIES LRB Savory 1.7x 3.0x NORTH AMERICA INTERNATIONAL 24 INTERNATIONAL NORTH AMERICA NORTH AMERICA INTERNATIONAL
- 25. WITH A CLEAR SET OF PRIORITIES WITHIN OUR CATEGORIES AND GEOGRAPHIES 25 GLOBAL BEVERAGES GLOBAL CONVENIENT FOODS Consumer-Centric Innovation, Leverage Our Brands, Be Available Always And Everywhere North America • Drive profitable growth by addressing consumer trends across all LRB categories North America • Accelerate growth by capturing new needs and occasions, innovation and precision execution International • Develop greater scale in high growth LRB categories • Strategically invest to be profitable #1 or #2 player International • Broaden portfolio, expand to new categories & occasions • Build scale by driving affinity, availability and affordability, especially in developing markets
- 26. SHIFTING CONSUMER BEHAVIORS ON-THE-GO: WORK, SCHOOL, TRAVEL VALUE SEEKING CHOICEFUL AND DEMANDING EXPERIENTIAL ACTIVE AS CONSUMER PREFERENCES AND THE ENVIRONMENT CONTINUE TO EVOLVE 26 FISCAL/ MONETARY POLICIES HOUSEHOLD SAVINGS INFLATION INTEREST RATES GLOBAL TENSIONS GEOPOLITICS EVOLVING MACROECONOMIC LANDSCAPE
- 27. WE WILL ADVANCE OUR CONSUMER-CENTRIC INNOVATION CAPABILITIES CONSUMER-CENTRICITY INNOVATIVE SOLUTIONS NEW OCCASIONS CROSS SELL EXCITING PRODUCTS ACROSS PORTFOLIO STRONGER FASTER BETTER POSITIVE CHOICES MAKE MY OWN BEVERAGES EXPAND OUR BRANDS INTO MEAL OCCASIONS EXTEND TO OTHER CATEGORIES 27
- 28. AND EXPAND THE SCOPE AND SCALE OF OUR BRANDS 28 LEVERAGE OUR BRANDS STRONGER FASTER BETTER
- 29. STRONGER FASTER BETTER WHILE ALSO WIDENING OUR REACH ACROSS CHANNELS AT HOME E-COMMERCE AWAY FROM HOME Meaningful F&B experiences ENSURING OUR PRODUCTS ARE EVERYWHERE 29
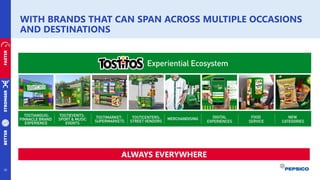
- 30. WITH BRANDS THAT CAN SPAN ACROSS MULTIPLE OCCASIONS AND DESTINATIONS 30 STRONGER FASTER BETTER ALWAYS EVERYWHERE Experiential Ecosystem
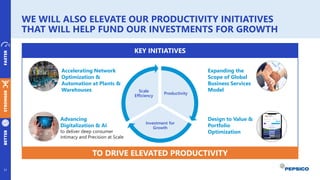
- 31. STRONGER FASTER BETTER WE WILL ALSO ELEVATE OUR PRODUCTIVITY INITIATIVES THAT WILL HELP FUND OUR INVESTMENTS FOR GROWTH KEY INITIATIVES Productivity Investment for Growth Scale Efficiency Advancing Digitalization & AI to deliver deep consumer intimacy and Precision at Scale Accelerating Network Optimization & Automation at Plants & Warehouses Design to Value & Portfolio Optimization Expanding the Scope of Global Business Services Model TO DRIVE ELEVATED PRODUCTIVITY 31
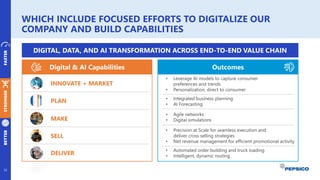
- 32. STRONGER FASTER BETTER WHICH INCLUDE FOCUSED EFFORTS TO DIGITALIZE OUR COMPANY AND BUILD CAPABILITIES Digital & AI Capabilities DIGITAL, DATA, AND AI TRANSFORMATION ACROSS END-TO-END VALUE CHAIN INNOVATE + MARKET DELIVER SELL PLAN MAKE Outcomes • Leverage AI models to capture consumer preferences and trends • Personalization, direct to consumer • Precision at Scale for seamless execution and deliver cross selling strategies • Net revenue management for efficient promotional activity • Automated order building and truck loading • Intelligent, dynamic routing • Integrated business planning • AI Forecasting • Agile networks • Digital simulations 32
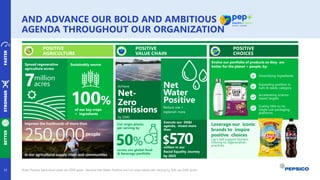
- 33. STRONGER FASTER BETTER AND ADVANCE OUR BOLD AND AMBITIOUS AGENDA THROUGHOUT OUR ORGANIZATION Note: Positive Agriculture goals are 2030 goals. Become Net Water Positive and Cut virgin plastic per serving by 50% are 2030 goals. POSITIVE AGRICULTURE Cut virgin plastic per serving by across our global food & beverage portfolio 100% 50% of our key crops + ingredients Net Water Positive Reduce use + replenish more Diversifying ingredients Execute our DE&I agenda, invest more than 7million acres Achieve Net- Zero emissions by 2040 Evolve our portfolio of products so they are better for the planet + people, by: POSITIVE VALUE CHAIN POSITIVE CHOICES Leverage our iconic brands to inspire positive choices Lay’s will support farmers moving to regenerative practices million in our Racial Equality Journey by 2025 $570 Scaling little to no single-use packaging platforms Accelerating science- based targets Expanding position in nuts & seeds category Spread regenerative agriculture across Sustainably source 33
- 34. CAPITAL ALLOCATION & FINANCIAL TARGETS WHO WE ARE WHERE WE ARE WHERE WE ARE GOING 4 CAPITAL ALLOCATION & FINANCIAL TARGETS 34
- 35. WE WILL REMAIN DISCIPLINED WITH OUR CAPITAL ALLOCATION PRIORITIES While creating shareholder value by prioritizing capital spending and dividends: Committed to a strong financial foundation and maintaining an appropriate capital structure INVESTING IN THE BUSINESS 1 • Fund initiatives that drive growth and productivity through effective and efficient use of capital • Advance our capabilities and reinforce sustainable business RETURNING CASH TO SHAREHOLDERS 2 • Pay and grow dividends SELECTIVELY CONSIDER ACQUISITIONS, PARTNERSHIPS & DIVESTITURES 3 • That meet strict strategic and financial criteria SHARE REPURCHASES 4 35
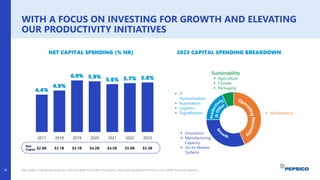
- 36. WITH A FOCUS ON INVESTING FOR GROWTH AND ELEVATING OUR PRODUCTIVITY INITIATIVES Net capex is capital spending less cash proceeds from sales of property, plant and equipment which is a non-GAAP financial measure. 4.4% 4.9% 6.0% 5.9% 5.6% 5.7% 5.8% 2017 2018 2019 2020 2021 2022 2023 ▪ IT Harmonization ▪ Automation ▪ Logistics ▪ Digitalization ▪ Innovation ▪ Manufacturing Capacity ▪ Go-to-Market Systems ▪ Agriculture ▪ Climate ▪ Packaging Sustainability ▪ Maintenance $2.8B $3.1B $4.1B $4.2B $4.5B $5.0B $5.3B Net Capex NET CAPITAL SPENDING (% NR) 2023 CAPITAL SPENDING BREAKDOWN 36
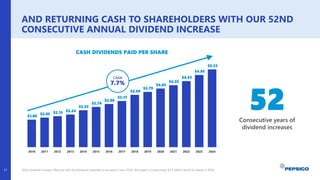
- 37. AND RETURNING CASH TO SHAREHOLDERS WITH OUR 52ND CONSECUTIVE ANNUAL DIVIDEND INCREASE 2024 dividend increase effective with the dividend expected to be paid in June 2024. We expect to repurchase $1.0 billion worth of shares in 2024. 52 Consecutive years of dividend increases CASH DIVIDENDS PAID PER SHARE $1.89 $2.03 $2.13 $2.24 $2.53 $2.76 $2.96 $3.17 $3.59 $3.79 $4.02 $4.25 $4.53 $4.95 $5.33 2010 2011 2012 2013 2014 2015 2016 2017 2018 2019 2020 2021 2022 2023 2024 CAGR 7.7% 37
- 38. AS WE AIM TO DELIVER ON OUR LONG-TERM TARGETS TO CREATE VALUE FOR SHAREHOLDERS Organic revenue growth, core operating margin and core constant currency EPS growth are non-GAAP financial measures. PEPSICO LONG-TERM TARGETS CREATE SHAREHOLDER VALUE Organic Revenue Growth +4-6% Core Operating Margin Expansion +20-30bps Core Constant Currency Earnings Per Share Growth Dividend ~3% Yield 38 +HSD
- 39. February 21, 2024 Q&A Ramon Laguarta Chairman & CEO Jamie Caulfield EVP & CFO