Unified Condition Monitoring
•Download as PPTX, PDF•
2 likes•304 views

UCM: Unified Condition monitoring; a technique of assembled tools for effective condition monitoring of Rotary Machinery and equipment in Oil, Gas, and petrochemical fields of application
Report
Share


Unified Condition Monitoring
- 1. Unified Condition Monitoring (UCM) PRESENTED BY: A.R. AMINIAN
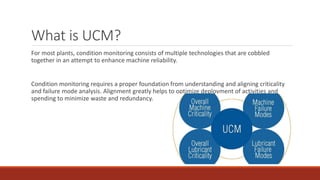
- 2. What is UCM? For most plants, condition monitoring consists of multiple technologies that are cobbled together in an attempt to enhance machine reliability. Condition monitoring requires a proper foundation from understanding and aligning criticality and failure mode analysis. Alignment greatly helps to optimize deployment of activities and spending to minimize waste and redundancy.
- 3. What is UCM? The UCM is the only approach that for condition monitoring based on both machine and lubricant failure mode ranking and criticality analysis. The condition monitoring methods and technologies being integrated include oil analysis (real‐time, portable and laboratory), field inspections (advanced methods providing frequent and comprehensive assessments), and other portable and real‐time condition monitoring technologies (thermography, vibration, etc.). But, What makes the UCM different?
- 4. UCM: the Diffferences What makes UCM different from other strategies is the following: Periodic condition monitoring technologies and methods for each machine are integrated and optimized. Periodicity for each technology and method is optimized. The method of optimization is based on criticality analysis and failure mode ranking. But….What is Failure Mode Ranking?
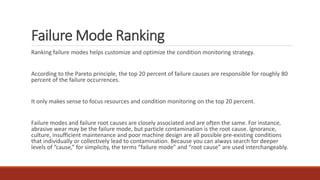
- 5. Failure Mode Ranking Ranking failure modes helps customize and optimize the condition monitoring strategy. According to the Pareto principle, the top 20 percent of failure causes are responsible for roughly 80 percent of the failure occurrences. It only makes sense to focus resources and condition monitoring on the top 20 percent. Failure modes and failure root causes are closely associated and are often the same. For instance, abrasive wear may be the failure mode, but particle contamination is the root cause. Ignorance, culture, insufficient maintenance and poor machine design are all possible pre‐existing conditions that individually or collectively lead to contamination. Because you can always search for deeper levels of “cause,” for simplicity, the terms “failure mode” and “root cause” are used interchangeably.
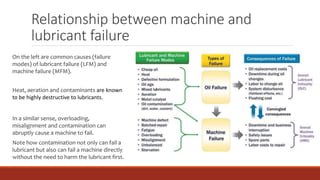
- 6. Relationship between machine and lubricant failure On the left are common causes (failure modes) of lubricant failure (LFM) and machine failure (MFM). Heat, aeration and contaminants are known to be highly destructive to lubricants. In a similar sense, overloading, misalignment and contamination can abruptly cause a machine to fail. Note how contamination not only can fail a lubricant but also can fail a machine directly without the need to harm the lubricant first.
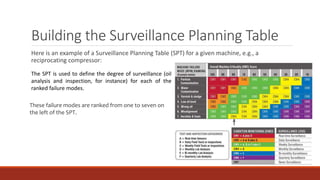
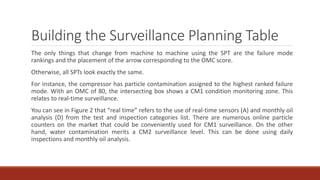
- 7. Building the Surveillance Planning Table Here is an example of a Surveillance Planning Table (SPT) for a given machine, e.g., a reciprocating compressor: The SPT is used to define the degree of surveillance (oil analysis and inspection, for instance) for each of the ranked failure modes. These failure modes are ranked from one to seven on the left of the SPT.
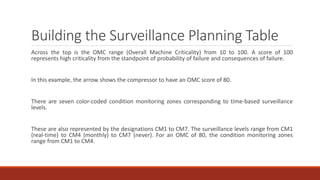
- 8. Building the Surveillance Planning Table Across the top is the OMC range (Overall Machine Criticality) from 10 to 100. A score of 100 represents high criticality from the standpoint of probability of failure and consequences of failure. In this example, the arrow shows the compressor to have an OMC score of 80. There are seven color‐coded condition monitoring zones corresponding to time‐based surveillance levels. These are also represented by the designations CM1 to CM7. The surveillance levels range from CM1 (real‐time) to CM4 (monthly) to CM7 (never). For an OMC of 80, the condition monitoring zones range from CM1 to CM4.
- 9. Building the Surveillance Planning Table The only things that change from machine to machine using the SPT are the failure mode rankings and the placement of the arrow corresponding to the OMC score. Otherwise, all SPTs look exactly the same. For instance, the compressor has particle contamination assigned to the highest ranked failure mode. With an OMC of 80, the intersecting box shows a CM1 condition monitoring zone. This relates to real‐time surveillance. You can see in Figure 2 that “real time” refers to the use of real‐time sensors (A) and monthly oil analysis (D) from the test and inspection categories list. There are numerous online particle counters on the market that could be conveniently used for CM1 surveillance. On the other hand, water contamination merits a CM2 surveillance level. This can be done using daily inspections and monthly oil analysis.
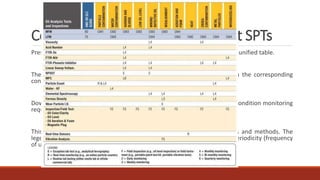
- 10. Combining Machine and Lubricant SPTs Present Figure shows the SPTs for both the machine and lubricant in a single unified table. The failure modes for both MFM and LFM are listed across the top with the corresponding condition monitoring surveillance zones just below. Down the left are various oil analysis tests and inspections that satisfy the condition monitoring requirements for each failure mode. This list was developed based on the available and required technologies and methods. The legend lists specific surveillance types (e.g., lab testing or inspection) and periodicity (frequency of use).
- 11. Combining Machine and Lubricant SPTs By referring to the condition monitoring zones under each failure mode, the surveillance type(s) and periodicity can be properly selected and optimized. For instance, under particle contamination is the R designation (for real‐time) and L4 (for monthly laboratory analysis). Under aeration and foam is the F3 designation for weekly field inspections of the compressor’s sight glass. Misalignment is monitored using multiple methods including elemental analysis of wear metals (monthly laboratory analysis), ferrous density analysis (also monthly), wear particle identification (on exception based on elemental analysis and ferrous density), magnetic plug inspections (weekly) and vibration analysis (weekly). These tests and inspections can easily be rationalized and streamlined to improve efficiency and reduce costs.
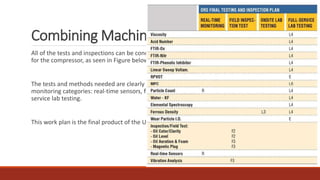
- 12. Combining Machine and Lubricant SPTs All of the tests and inspections can be condensed into a single condition monitoring work plan for the compressor, as seen in Figure below. The tests and methods needed are clearly shown as well as the frequency for the four main monitoring categories: real‐time sensors, field inspections/tests, onsite lab testing and full service lab testing. This work plan is the final product of the UCM strategy.
- 13. Using the Unified Condition Monitoring Model From the preceding discussion, you can see how nearly all decisions related to periodic condition monitoring depend on four factors: Overall Machine Criticality, Overall Lubricant Criticality, Machine Failure Modes and Lubricant Failure Modes. These factors influence what to test, when to test and how to test. In relation to oil analysis, these factors affect where to sample, how often to sample, which tests to conduct, which alarms to set and the general data‐interpretation strategy. UCM is an overarching principle that can be adapted for many applications and uses in the reliability field. The more you know about machine‐specific failure modes and criticality, the better you can plan and optimize condition maintenance across multiple technologies within both predictive and proactive schemes. On the surface, these foundation pieces can seem time‐consuming and arduous, but in the long run you gain by reducing costs and optimizing the benefits. These are solid and wise reliability investments indeed.
- 14. The End Any questions please….?