- Research
- Open access
- Published:
Anaerobic digestion of spoiled milk from dairy industry for biogas production – optimization of operating parameters and kinetic modeling of the pilot scale study
BMC Environmental Science volume 1, Article number: 3 (2024)
Abstract
Background
Spoiled milk from the dairy industry was subjected to anaerobic treatment to produce biogas at 37℃ in this experiment. Parameters such as inoculum dosage, pH, Chemical Oxygen Demand (COD), and retention time were optimized in a laboratory-scale batch reactor for 90 days.
Methods
The anaerobic digestion of spoilt milk was carried out in a laboratory setting using a batch reactor. Then, using the recognized protocols of the APHA, the characteristics of the spoilt milk were assessed. In order to enhance the accuracy of predicting the reactor's performance, the research adopted two different models for kinetic analysis: the Stover-Kincannon model and the Grau second-order multi-component model. The reactor's improved performance, as indicated by evaluated kinetic parameters, was shown by the superior results from both of these models.
Results
The results attained from the reactor’s performance were then used as a reference to improve biogas production in a 100 L Anaerobic Sequential Batch Reactor (ASBR) for 45 days. The ASBR achieved a high COD removal efficiency of 92.4% and produced a maximum of 70.4 L of biogas per liter of spoiled milk, equivalent to 69.6% methane content.
Conclusion
The Stover-Kincannon model yielded kinetic parameters of Umax = 0.295 gCOD/L and KB = 12.87 gCOD/L, whereas the Grau second-order model presented kinetic coefficients a = 6.744 and b = 2.578. The results obtained from the two models suggest that the investigated kinetic coefficients could be improved upon to increase the reactor's capability for handling different substrates during the AD process.
Background
Biogas can be produced from dairy industries through the anaerobic digestion of organic waste materials such as cow manure, spoiled milk, and other dairy processing byproducts [50]. This process breaks down the organic matter, producing biogas which can be used as a renewable energy source for heating, electricity generation, or transportation. Biogas production from dairy industries not only generates energy but also helps to manage waste and reduce greenhouse gas emissions [29, 51]. Dairy wastewater is a type of industrial wastewater that is produced during the processing of milk and dairy products such as cheese, butter, and yoghurt [22]. It is characterized by high levels of organic matter, suspended solids, nutrients, and fats [10].
The composition of dairy wastewater can vary depending on the specific production processes but typically includes lactose, proteins, fats, and minerals such as phosphorus and nitrogen [9, 38]. The high levels of organic matter such as biological oxygen demand (BOD) and chemical oxygen demand (COD) make dairy wastewater highly biodegradable, but it also makes it a potential source of environmental pollution if not properly treated [47]. The presence of fats and oils in dairy wastewater can cause blockages and fouling in pipes and equipment if not removed or treated appropriately [18]. Researchers are focusing on waste produced by dairy industries because of their abundance and inadequate management. For instance, the National Institute of Statistics ISTAT conducted a survey that revealed Italy's milk production in 2011 was 2.653 million tonnes, and around 2.5–3.0% of this quantity was discarded as spoiled and sent back to the processing plant [16].
In most cases, dairy wastewater has been treated conventionally using physical–chemical methods such as coagulation, flocculation, precipitation, adsorption, and filtration [37, 54]. Nevertheless, there are several challenges that limit the broad adoption of these traditional techniques, such as the requirement for chemicals like flocculants and coagulants that are non-recyclable and difficult to economically regenerate [6, 15]. Increasing the expense of operations, regular maintenance, and regeneration are further concerns. Chemical adjustments are also required to improve effective adsorption [39].
Anaerobic treatment of dairy wastewater and spoiled milk is an important process because it can effectively treat the high levels of organic matter and nutrients found in the wastewater while also producing biogas as a valuable byproduct [16, 43]. For instance, spoiled milk (Fig. 1) contains water, fats, carbohydrates, and proteins as its primary components [24]. Hence, anaerobic digestion (AD) is an effective technique to process it, as it generates a considerable amount of methane and assists in the stabilization of the organic matter [20, 31]. Nonetheless, there is a scarcity of experimental data regarding the anaerobic digestion of this waste. The AD process involves the use of specialized anaerobic bacteria to break down the organic matter in the wastewater, converting it into biogas which can be used as a renewable energy source [41]. Initially, the composition of biogas is around 65–70% methane, as well as carbon dioxide and some impurities like siloxanes, ammonia, and hydrogen sulfide in small quantities [27].

Images of spoiled milk and pure milk
There are several reasons why there has been an increase in interest in developed countries for the advancement of technologies for exploiting renewable energy sources such as biomass. In most cases, the climate change such as global warming has been one of the major reasons [30]. Global efforts are being made to minimize emissions and switch to renewable energy sources in response to the risk of environmental changes brought on by greenhouse gas emissions from fossil fuels [13, 35]. Because it only emits the same amount of carbon dioxide as was absorbed by the plants throughout their growth, biomass is regarded as a carbon–neutral energy source. Additionally, the dependence on imported fossil fuels can lead to energy security concerns for many developed countries [34]. For instance, energy shortages and price spikes, can have significant economic and social consequences. The use of domestic biomass resources can help to reduce this dependence and improve energy security.
Because spoiled milk can contain high levels of bacteria and other contaminants, it is important to handle and dispose of it properly to prevent contamination of the environment or other products [4]. In some cases, spoiled milk may be treated or processed to reduce the bacterial load before it is discarded or repurposed. In this study, spoiled milk that was obtained from the Arusha Milk factory was analyzed to determine its potential for biogas generation. A range of laboratory experiments were carried out to optimize various parameters for the pilot plant. The pilot plant involved the use of an Anaerobic Sequencing Batch Reactor (ASBR) to generate biogas on a larger scale. Before milk processing, milk is collected from various livestock keepers in the Arusha region using specific containers of varying capacities. Before being processed, the milk is then treated through the pasteurization process to kill various microbes. However, a small proportion of milk may deteriorate during the treatment process due to bacterial contamination. This quantity of spoiled milk is regarded as waste and is discarded before being discharged from the factory together with other effluents.
Nevertheless, the choice of reactor is critical for a successful AD process and may enhance the quality of the biogas produced. The AD process often involves the use of reactors as the continuous stirred tank reactor (CSTR), upflow anaerobic sludge blanket reactor (UASBR), anaerobic sequencing batch reactor (ASBR), etc. For example, in the UASBR, wastewater is introduced at the bottom of the reactor, and the sludge bed acts as both a support medium and a source of microorganisms for the digestion process [25]. Conversely, the ASBR which operates in batch mode, with the wastewater introduced into the reactor for a set period of time before being removed is also used. The ASBR system includes mixing, settling, and decanting phases, which can be adjusted to optimize the digestion process [46]. In this experiment, the batch reactor was adopted for laboratory scale due to its simplicity and affordability. However, in order to maximize the amount of biogas for practical usage into various social institutions such as schools, hospitals, and jails where energy demand is high due to a higher population, anaerobic sequencing batch reactor (ASBR) depicted higher performance with incredible results. The successful performance of this reactor prompted for further modeling of its operation in order to gain insight into its application at a wider scale and to make performance predictions easier.
The performance of the anaerobic reactors is usually described using various modelling techniques in which kinetic models such as Graef and Andrews’s model, Michaelis–Menten model, Monod model, McCarthy and Young Model, Contois model, Grau second-order multicomponent substrate removal model, modified Stover-Kincannon model and Borja substrate balance model are used. Depending on the anticipated reactor efficiency during anaerobic digestion, the approach for each model varies. The modified Stover-Kincannon and Grau second-order models will be deployed during this study in order to efficiently identify the kinetic parameters necessary for predicting the concentration of effluent substrate.
The main objective of this study is to prevent the mixing of spoiled milk from the source with effluent, which is potentially recycled for other purposes, such as irrigation. However, the level of nutrients in the solid sludge can be increased during the AD treatment, in which the recovered digestate can be employed as fertilizer. Moreover, the energy in the form of biogas is recovered through the AD process of spoiled milk and performance of the reactor is also evaluated through kinetic models.
Kinetic modeling of ASBR
Kinetic modeling is a mathematical tool used to describe the physical, chemical, and biological processes taking place in the reactor during the AD process [28, 45]. The modeling technique enables the reactor's design and operation, which in turn makes the process of optimizing parameters and the reactor's performance simpler. Kinetic modeling often contributes in the analysis of the reaction rates of various microorganisms involved in the AD process during biogas production. As a result, based on the reaction rate, various parameters can be optimized as well as the reactor configuration.
Methods
Materials and inoculum
The experiment utilized spoiled milk sourced from the Arusha Milk Factory in Arusha, Tanzania. The spoiled milk was mixed with cow dung at a concentration of 10% w/v and passed through a 45 mesh screen to remove larger particles. The resulting sludge was employed as a seed culture for creating inoculum for the study. The sludge was subjected to a 90-day anaerobic acclimation process with the spoiled milk to ensure complete digestion. This acclimated inoculum aided the rapid initiation of the biogas digester.
Analytical methods
The properties of the spoiled milk were evaluated according to the APHA's established procedures [8]. The Chemical Oxygen Demand (COD) at both the inlet and outlet points was measured using the ISO 6060 technique. The quantity of biogas obtained was determined through volume measurement utilizing a wet gas meter of appropriate scale, while its constituents were identified by subjecting it to gas chromatography using a Varian Analytical Instrument CP-3800 series apparatus. Two kinds of detectors were utilized, namely the flame ionization detector and the thermal conductivity detector. Elemental composition in the substrate mixture was analyzed by using inductively coupled plasma – optical emission spectroscopy (Thermo iCap 6200 ICP – OES). The characteristics of the spoiled milk are summarized in Table 1.
Batch reactor
A laboratory-scale batch reactor was employed to conduct anaerobic digestion of spoiled milk. The reactor had a total capacity of 7 L, with 5.5 L of working volume designed for the experiment (Fig. 2). To ensure uniformity of the mixture, a stirrer rotating at 40 rpm was installed in the reactor and operated once per day. However, additional wastewater was eliminated at regular intervals to maintain a constant volume in the reactor. Additionally, a water jacket was incorporated into the reactor to regulate the temperature. Temperature sensors were submerged in the water jacket, which was set to maintain a mesophilic condition at a temperature of 37℃. In addition, a gas outlet pipe was connected at the top of the reactor, which was linked to a wet gas meter of appropriate scale set at room temperature. The pH was regulated to the needed level using a solution of 5% sodium bicarbonate.

Laboratory scale experimental set up
The preliminary experiment
The initial setup included a floating drum ASBR, which had a capacity of 100 L for operation (Fig. 3), made of fiber glass materials. The reactor was then fed with influent consistently while maintaining the desired pH level. A 4.5-L capacity acclimatizing tank was employed to dose aqueous solutions of sodium bicarbonate, which helped in regulating the pH of the influent. This research was carried out at a room temperature range of 37 ± 3℃, where the amount of biogas produced on a daily basis was determined. To ensure a consistent volume of the reactor, additional wastewater was eliminated at regular intervals. When necessary, the biogas was sampled, and its volume was measured at room temperature before being released.

Preliminary experiment for ASBR biogas production
Kinetic modelling reckonings
Modified Stover—Kincannon model
Early in the 1980s, Stover and Kincannon proposed an organic loading rate utilized in monomolecular kinetics for biofilm bioreactors that was related to the substrate consumption rate in a kinetic model for biofilm reactor [28]. Equation 1 represents the original Stover-Kincannon model, which was originally put forward for rotating discs in the biological wastewater treatment systems.
Where A is the disc surface area supporting the active biomass, S0 denotes the initial concentration (gCOD/L), S is the substrate concentration in the reactor at time t, q is the flow rate, Umax is the maximum removal rate constant and KB is the saturation value constant.
Equation 1 was modified by replacing the organic loading rate as represented by Eq. 2 with the substrate utilization rate.
Where V is the volume of the reactor. However, the expression of dS/dt in the Eq. 3 suggests that it might linearize under steady-state circumstances without any organic matter building up inside the bioreactor.
Equation 4 is the outcome of Eq. 2 being linearized with Eq. 3.
At steady state, the hydraulic retention time is given by Eq. 5;
Equation 4 can be re-arranged using Eq. 5 to give Eq. 6;
Therefore, Eq. 6 will give a straight line with a slope of \(\frac{{\mathop K\nolimits_{B} }}{{\mathop U\nolimits_{\max } }}\) and an intercept of \(\frac{1}{{\mathop U\nolimits_{\max } }}\) when \(\left( {\frac{HRT}{{\mathop S\nolimits_{0} - \mathop S\nolimits_{{}} }}} \right)\) is plotted against \(\left( {\frac{HRT}{{\mathop S\nolimits_{0} }}} \right)\), giving the Stover—Kincannon kinetic parameters.
However, both the effluent substrate amount and reactor performance may be predicted using these parameters. Dividing HRT to Eq. 6 gives a simplified Eq. 7;
To determine the substrate concentration in the reactor's effluent, Eq. 8 can be derived from Eq. 7 further, and thus provides a correlation.
Grau second-order model
Grau [36] created a multi-component substrate model with linear characteristics to explain and estimate substrate concentration. This model incorporates second-order chemical reaction kinetics and the Monod model [32], where the influent substrate concentration remains unaffected by the effluent substrate concentration. Equation 9 presents the overarching formula for the second-order kinetic model developed by Grau.
By integrating and linearizing Eq. 9, we arrive at Eq. 10. This equation establishes a relationship that can be utilized to calculate the parameters of the Grau second-order multi-component substrate removal model, necessary for the prediction of effluent substrate concentration.
Equation 10 can be further simplified to Eq. 11.
Where; a denotes the substrate kinetics \(\left( {\frac{{\mathop S\nolimits_{0} }}{{\mathop K\nolimits_{S} \mathop {\rm X}\nolimits_{{}} }}} \right)\), E represents the substrate removal efficiency given by \(\left( {\mathop S\nolimits_{{}} - \frac{{\mathop S\nolimits_{{}} }}{{\mathop S\nolimits_{0} }}} \right)\) and b is the coefficient of the HRT.
Results
As observed in Table 1, different parameter characteristics were analyzed from spoilt milk. The parameters analyzed included the COD, TS, VS, pH, elemental composition, and volume of the biogas. Results indicated that the highest biogas (49.5 L) was produced at a pH ranging between 6.5 and 7.5 (Fig. 4). However, the findings presented in Fig. 5 indicate that the largest biogas volume was obtained with a 10% inoculum dosage. As demonstrated in Table 1, the biogas output per gram of COD degraded decreased from 0.452 to 0.331 L in the range of 50,000 to 250,000 mg/L.
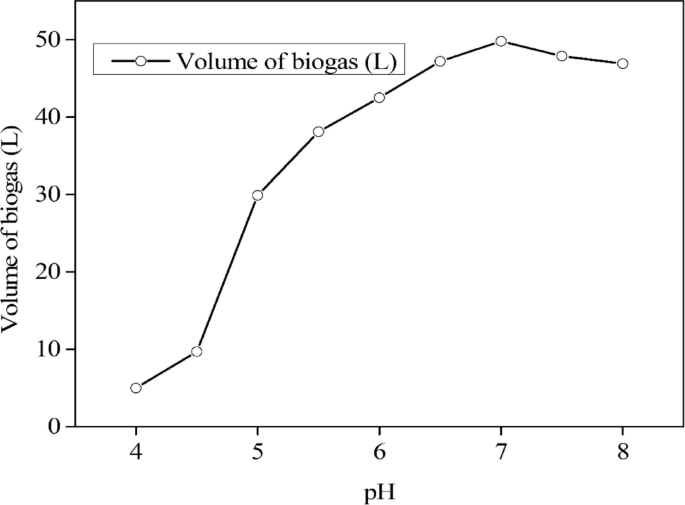
The effect of pH on biogas production
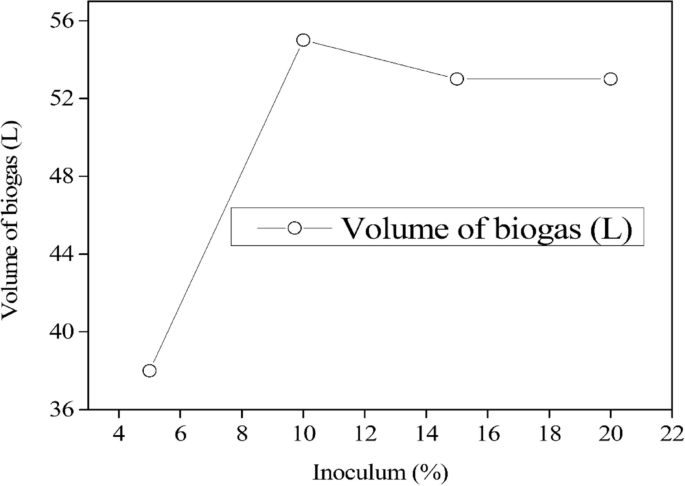
The effect of inoculum on biogas production
On the other hand, a lower concentration of COD resulted in a greater rate of COD breakdown, particularly when COD in various ranges was treated over reaction periods of 12 to 24 hours (Fig. 6). The stability of the digestion process and biogas production in the preliminary experiment was achieved on the second day, as illustrated in Fig. 7. The cumulative biogas production for the entire 45-day period was 15.84 m3 from a total of 225 L of influent spoiled milk in which the COD removal efficiency in the large-scale production was found to be 92.4% from an average effluent COD of 15,210±80 mg/L. However, this achievement aligns with the VFA/Alkalinity ratio falling between 0.1 and 0.3, as illustrated in Fig. 8, which is within the acceptable range.

The effect of COD loading

The effect of hydraulic retention time on biogas production

Evaluation of the Stover—Kincannon kinetic parameters on the ASBR
The linear regression with a value of 0.923 (Fig. 9), the maximum removal rate constant (Umax) at 0.295 g/L, and the saturation value constant (KB) at 12.87 g/L, were the parameters derived from the Stover – Kincannon model. The parameters derived from the Grau second-order model yielded substrate kinetics parameters with values of 6.474 for parameter "a" and 2.578 for the coefficient of hydraulic retention time "b" as indicated in Fig. 10.

VFA/Alkalinity ratio of ASBR

Evaluation of the Grau second order kinetic parameters on the ASBR
Discussion
Characteristics of spoiled milk
A sample was analyzed for its physicochemical characteristics to determine the extent of spoilage in milk over a period of 90 days, with a consistent interval between each analysis (Table 1). The physicochemical properties of spoiled milk include measurements of chemical oxygen demand (COD), total solids (TS), and volatile solids (VS). The results indicate that higher levels of COD can signify greater levels of bacterial activity and decomposition [5]. Total solids (TS) refers to the total amount of solids present in the milk, including both organic and inorganic materials. Volatile solids (VS) refers specifically to the organic portion of the total solids and can give an indication of the level of biodegradability of the milk. In general, as milk spoils, the levels of TS and VS may increase due to the breakdown of milk proteins and other organic matter by bacteria [33]. The COD may also increase due to the production of acids and other organic compounds by the bacteria which lowers the pH. These measurements are useful in assessing the degree of spoilage in milk and in determining the best methods for disposal or treatment.
Nevertheless, the elemental composition of spoiled milk can vary depending on the type of bacteria or other microorganisms present and the extent of spoilage. In general, milk contains a variety of essential minerals such as calcium, phosphorus, magnesium, potassium, and sodium, as well as trace elements such as iron, zinc, copper, and manganese. However, the concentrations of these elements may change as milk spoils.
Batch reactor test
The effect of pH
The pH of the anaerobic digester and inoculum plays a crucial role in the microbial activity and the production of biogas. The optimal pH range for methane-producing bacteria in this study was typically ranged between 5 and 8. For all pH studies, a Hydraulic Retention Time (HRT) of 48 h was kept constant while using an inoculum that accounted for 10% of the initial COD loading, which was measured to be 125,000 ± 100 mg/L. At lower pH (acidic), it was evident that the methane-producing bacteria was inhibited, leading to a decrease in biogas production. The decrease in pH is anticipated to impede the proliferation of methanogenic bacteria that consume hydrogen, leading to an increase in hydrogen partial pressure [12]. Methanogenic bacteria use hydrogen as part of their metabolic process to convert CO2 to methane (CH4), a process known as methanogenesis [49, 55]. This process lowers the partial pressure of hydrogen because the bacteria use hydrogen as an electron donor [42, 44]. This, in turn, results in the further accumulation of volatile fatty acids.
The highest biogas production was observed within the pH range of 6.5 to 7.5, with the best result obtained at a pH of 7 as indicated in Fig. 4. On the other hand, at an elevated pH level (alkaline), the activity of other microbial populations are favored, resulting in the production of less desirable gases like hydrogen and carbon dioxide, and an increase in methane production. Therefore, it is important to maintain the pH within the optimal range to maximize biogas production. However, the pH and HRT are interdependent factors that need to be carefully managed in anaerobic digestion processes to achieve efficient biogas production. Generally, a longer HRT results in a higher biogas production, because it allows more time for the microbial community to convert the substrate to methane and carbon dioxide. However, if the HRT is too long, it may lead to substrate accumulation and inhibition of methane-producing bacteria due to the accumulation of intermediate metabolites.
The influence of inoculum on biogas production
Different volumes of inoculum dosage were employed, ranging from 5 to 25%. However, the slow growth rate of microorganisms caused instability in the anaerobic digestion process at the start, as these microorganisms require time to adjust to the spoiled milk environment in the reactor to ensure efficient anaerobic digestion. The findings presented in Fig. 5 indicate that the largest biogas volume was obtained with a 10% inoculum dosage. However, increasing the dosage did not result in significant changes to the biogas yield. Hence, this study recommends a 10% inoculum dosage as the optimal level for this experiment.
The effect of COD and TS loading
The correlation between the quantity of initial COD loading and the amount of biogas generated is displayed in Table 1. According to the findings, greater amounts of COD lead to a reduction in biogas volume, whereas smaller amounts of COD result in an increase in biogas volume [1, 17]. However, the production of biogas in this experiment was observed to follow a linear increase initially, followed by a slower non-linear increase, and finally reaching a state of saturation, referred to as complete digestion [2, 11]. The duration of complete digestion was affected by the initial COD concentration, as the ratio of food to microorganisms differed as a result. A balanced ratio is essential for optimal performance, as too much or too little food can lead to problems such as acidification or inhibition of the microorganisms, resulting in reduced biogas production [7, 52]. This study indicates that a greater amount of COD necessitates a lengthier duration for microorganisms to decompose it. This, in turn, affects the quantity of biogas generated, as a substantial decrease in the volume of biogas produced occurs with an increase in the COD concentration [48]. As demonstrated in Table 1, the biogas output per gram of COD degraded decreased from 0.452 to 0.331 L in the range of 50,000 to 250,000 mg/L. The occurrence of this instability is typically observed when the feed is overloaded. That notwithstanding, Table 1 shows that the amount of biogas produced at total COD (0.286 L/g COD) is less than the amount generated at TS (0.410 L/g COD). Therefore, it is essential to balance the parameters of TS and COD in order to improve the stability of the AD process, as TS contains both organic and inorganic substances [3, 23].On the other hand, a lower concentration of COD resulted in a greater rate of COD breakdown, particularly when COD in various ranges was treated over reaction periods of 12 to 24 h (Fig. 6).
The preliminary experiment
The laboratory experiment provided the optimal parameters, including inoculum, pH, and retention time, which were used to feed the ASBR reactor for large scale production of biogas. Spoiled milk with an average COD of 200,000 ± 100 mg/L was chosen as the optimal range, and a daily loading of 5 L/day was maintained for 45 days with a feeding rate of 1 kg COD/day. These data were used to compare the daily biogas production in relation to the retention time. After acclimatization, the average biogas production was observed to be 352 L per day, which was equivalent to a methane content in the range of 60.5 to 69.6% for the entire digestion process. The stability of the digestion process and biogas production was achieved from the second day, as illustrated in Fig. 7, because milk was found to be easily biodegradable compared to other substrates like cow dung [40], abattoir waste [26], municipal solid waste [53], and food waste [14]. The cumulative biogas production for the entire 45-day period was 15.84 m3 from a total of 225 L of influent spoiled milk. Therefore, for every liter of spoiled milk, an average of 70.4 L of biogas can be produced. However, the COD removal efficiency in the large scale production was found to be 92.4% from an average effluent COD of 15,210 ± 80 mg/L. Nonetheless as Fig. 8 shows, this accomplishment is consistent with the VFA/Alkalinity ratio laying within the permissible range, specifically between 0.1 and 0.3 [27].
The stover – Kincannon model
The assessment of linear regression with a value of 0.923 (Fig. 8), the maximum removal rate constant (Umax) at 0.295 g/L, and the saturation value constant (KB) at 12.87 g/L, demonstrates a strong model's precision. These parameters, derived from the slope and intercept, collectively contribute to the high level of confidence in the model's accuracy. The findings suggest that the reactor tailored for the anaerobic digestion (AD) of spoiled milk exhibited superior performance, as the kinetic parameters acquired exceeded those documented in other research studies. As an example, in the investigation conducted by Kapdan and Aslan [21], who utilized a photobioreactor setup for nitrogen removal, the highest removal rate constant, Umax, was 0.013 g/L, while the saturation value constant, KB, was 0.0103 g/L.
However, this achievement aligns with the VFA/Alkalinity ratio falling between 0.1 and 0.3, as illustrated in Fig. 9, which is within the acceptable range [27]. Conversely, the elevated VFA/Alkalinity ratio observed on the 25th day of anaerobic digestion was attributed to the acidification levels stemming from the microbial analysis of spoiled milk before the methanogenic bacteria acclimatized.
Grau second order
The parameters derived from the Grau second order model were suggestive of the model's effectiveness, showing improved substrate removal efficiency denoted by E in Fig. 10. This efficiency increased with the extension of hydraulic retention time. The Grau second-order kinetic model characterizes the elimination of multiple components in the substrate. In this model, the bioreactor retains packing materials and other granules, which influences the kinetics of various parameters. This retention of organic matter within the anaerobic digestion process has an impact on these parameters.
In general, the Grau second-order model yielded substrate kinetics parameters in this investigation, with values of 6.474 for parameter "a" and 2.578 for the coefficient of hydraulic retention time "b". Nonetheless, outcomes from the research conducted by Njoya and coauthors [28], focusing on the anaerobic treatment of poultry slaughterhouse wastewater using a reactor, indicated that the substrate kinetics parameters "a" and the coefficient of hydraulic retention time "b" were 0.058 and 1.112, respectively. These values were lower than those acquired in the present study. As noted by Isiki and Sponza [19], the augmentation of kinetic coefficients contributes to enhanced removal efficiency, attributed to greater biomass retention influenced by the reactor's effectiveness in amalgamating and retaining non-uniform substrate mixtures.
Conclusion
The laboratory experiment played a crucial role in optimizing the performance of the reactor. By optimizing certain parameters, the production of biogas using the same substrate was improved. Results showed that the ASBR reactor in the pilot plant was able to produce a high amount of methane content, reaching approximately 69.6%. This resulted in an average of 70.4 L of biogas produced per liter of spoiled milk. Additionally, a high COD removal efficiency of 92.4% was achieved. Accordingly, the linear regression equations derived from the Stover-Kincannon and Grau second-order multi-component models revealed R2 values exceeding 80% for each of them. The findings from both models indicate the potential for refining the studied kinetic coefficients to enhance the reactor's efficiency in treating various substrates during the AD process. In conclusion, treating spoiled milk with the ASBR proved to be an effective way of producing more biogas as an alternative energy source and promoting environmental conservation.
Availability of data and materials
The datasets generated during and/or analyzed during the current study are available from the corresponding author on reasonable request.
References
Abbas Y, Yun S, Mehmood A, Shah FA, Wang K, Eldin ET, Al-Qahtani WH, Ali S, Bocchetta P. Co-digestion of cow manure and food waste for biogas enhancement and nutrients revival in bio-circular economy. Chemosphere. 2023;311:137018.
Agyeman FO, Han Y, Tao W. Elucidating the kinetics of ammonia inhibition to anaerobic digestion through extended batch experiments and stimulation-inhibition modeling. Bioresource Technol. 2021;340:125744.
Ahmadi-Pirlou M, Mesri Gundoshmian T. The effect of substrate ratio and total solids on biogas production from anaerobic co-digestion of municipal solid waste and sewage sludge. J Mater Cycles Waste Manage. 2021;23:1938–46.
Ahmedsham M, Amza N, Tamiru M. Review on milk and milk product safety, quality assurance and control. Int J Livestock Prod. 2018;4(9):67–78.
Ai T, He Q, Xu J, Yin F, Li H, Ai H. A conceptual method to simultaneously inhibit methane and hydrogen sulfide production in sewers: The carbon metabolic pathway and microbial community shift. J Environ Manage. 2019;246:119–27.
Al-Tayawi AN, Sisay EJ, Beszédes S, Kertész S. Wastewater Treatment in the Dairy Industry from Classical Treatment to Promising Technologies: An Overview. Processes. 2023;7(11):2133.
Alavi-Borazjani SA, Capela I, Tarelho LA. Over-acidification control strategies for enhanced biogas production from anaerobic digestion: a review. Biomass Bioenergy. 2020;143:105833.
APHA, A. Standard Methods for examination of water and wastewater. Washington: American Public Health Association; 2015. p. 1360 ISBN 978–087553–013-0.
Awasthi MK, Paul A, Kumar V, Sar T, Kumar D, Sarsaiya S, Liu H, Zhang Z, Binod P, Sindhu R. Recent trends and developments on integrated biochemical conversion process for valorization of dairy waste to value added bioproducts: a review. Biores Technol. 2022;344:126193.
Barakat M, Anjum M, Kumar R, Alafif Z, Oves M, Ansari MO. Design of ternary Ni (OH) 2/graphene oxide/TiO2 nanocomposite for enhanced photocatalytic degradation of organic, microbial contaminants, and aerobic digestion of dairy wastewater. J Clean Prod. 2020;258:120588.
Carucci G, Carrasco F, Trifoni K, Majone M, Beccari M. Anaerobic digestion of food industry wastes: effect of codigestion on methane yield. J Environ Eng. 2005;7(131):1037–45.
Ceron-Chafla P, Kleerebezem R, Rabaey K, van Lier JB, Lindeboom RE. Direct and indirect effects of increased CO2 partial pressure on the bioenergetics of syntrophic propionate and butyrate conversion. Environ Sci Technol. 2020;19(54):12583–92.
Chen L, Msigwa G, Yang M, Osman AI, Fawzy S, Rooney DW, Yap P-S. Strategies to achieve a carbon neutral society: a review. Environ Chem Lett. 2022;4(20):2277–310.
Chew KR, Leong HY, Khoo KS, Vo D-VN, Anjum H, Chang C-K, Show PL. Effects of anaerobic digestion of food waste on biogas production and environmental impacts: a review. Environ Chem Lett. 2021;4(19):2921–39.
El-Saadony MT, Saad AM, El-Wafai NA, Abou-Aly HE, Salem HM, Soliman SM, Abd El-Mageed TA, Elrys AS, Selim S, Abd El-Hack, ME. Hazardous wastes and management strategies of landfill leachates: A comprehensive review. Environ Technol Innovation. 2023;103–50.
Fantozzi F, Pistolesi V, Massoli S, Pugliese A, Bidini G. Anaerobic digestion of spoiled milk in batch reactors: technical and economic feasibility. Energy Procedia. 2015;81:309–18.
Gao S, Hu C, Sun S, Xu J, Zhao Y, Zhang H. Performance of piggery wastewater treatment and biogas upgrading by three microalgal cultivation technologies under different initial COD concentration. Energy. 2018;165:360–9.
Holohan BC, Duarte MS, Szabo-Corbacho MA, Cavaleiro AJ, Salvador AF, Pereira MA, Ziels RM, Frijters CT, Pacheco-Ruiz S, Carballa M. Principles, advances, and perspectives of anaerobic digestion of lipids. Environ Sci Technol. 2022;8(56):4749–75.
Işik M, Sponza DT. Substrate removal kinetics in an upflow anaerobic sludge blanket reactor decolorising simulated textile wastewater. Process Biochem. 2005;3–4(40):1189–98.
Jadhav DA, Park S-G, Pandit S, Yang E, Abdelkareem MA, Jang J-K, Chae K-J. Scalability of microbial electrochemical technologies: Applications and challenges. Biores Technol. 2022;345:126498.
Karapinar Kapdan I, Aslan S. Application of the Stover-Kincannon kinetic model to nitrogen removal by Chlorella vulgaris in a continuously operated immobilized photobioreactor system. J Chem Technol Biotechnol. 2008;7(83):998–1005.
Kucukcongar S, Gok Z, Oden M, Dursun S. Biodegradability of dissolved organic nitrogen in yoghurt and cheese production wastewaters. Int J Environ Sci Technol. 2023;4(20):4031–40.
Liu Z, Lv J. The effect of total solids concentration and temperature on biogas production by anaerobic digestion. Energy Sources Part A: Recov Utilization Environ Effects. 2016;23(38):3534–41.
Mehta BM. Chemical composition of milk and milk products. Handbook of food chemistry. Springer. 2015;511–553.
Mohan SM, Swathi T. Enhanced degradation of the substrate using modified upflow anaerobic sludge blanket reactor-static granular bed reactor series with varying hydraulic retention time at lab scale. J Environ Eng. 2023;1(149):04022088.
Mutegoa E, Kandola I, Hilonga A, Njau KN. Evaluating the level of ammonia and sulfide in the liquid phase during anaerobic digestion of slaughterhouse waste operating at mesophilic scale digester—the impact of inhibition and process performance. AIMS Energy. 2020;4(8):616–26. https://doi.org/10.3934/energy.2020.4.615.
Mutegoa E, Malima N, Hilonga A, Njau K. Effect of mixing ratios of natural inorganic additives in removing ammonia and sulfide in the liquid phase during anaerobic digestion of slaughterhouse waste. Mater Today Chem. 2021;20:100415. https://doi.org/10.1016/j.mtchem.2020.100415.
Njoya M, Basitere M, Ntwampe SKO, Lim JW. Performance evaluation and kinetic modeling of down-flow high-rate anaerobic bioreactors for poultry slaughterhouse wastewater treatment. Environ Sci Pollut Res. 2021;28:9529–41.
Odejobi OJ, Ajala OO, Osuolale FN. Review on potential of using agricultural, municipal solid and industrial wastes as substrates for biogas production in Nigeria. Biomass Convers Biorefinery. 2024;14:1567–79. Review Article, Published: 24 March 2022.
Park S-G, Rajesh P, Sim Y-U, Jadhav DA, Noori MT, Kim D-H, Al-Qaradawi SY, Yang E, Jang J-K, Chae K-J. Addressing scale-up challenges and enhancement in performance of hydrogen-producing microbial electrolysis cell through electrode modifications. Energy Rep. 2022;8:2726–46.
Patel A, Arkatkar A, Singh S, Rabbani A, Medina JDS, Ong ES, Habashy MM, Jadhav DA, Rene ER, Mungray AA. Physico-chemical and biological treatment strategies for converting municipal wastewater and its residue to resources. Chemosphere. 2021;282:130881.
Plattes M, Lahore HMF. Perspectives on the Monod model in biological wastewater treatment. J Chem Technol Biotechnol. 2023;4(98):833–7.
Poghossian A, Geissler H, Schöning MJ. Rapid methods and sensors for milk quality monitoring and spoilage detection. Biosens Bioelectron. 2019;140:111272.
Popescu M-F. The economics and finance of energy security. Procedia Econ Finance. 2015;27:467–73.
Raihan A, Pavel MI, Muhtasim DA, Farhana S, Faruk O, Paul A. The role of renewable energy use, technological innovation, and forest cover toward green development: Evidence from Indonesia. Innov Green Dev. 2023;1(2):100035.
Ramakrishnan A, Gupta SK. Effect of hydraulic retention time on the biodegradation of complex phenolic mixture from simulated coal wastewater in hybrid UASB reactors. J Hazard Mater. 2008;1–2(153):843–51.
Ritambhara Z, Vijayaraghavalu S, Prasad HK, Kumar M. Treatment and recycling of wastewater from dairy industry. Adv Biol Treatm Industr Waste Water Recycling Sustainable Future. 2019;91–115. https://doi.org/10.1007/978-981-13-1468-1_4.
Roufou S, Griffin S, Katsini L, Polańska M, Van Impe JF, Valdramidis VP. The (potential) impact of seasonality and climate change on the physicochemical and microbial properties of dairy waste and its management. Trends Food Sci Technol. 2021;116:1–10.
Saheed IO, Da Oh W, Suah FBM. Chitosan modifications for adsorption of pollutants–A review. J Hazardous Mater. 2021;408:124889.
Salam B, Biswas S, Rabbi MS. Biogas from mesophilic anaerobic digestion of cow dung using silica gel as catalyst. Procedia Engineering. 2015;105:652–7.
Satpathy P, Pradhan C. Biogas as an alternative to stubble burning in India. Biomass Convers Biorefin. 2023;1(13):31–42.
Schink B, Montag D, Keller A, Müller N. Hydrogen or formate: Alternative key players in methanogenic degradation. Environ Microbiol Rep. 2017;3(9):189–202.
Sivakumar P, Bhagiyalakshmi M, Anbarasu K. Anaerobic treatment of spoiled milk from milk processing industry for energy recovery–A laboratory to pilot scale study. Fuel. 2012;96:482–6.
Sivaramakrishnan R, Shanmugam S, Sekar M, Mathimani T, Incharoensakdi A, Kim S-H, Parthiban A, Geo VE, Brindhadevi K, Pugazhendhi A. Insights on biological hydrogen production routes and potential microorganisms for high hydrogen yield. Fuel. 2021;291:120136.
Slin’ko M. History of the development of mathematical modeling of catalytic processes and reactors. Theor Foundations Chem Eng. 2007;1(41):13–29.
Sounni F, Elgnaoui Y, El Bari H, Merzouki M, Benlemlih M. Effect of mixture ratio and organic loading rate during anaerobic co-digestion of olive mill wastewater and agro-industrial wastes. Biomass Convers Biorefinery. 2023;13:1223–9. Original Article, Published: 01 April 2021.
Stasinakis AS, Charalambous P, Vyrides I. Dairy wastewater management in EU: Produced amounts, existing legislation, applied treatment processes and future challenges. J Environ Manage. 2022;303:114152.
Syaichurrozi I, Sumardiono S. Predicting kinetic model of biogas production and biodegradability organic materials: biogas production from vinasse at variation of COD/N ratio. Biores Technol. 2013;149:390–7.
Szuhaj M, Kakuk B, Wirth R, Rákhely G, Kovács KL, Bagi Z. Regulation of the methanogenesis pathways by hydrogen at transcriptomic level in time. Appl Microbiol Biotechnol. 2023;20(107):6315–24.
Traversi D, Bonetta S, Degan R, Villa S, Porfido A, Bellero M, Carraro E, Gilli G. Environmental advances due to the integration of food industries and anaerobic digestion for biogas production: perspectives of the Italian milk and dairy product sector. BioEnergy Res. 2013;6:851–63.
Villarroel-Schneider J, Höglund-Isaksson L, Mainali B, Martí-Herrero J, Cardozo E, Malmquist A, Martin A. Energy self-sufficiency and greenhouse gas emission reductions in Latin American dairy farms through massive implementation of biogas-based solutions. Energy Convers Manage. 2022;261:115670.
Wu D, Peng X, Li L, Yang P, Peng Y, Liu H, Wang X. Commercial biogas plants: Review on operational parameters and guide for performance optimization. Fuel. 2021;303:121282.
Yan M, Treu L, Campanaro S, Tian H, Zhu X, Khoshnevisan B, Tsapekos P, Angelidaki I, Fotidis IA. Effect of ammonia on anaerobic digestion of municipal solid waste: Inhibitory performance, bioaugmentation and microbiome functional reconstruction. Chem Eng J. 2020;401:126159.
Yonar T, Sivrioğlu Ö, Özengin N. Physico-chemical treatment of dairy industry wastewaters: a review. Technological approaches for novel applications in dairy processing. 2018;179.
Zabranska J, Pokorna D. Bioconversion of carbon dioxide to methane using hydrogen and hydrogenotrophic methanogens. Biotechnol Adv. 2018;3(36):707–20.
Funding
This work was supported by the Office of the Deputy Vice Chancellor – Academic, Research and Consultancy (DVC—ARC), University of Dodoma, Tanzania.
Author information
Authors and Affiliations
Contributions
All authors listed have significantly contributed to the development and writing of this article.
Corresponding author
Ethics declarations
Ethics approval and consent to participate
Not applicable.
Consent for publication
Not applicable.
Competing interests
The authors declare no competing interests.
Additional information
Publisher’s Note
Springer Nature remains neutral with regard to jurisdictional claims in published maps and institutional affiliations.
Rights and permissions
Open Access This article is licensed under a Creative Commons Attribution 4.0 International License, which permits use, sharing, adaptation, distribution and reproduction in any medium or format, as long as you give appropriate credit to the original author(s) and the source, provide a link to the Creative Commons licence, and indicate if changes were made. The images or other third party material in this article are included in the article's Creative Commons licence, unless indicated otherwise in a credit line to the material. If material is not included in the article's Creative Commons licence and your intended use is not permitted by statutory regulation or exceeds the permitted use, you will need to obtain permission directly from the copyright holder. To view a copy of this licence, visit http://creativecommons.org/licenses/by/4.0/.
About this article

Cite this article
Mutegoa, E. Anaerobic digestion of spoiled milk from dairy industry for biogas production – optimization of operating parameters and kinetic modeling of the pilot scale study. BMC Environ Sci 1, 3 (2024). https://doi.org/10.1186/s44329-024-00002-6
Received:
Accepted:
Published:
DOI: https://doi.org/10.1186/s44329-024-00002-6