We conducted a between-participants experiment to understand how AI-generated imagery affects designers’ divergent thinking during visual ideation after being exposed to an example design. We compared this scenario to the use of online image search and to no inspiration support. The independent variable was the Inspiration Stimulus: none
(Baseline), Google Image Search
(Image search), or Generative AI
(GenAI). The dependent variables were the
Design Fixation score (the number of features in each sketch in common with the example),
Fluency (the number of sketches produced),
Variety (the number of different types of sketches produced), and
Originality (how infrequently other participants devised the same type of sketch). We conducted the experiment in a controlled laboratory setting following a mixed-method approach. All participants gave informed written consent to participate after reading a plain language statement describing the procedure. The study received ethics approval from our university.
3.1 Study Design and Materials
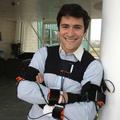
The experimental task consisted of a visual ideation activity in which participants were asked to devise as many ideas as possible for a new chatbot avatar by sketching them on paper. The written design brief given to participants was:
“Your task is to design a character we plan to use as an avatar for a chatbot. This chatbot is kind, loving, caring, and intelligent. It can assist you in solving your problems and is always there for you to talk to whenever you need to. So, imagine that you are conversing with this chatbot in real life and then come up with as many sketches as possible. Remember, you can annotate the sketch if you need to explain more about your design. And please always number each sketch you draw in the order you come up with them.”
This written design brief included an example of an avatar with the figure caption "Example chatbot avatar (for reference only)". The example avatar is shown in Figure
1.
Further, we provided verbal instructions for the participants, asking them to produce as many different ideas as they could during the experiment. For participants in the Image search and Gen AI conditions, we additionally informed them that they could use the digital tool (either Google Image Search or Midjourney, depending on the condition) to gather inspiration for their work. The full study protocol can be found in supplementary material.
Similar to previous work [
30], we started the task by showing participants an example avatar to induce design fixation. We drew inspiration from Ward’s creature invention task [
36,
70], which asked participants to imagine and create animals that lived on a different planet. The authors of this paper created the example chatbot avatar after several design iterations. We created the avatar so that it had 14 salient features, which we used to quantitatively assess design fixation (see Figure
1). We considered the presence of these features in participants’ ideas to be evidence of design fixation, following standard practice in the literature [
30]. In the experimental task, participants were given 20 minutes to sketch their ideas for addressing the brief. We chose this time limit because it is the median time given to participants in previous design fixation studies [
64] and because we aimed to cap each experimental session at one hour to avoid fatigue. We provided participants with pencils, pens, felt pens, and coloured pencils, along with blank A4 sheets to sketch their ideas. A timer was placed outside their peripheral view for them to keep track of time.
The experiment included a single between-participants independent variable—the Inspiration Stimulus available during the task—with three levels:
•
Baseline: no inspiration support.
•
Image Search: Participants had access to Google Images
5 during the task, accessed through a web browser in incognito mode to avoid the browser history influencing results.
•
GenAI: Participants had access to the paid version of Midjourney V4, an AI image generation tool, through a private Discord server running the Midjourney bot (which was required to enter prompts and view outputs from the model). Midjourney V4 was the default model when our study was conducted (May 2023)
6. Participants interacted with Midjourney through textual prompts that the model used to generate sets of four images per prompt.
We assessed participants’ creative output using four standard measures from the design fixation literature: design fixation, fluency, variety, and originality, which we describe as follows:
Design fixation is the unintentional conformity towards existing ideas or concepts that limits exploration of the ideation space [
30,
76]. Researchers use the degree of copying as a method to quantify design fixation [
30,
45]. Therefore, we operationalise design fixation as an objective property of each sketch based on the presence or absence of features available in the example. Following the approach used in design fixation literature [
45], two raters blind to the experiment’s aims counted the presence of features from the example avatar in the sketches created by the participants. We validated the ratings by computing the inter-rater reliability and computed the design fixation score (DFS) as follows:
Fluency refers to the number of ideas produced by the participants [
25,
62]. We operationalise it by counting the number of sketches produced by each participant within the available time (20 minutes).
Variety measures the coverage of the solution space explored during the idea-generation process [
53]. It aims to capture the extent of the design space covered during ideation. If the majority of ideas are similar, it indicates less variety. To compute variety, we assigned a numerical identifier to all the sketches (N=277), imported them into a Miro
7 (an online collaborative whiteboard), and displayed them in randomised order. Two raters (blind to the conditions) iteratively and inductively grouped similar sketches into mutually exclusive clusters. This activity considered several factors: appearance, embodiment, appendages, shape, and accessories. The process resulted in 83 clusters. Each participant received a
Variety score based on the number of clusters their sketches were classified into. We subtract 1 from the number of clusters so that if all of a participant’s sketches belong to the same cluster, their score is 0, and if they have sketches in every cluster, their score is 1.
Originality (also called Novelty [
23,
53]) refers to the uniqueness of a particular sketch within the total pool of sketches made by participants [
25,
30]. It measures how unusual and unexpected a given idea is. Intuitively, the more people have the same idea, the less original it is. We computed an idea’s originality by counting the number of other participants who had an idea belonging to the same cluster, dividing it by the total number of other participants, and computing its complement to 1 (to normalise the value between 0 and 1). In other words, it is the proportion of
other participants who did
not have the same idea. This score is 0 when every participant had an idea in the same cluster and 1 if only a single participant had an idea in that cluster.
3.2 Participants
We recruited 60 participants through digital student notice boards, mailing lists of university student clubs, and word of mouth. Participants expressed their interest through a digital signup form. Participants self-described their prior experience in visual design (measured in years/months). We did not specify this experience should only be professional design experience. We screened participants based on our eligibility criteria and invited those who were 18 years or older and had experience in visual design via email. Further, to avoid dependent relationships, we ensured that none of the participants had a direct connection with the primary researcher running the study. Participants had a mean age of 25.8 years (18–49, SD = 5.4). They included undergraduate, master’s and PhD students from diverse domains such as arts, business, computer science & IT, design, engineering, and science. Each condition had an equal number of participants and was gender-balanced, with 10 women and 10 men per condition (gender was self-described by participants).
3.3 Procedure
Participants booked a time to participate individually based on their availability. The study was carried out in a quiet research laboratory. Upon arrival, participants read a plain language statement describing the study and consented to participate (Figure
3-1).
The experiment had four stages: pre-study questionnaire, main experimental task, post-study questionnaire, and semi-structured interview. Each session lasted 45–60 min in total. In the
pre-study questionnaire, we collected participants’ basic demographic information, their experience with similar design tasks (measured in years/months), and their familiarity with AI image generators (a yes/no question, and participants were asked to list any systems they had used if they answered yes). (Figure
3-2). The main objective of this questionnaire was to understand and control for any variables that might confound the results. After completing the questionnaire, the participants were randomly assigned to one of the three conditions and were assigned a unique ID generated by the computer (3 random digits) (Figure
3-3).
In the
main experimental task (Figure
3, steps 3-7), participants in all conditions received the same design brief, which asked them to design an avatar for a chatbot in 20 minutes, as described in Section
3.1. We started by allowing participants to familiarise themselves with the available materials. Then, the participants assigned to the image search and AI-supported groups received an introduction to the tool they would use during the design task (Figure
3-5). These tools were available for them to use on an Apple MacBook M1 Pro laptop. The tool introduction included a video tutorial created by the research team. This video tutorial explained how to use the tool. After the video tutorial, we allowed participants to ask questions and clarify any doubts.
We provided task instructions to participants both verbally and as a written brief. The written brief included an example of a chatbot avatar, which served as a stimulus to induce design fixation (Figure
3-6). Participants were given 20 minutes to complete the design task (Figure
3-7). We limited the design task to 20 minutes to minimise the possibility of fatigue and because previous studies considered it an ideal duration for maintaining focus for producing ideas with both quality and quantity [
64,
74]. Once participants indicated they were ready to start, the researcher started the screen recording with participants’ consent (in
Image Search and
GenAI conditions), switched on the timer and left them alone to work in the room, allowing them to work independently.
After the design task, the researcher entered the room and asked the participant to fill in the
post-study questionnaire (Figure
3-8). As the post-study questionnaire, we administered the NASA-TLX [
26] to ensure that all conditions induced an equivalent workload. To analyze the NASA-TLX, we used a one-way ANOVA; the effect of the independent variable "condition" on the NASA-TLX overall score was not statistically significant (F(2, 57) = 1, p = 0.37). Therefore, we did not conduct post-hoc tests.
Then, the researcher conducted a
semi-structured interview. Each semi-structured interview lasted 15–20 min. Through the semi-structured interview, we aimed to get insights into the participant’s background and their past experience in creating logos and avatars. We also probed for possible feelings of design fixation during the experiment and how it was affected by their previous knowledge, experience and process. In addition, we asked questions to understand how the stimuli (or lack thereof) affected their ideation process. To conclude the study, we debriefed the participants about the purpose of the research. We thanked each participant with a $20 gift voucher.
3.5 Data Analysis
We used a mixed-method approach for our analysis. For quantitative analysis of design fixation and divergent thinking, we built Bayesian statistical models to quantify relationships between our dependent and independent variables (see section
4.1). We employ Bayesian statistical methods to analyze our results, opting for this approach due to its added flexibility, capability to quantify uncertainty, better handling of small samples, and greater potential for future extensibility. For a comprehensive rationale advocating the use of Bayesian methods over traditional frequentist statistics in the field of Human-Computer Interaction (HCI), see Kay et al. [
33]. Readers who may not be familiar with these methods can find a beginner-friendly introduction in McElreath [
44] and can see examples of their practical application in HCI in Schmettow [
52]. In this manner, we shift the focus away from p-values and dichotomous significance testing, directing our discussion towards causal modelling and parameter estimation.
For qualitative analysis of participants’ interview data, we used Braun and Clarke’s 6-phase approach to reflexive thematic analysis [
7,
60]. The analysis was inductive, i.e. data-driven, based on transcripts of the interviews. Each phase of the analysis was progressed using NVivo12
8 for coding procedures, theme development and naming. The analysis aimed to understand potential causes of design fixation during the experiment and participants’ approaches to creating sketches in each condition. In this paper’s findings, we use interview quotes to illustrate participants’ approaches to prompt creation and their stated approaches to ideation based on AI images. This enables us to probe plausible explanations for observed differences between experimental conditions and explore why particular kinds of sketches were created in response to AI-generated images.