STREAM: Exploring the Combination of Spatially-Aware Tablets with Augmented Reality Head-Mounted Displays for Immersive Analytics
DOI: https://doi.org/10.1145/3411764.3445298
CHI '21: CHI Conference on Human Factors in Computing Systems, Yokohama, Japan, May 2021
Recent research in the area of immersive analytics demonstrated the utility of head-mounted augmented reality devices for visual data analysis. However, it can be challenging to use the by default supported mid-air gestures to interact with visualizations in augmented reality (e.g. due to limited precision). Touch-based interaction (e.g. via mobile devices) can compensate for these drawbacks, but is limited to two-dimensional input. In this work we present STREAM: Spatially-aware Tablets combined with Augmented Reality Head-Mounted Displays for the multimodal interaction with 3D visualizations. We developed a novel eyes-free interaction concept for the seamless transition between the tablet and the augmented reality environment. A user study reveals that participants appreciated the novel interaction concept, indicating the potential for spatially-aware tablets in augmented reality. Based on our findings, we provide design insights to foster the application of spatially-aware touch devices in augmented reality and research implications indicating areas that need further investigation.
ACM Reference Format:
Sebastian Hubenschmid, Johannes Zagermann, Simon Butscher, and Harald Reiterer. 2021. STREAM: Exploring the Combination of Spatially-Aware Tablets with Augmented Reality Head-Mounted Displays for Immersive Analytics. In CHI Conference on Human Factors in Computing Systems (CHI '21), May 8–13, 2021, Yokohama, Japan. ACM, New York, NY, USA 14 Pages. https://doi.org/10.1145/3411764.3445298
1 INTRODUCTION
Mixed reality devices for augmented reality (AR) and virtual reality (VR) are becoming increasingly sophisticated, offering new possibilities for visual data analysis. Recent research in the area of immersive analytics [44] indicates that head-mounted displays (HMDs) increase the understanding of abstract 3D visualizations [34, 35, 65] thanks to egocentric navigation and an increased stereoscopic perception. In addition, the use of AR devices enables users to keep their current work practices, such as using paper notes and collaborating with nearby colleagues [44]. AR environments also allow for the seamless integration of auxiliary devices, for example by augmenting existing data visualizations on large displays [53].
Interaction is an integral part for visual data analysis [45] but can be especially challenging in immersive environments. AR HMDs can make use of multimodal interaction (e.g. using mid-air gestures, head-gaze, and natural language input), which can be beneficial for visual data analysis [39] as it allows users to pick the best input modality for different tasks (e.g. speech for text input). Yet, many tasks (e.g. selection) can only be accomplished with mid-air gestures, as other available modalities (i.e. natural language input, (head-)gaze, egocentric navigation) do not offer the necessary degrees of freedom. These mid-air gestures have, however, shown to be tiring [1, 12, 29], unreliable [19], and inaccurate [14, 20]. In comparison, touch interaction (e.g. via mobile devices) is more accurate [9], less tiring [1, 9], and offers familiar 2D interaction, but lacks the 3D interaction aspect of mid-air gestures. Yet, adding 3D input to these mobile devices has shown to be beneficial when interacting with data visualizations [10, 15] and can offer new interaction possibilities [61, 62] (e.g. spatial triggers). This makes spatially-aware touch devices a promising design space for interacting with immersive data visualizations.
Although past research has explored the use of tabletops (e.g. [18]) and spatially-aware smartphones (e.g. [69]) in AR, we focus on spatially-aware tablets as they offer a good trade-off between user mobility and available display space for touch interaction. Recent research also explored the use of spatially-aware tablets for solid 3D modeling [61], but this forgoes using the tablet as auxiliary output modality for 2D interactions – which can be especially beneficial when interacting with visualizations. In this work, we therefore explore the unique interaction opportunities afforded by the combination of spatially-aware tablets and AR HMDs when interacting with 3D visualizations.
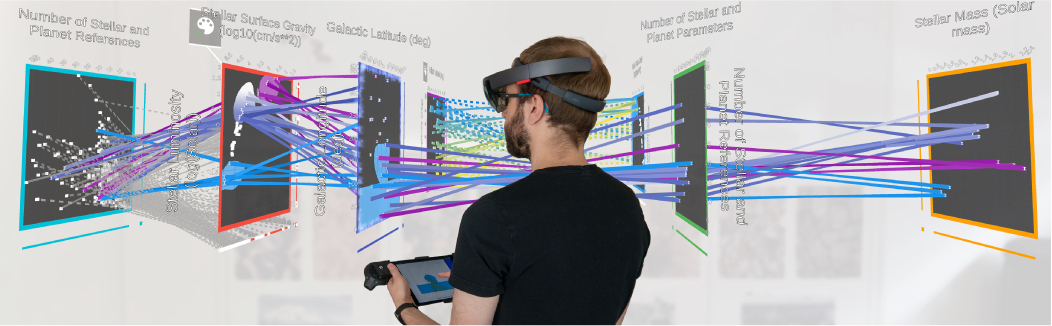
We present the STREAM (Spatially-aware Tablets combined with Augmented Reality Head-Mounted Displays) prototype, which offers multimodal interaction with a 3D visualization (see Figure 1). We use an established 3D parallel coordinates visualization that consists of individual linked 2D scatter plots (cf. [18, 21, 22]), which is well-suited for demonstrating 2D interaction (e.g. configuring scatter plots) as well as 3D interaction (e.g. visualization layout). In this function, the spatially-aware tablet offers familiar touch interaction with the visualization itself, while the tablet's spatial-awareness and the HMD's head-gaze and egocentric navigation can be used for interacting within the 3D scene. To bridge the gap between tablet and AR environment, we developed a novel eyes-free interaction concept for fluid interaction [24] with the visualization: This allows users to interact with the tablet while observing the immediate effects in the AR visualization, without having to incur the cost of switching between different output modalities [27]. Furthermore, our prototype supports a seamless transition between the tablet's display and the AR environment by merging the AR visualization with the tablet's display. Although our concept allows for tightly-coupled (i.e. working simultaneously on the same visualization) and loosely-coupled (i.e. working on separate visualizations) collaboration, an in-depth analysis of co-located collaboration opportunities (cf. [40, 53]) exceeds the scope of this work.
Since our prototype contains many unknown design elements with little prior research, we aimed to assess the feasibility of our concept and uncover initial usability problems. Thus, we evaluated our prototype in a user study to investigate three core topics: (1) the use of the spatially-aware tablet, (2) how participants employed multimodal interaction, and (3) the general system usability of our concept. Therefore, our contributions are:
- We present STREAM (Section 3), which combines AR HMDs and spatially-aware tablets for multimodal interaction with 3D visualizations. Our design is grounded on prior work (Section 2) and employs a novel eyes-free interaction technique for the seamless interaction between the tablet and the augmented reality environment. In contrast to prior approaches that treat AR and touch devices as two distinct output modalities, our novel concepts can bridge the gap between AR environment and touch interface.
- We reflect on our implementation (Section 6) to offer design insights to foster the application of spatially-aware touch devices in AR and research implications indicating areas that need further investigation. These insights and implications stem from both our experience of developing STREAM (Section 3) and our observation of usage patterns from a user study with eight participants (sections 4 and 5).
2 RELATED WORK
In this section we review how previous research relating to the following three topics informed our design choices: (1) hybrid user interfaces, (2) multimodal interaction for data visualizations, and (3) 3D data visualizations in mixed reality.
2.1 Hybrid User Interfaces
Feiner and Shamash proposed the concept of hybrid user interfaces [25] to address the shortcomings of mixed reality HMDs by combining them with more traditional input devices (e.g. offering text input on a keyboard). While mixed reality HMDs have drastically improved over the past decades, the problems addressed by hybrid user interfaces still remain valid for modern hardware. Therefore, researchers have explored different device combinations in mixed reality environments, such as interactive surfaces [18, 52, 57], pen [64], smartwatches [26], tablets [11, 23], smartphones [42], or tangible user interfaces [60]. Some of these approaches also include spatially-aware devices: Szalavári and Gervautz [62] propose general interaction opportunities with a spatially-aware personal interaction panel in AR; Surale et al. [61] establish a vocabulary of interaction techniques for 3D solid modeling using a spatially-aware tablet in VR; Zhu and Grossman [69] explore the design space of bidirectional interaction between a spatially-aware smartphone and an AR HMD; and Büschel et al. [15] show how a spatially-aware smartphone can improve navigation in immersive data visualizations.
However, hybrid user interfaces may require users to switch between different output modalities (i.e. mobile device and AR HMD), which can be costly [27]. We therefore investigated how we can apply eyes-free interaction – allowing users to interact with a device (i.e. tablet) with minimal intrusion on their visual attention [68] – to the space of mixed reality environments. Although eyes-free interaction has been employed on a variety of devices (e.g. phones [6, 43, 46], wearables [13, 50, 66]) and has shown to be beneficial when interacting with large data visualizations via a smartwatch [30], we found no prior work investigating eyes-free interaction with mobile devices for AR HMDs.
In summary, recent research has demonstrated the benefits of different device combinations in mixed reality environments, especially when these devices are spatially-aware. For immersive analytics, tablets offer a good trade-off between available display space for interaction and mobility, but have not been used in this context. In addition, eyes-free interaction techniques can be useful to avoid the cost of switching between different output modalities, but have also not been researched yet in the context of immersive analytics or head-mounted AR. However, prior work often has a clear separation between the device's output modality and the AR environment. Our work attempts to bridge this gap by allowing users to seamlessly transition between the AR environment and the tablet's interface.
2.2 Multimodal Interaction for Data Visualizations
There is a large body of research demonstrating the general benefits of multimodal interactions, such as better accessibility [48], better flexibility [37], and better task performance [49] as users can choose the best input modality for a given task, as well as more reliability, as users may fall back to alternative input modalities [47]. With regard to information visualizations, multimodal interaction can offer unique interaction opportunities [41] and make visualizations accessible to a broader audience [39]. Research has shown the benefits of touch interaction in immersive environments [19], such as greater reliability for fine-grained interaction, and explored the combination of touch with other input modalities, such as natural language input when interacting with a network visualization [54, 59], proxemic interaction by rearranging tablets to interactively build and manipulate visualizations [36], pen and speech for interacting with different visualization types [58], and tangible interaction with a spatially-aware tablet for performing 3D selections [10].
In summary, multimodal interaction has a large body of research showing its benefits. AR environments are especially suited for multimodal interaction, as their integration of many input modalities can be readily used to create multimodal experiences, allowing users to employ the best input modalities for a given task.
2.3 3D Data Visualizations in Mixed Reality
Although 3D visualizations have long been viewed with skepticism [44], there is an increasing amount of research indicating the benefits of 3D visualizations in mixed reality environments (e.g. [5, 63, 67]). Recently, Kraus et al. demonstrated the usefulness of immersion for 3D cluster identification [35] and showed that 3D heatmaps can outperform 2D heatmaps when comparing single data items [34]. In addition, Büschel et al. [16] extracted tablet usage patterns for spatial interaction with 3D visualizations in handheld VR. Over the past few years, different 3D visualizations in mixed reality environments have been explored, such as flight trajectories [31], 3D parallel coordinates [18], interactively connecting and linking together different axes [5, 22], link routing between different visualizations in a 3D space [51], or 3D geotemporal visualizations [60]. Consequently, frameworks that facilitate the creation of immersive visualizations have emerged, such as DXR [56], IATK [21], or VRIA [17]. Furthermore, recent research has investigated the opportunities of co-located collaboration, for example for augmenting large interactive displays [53] and within a shared virtual environment [40].
In summary, there is a growing body of work investigating and exploring the benefits of 3D visualizations in mixed reality environments. To narrow our focus to the multimodal interaction with spatially-aware tablets, we drew from the presented works and employ an already established 3D parallel coordinates visualization: In terms of input compatibility, linked 2D scatter plots (e.g. as found in ART [18] and ImAxes [22], and supported in IATK [22]) seems fitting, as the visualization necessitates both 2D input (e.g. interacting with the scatter plots) and 3D input (e.g. visualization layout).
3 STREAM
We created STREAM (Spatially-aware Tablets combined with Augmented Reality Head-Mounted Displays) as a proof of concept to investigate the combination of spatially-aware tablets with AR HMDs for multimodal interaction with 3D data visualizations. We chose an established 3D parallel coordinates visualization that is easy to understand (cf. [18, 21, 22]), allowing us to study our interaction concepts without confronting users with both the complexity of a novel visualization and novel interaction concepts. Although our interaction concept relates to the unique challenges afforded by this particular 3D visualization, we are confident that our findings can be applied to other 3D visualizations as well (e.g. heatmaps). The following sections1 describe the visualization, device responsibilities of our tablet and AR HMDs, interaction design, and prototype implementation. Our prototype is also freely available as open source project2.
3.1 Visualization
STREAM uses a 3D parallel coordinates visualization consisting of linked 2D scatter plots (see Figure 2), allowing users to interactively explore a multidimensional data set. Scatter plots can be individually placed anywhere within the AR environment and links can be established between any two scatter plots (barring circular connections). Each link represents a set of lines, and each line represents a multidimensional record from the data set that is shot through the scatter plots and manipulated by the same (in terms of position, color, visibility). Links in STREAM are directional (as indicated by particle effects beneath each link), allowing users to progressively reduce or combine subsets of the data, akin to a stream of data. To preserve line connections, missing values are placed in a dedicated area beneath each axis and are further highlighted with a dashed line (cf. [18]).
Scatter plots manipulate the data (and thus, lines) by defining their position and color, but can also filter out items for subsequent connections. For color and filtering, users can toggle different attributes for each scatter plot and define selections within each scatter plot. Each selection has either one of eight predefined solid colors, or one of four predefined color gradients. Furthermore, each scatter plot has three attributes: filter, colorize, and sort. The filter attribute determines if a scatter plot's selections remove data items not contained within a selection from subsequently connected scatter plots; the color attribute colorizes data items based on their current selection for all connected scatter plots (i.e. only one scatter plot can have the color attribute enabled), allowing for a linking & brushing approach [33]; lastly, the sort attribute discards the scatter plot's X-axis in favor of sorting the data items by their Y-axis values. Similarly, each link can also have the color attribute: When active, the data is colored based on the relative differences between the two connected scatter plots (e.g. green for increasing, red for decreasing values).

3.2 Device Responsibilities
To make full use of the AR HMD and the spatially-aware tablet, each component of our 3D visualization (i.e. scatter plot, link) has a representation in the 3D AR scene, and a 2D counterpart suitable for viewing on the tablet (see Figure 3). The 2D visualization always matches the user's perspective on the 3D visualization (e.g. 2D scatter plot is flipped horizontally when users looks at 3D scatter plot from behind). Both representations are synchronized in real time, thus offering fluid interaction across devices that leverages the unique benefits of each device (cf. [18]).
The AR HMD is suited for viewing and interacting with 3D visualizations, thanks to its stereoscopic output and egocentric navigation (cf. [35]). We therefore employ many of its available input modalities (i.e. head-gaze, egocentric navigation) for tasks that require 3D input (e.g. positioning of scatter plots). While the by default available mid-air gestures are also suited for 3D input, we chose to forgo mid-air gestures in favor of concentrating on the tablet interaction. In addition, our choices were also influenced by the technical restrictions of available hardware (i.e. Microsoft HoloLens 1). Although we used head-gaze in this specific scenario, our concepts are responsive and work with both head-gaze and eye-gaze, depending on what is available.
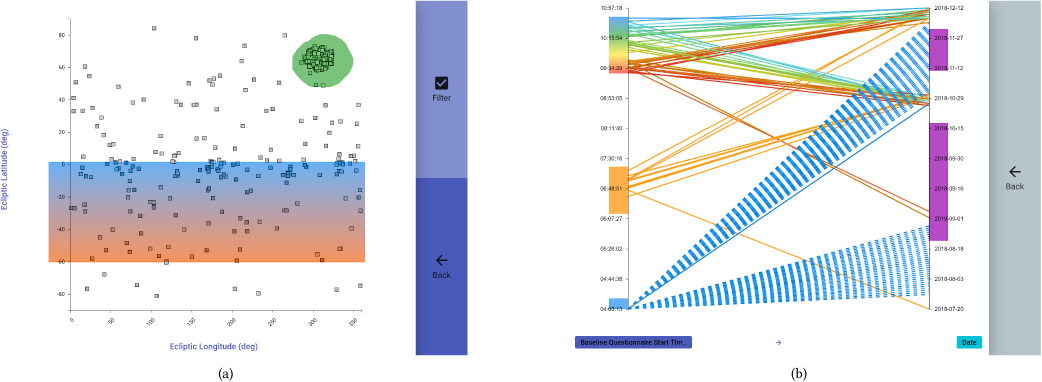
In contrast to the AR HMD, the spatially-aware tablet excels in viewing and interacting with 2D information, thanks to its high-resolution display and touch-based interactions. It is therefore suitable for 2D interaction (e.g. creating selections), but can also assist in tasks that require 3D input, thanks to its spatial awareness. The 2D display can also be beneficial when investigating relative differences, as the simplified 2D representation (see Figure 3(b)) removes any perspective distortion that can occur in a 3D scene.
3.3 Interaction Design
The following paragraphs illustrate our interaction design to control the previously described visualization.
Selection. STREAM uses a selection-based interaction approach, meaning that users may only interact with one object (i.e. scatter plot or link) of the visualization at a time. To better distinguish between the objects, all scatter plots receive one of eight colors upon creation, as indicated by a colored frame. The current selection is highlighted by particle effects in AR and by the tablet's matching background color scheme (see Figure 4(c)) – or gray, if a link is selected. Furthermore, a line in the user's field of view points towards the currently selected object (see Figure 4(a)).
The current selection can be changed through the user's head-gaze, as indicated by an AR cursor. This allows users to quickly select objects from far away. To mitigate the Midas touch problem, we use a long dwell time (3 s) until the selection is confirmed. An instantly-visible loading indicator will appear around the AR cursor and turn green once the selection is complete. Similar to Jacob [32], the selection process is further enriched by the tablet: During selection, the tablet will instantly display the color of the selected object. In addition, users can tap anywhere on the tablet to skip the dwell time (gaze and commit).
Eyes-free interaction. We employ a touch-based menu (see Figure 4(c)) for general system control actions (e.g. creating and deleting objects). To allow users to observe their actions in the AR environment and avoid the cost of display switching [27], we employ a novel eyes-free interaction concept [68] consisting of two components: (1) The tablet menu is divided into four large prominent areas, one for each corner: Assuming that the user holds the tablet in both hands, each corner can be touched with the user's thumb without having to look at the tablet. (2) A head-up display (HUD) mirrors the actions of the tablet menu's four prominent areas (see Figure 4(a)), so that users do not have to memorize where each action is located on the tablet. Although this approach is restricted to at most four actions, future work could explore and compare alternative design solutions (e.g. scrollable menu, marking menus [46], incorporate touch input beyond the front touchscreen [38]). Additional actions are available in the middle of the menu, which require a display switch and thus have an increased interaction cost. We make use of this increased interaction cost for actions that require the user's attention (e.g. deleting scatter plot), or require the user to look at the tablet for further action (e.g. viewing 2D visualization).

Symbolic interaction. In contrast to eyes-free interaction where users focus on the AR environment, STREAM also offers symbolic interaction when using the tablet as output modality. This is mainly used for scatter plot manipulation when viewing a 2D visualization (see Figure 3), allowing users to directly create selections by drawing on the scatter plot visualization (e.g. encircling clusters) or drawing directly on an axis (e.g. selecting a range of values). This could also be extended to support 3D selections (cf. [10]), thus allowing selection in other 3D visualizations. Furthermore, the symbolic interaction can be useful for assigning axis dimensions, where users can scroll through a list or use the on-screen keyboard to search for specific dimensions.
Tablet lens. To decrease to cost of switching displays between the AR environment and tablet for symbolic interaction, we make use of the tablet's spatial awareness as a kind of 2D lens into the AR environment: While holding the tablet vertically, the tablet automatically displays the 2D visualization of the targeted AR object, bridging the gap between tablet and AR environment. If a scatter plot is selected, the AR scatter plot automatically rotates to match the tablet's position (see Figure 5). This allows users to quickly make changes using symbolic interaction without losing the context of the AR environment. After activating the tablet lens, users can also hold the tablet in a more comfortable (i.e. angled) position to interact with the 2D visualization view. Once the tablet is put back into a level (i.e. horizontal) position, the tablet lens is deactivated and the main menu is shown.

Voice input. In addition to the eyes-free interaction, STREAM also offers voice commands as alternative input modality for system control. Although complex voice commands can be beneficial (cf. [58, 59]), they exceed the scope of this work. Similarly, many actions cannot be expressed as voice commands (e.g. drawing 2D selections), and therefore have no counterpart. To better support potential collaborative work and thus prevent any accidental voice commands, STREAM uses a trigger for voice command activation: Users need to hold two fingers on their tablet to activate voice commands. Once the system is listening, the AR HUD shows a list of all available actions with highlighted trigger word (see Figure 4(b)).
Scatter plot placement. Users can place individual scatter plots anywhere within the environment using multimodal interaction: The user's head-gaze determines the general position of the scatter plot, the distance can be adjusted through a drag gesture on the tablet, and the scatter plot's rotation is synchronized with the tablet's rotation. The placement can be confirmed by tapping on the tablet or via voice command. To facilitate the comparison of relative differences between scatter plots, users can also align scatter plots to each other: When a scatter plot is moved near an existing scatter plot, it aligns itself to the nearby scatter plot (see Figure 6). Dashed blue lines indicate the origin and range of the alignment – by moving the scatter plot away from these lines, the alignment is canceled. While the alignment is active, users can also hold a finger on the tablet to extend the alignment infinitely. Once the finger is lifted, the scatter plot is automatically placed at its current position.

Linking. STREAM uses the head-gaze and commit input model to establish links between scatter plots. When a scatter plot is selected, users can create a new link via the main menu, starting from the selected scatter plot; a preview of the new link then follows the user's head-gaze in AR and snaps to any valid scatter plots. Lastly, the connection can be canceled or confirmed either by touching the tablet, or via voice command. The link's direction can also be inverted via the system control menu.
Focus mode. Because the AR interaction hints may be distracting when analyzing the data, STREAM offers a focus mode in the main menu which disables the eyes-free interaction by hiding both the AR HUD and removes any interaction elements from the tablet, save for a small central button to turn off the focus mode. While in focus mode, users can still use voice commands for system control actions or use the tablet lens to quickly manipulate a scatter plot.
Proxemic interaction. STREAM also offers subtle, implicit proxemic interactions [4]: Small text may only appear when a user is close; icons and text (e.g. dimension labels) will automatically rotate towards users in close vicinity; and lines will disappear if the user is standing inside a link, giving the user a clear view of the connected scatter plot. We decided against any explicit proxemic interactions, as they may be hard to interpret for users (cf. [2, 36]). Although showing the proxemic zones may be feasible in AR, such explicit proxemic interaction exceeds the scope of this work.
3.4 Prototype Implementation
We chose the Microsoft HoloLens 1 as AR HMD for STREAM, as it allows users to move around freely and allows users to quickly glance at their tablet. To compensate for the limited augmented field of view, the visualization size (20 cm) is a trade-off between fitting well within the user's sight, yet large enough to guarantee readability. For the tablet we chose an Apple iPad Pro 2017 (2048 × 1536 pixels, 9.7′′, 437 g) with a custom 3D printed frame for mounting two HTC Vive Trackers 20183 (see Figure 7), resulting in a total tablet weight of 715 g.
The software uses a client/server structure using TCP and WebSockets, allowing for real-time synchronization between all clients. We use a dedicated Windows 10 machine to process the Vive Tracker data to make the tablets spatially aware. To unify the different coordinate systems (e.g. HoloLens, Vive Trackers), we place a Vive Tracker on a visual marker and calibrate each client once during start-up (cf. [3]). We used Unity 2019.1 for developing the HoloLens application and processing Vive Tracker data, while the spatially-aware tablet runs as native web application. Our server was written in TypeScript and runs in a multithreaded Node.js v12 runtime. Due to limited hardware capabilities of our mobile devices (i.e. HoloLens, iPad), the server is responsible for data processing. Similarly, we employ GPU instancing to render all data items in AR using custom shaders that receive position and color data via textures. This also allows us to smoothly animate data items using compute shaders with little impact to performance.

4 USER STUDY
We used STREAM to investigate in a user study how users can utilize the provided multimodal interaction capabilities of our specific device combination. We thus focus on three core topics: (1) the use of the spatially-aware tablet; (2) the multimodal interaction; and (3) the general system usability. To narrow the scope of our study, we chose a single-user scenario with guided tasks that do not require preexisting knowledge of visual data analysis. Additionally, we intentionally chose non-experts to further shift the evaluation focus towards the interaction concepts of our prototype. We collected both qualitative and quantitative data from each participant to gain further insights into the specific usage of STREAM. We followed all ethical and sanitary guidelines provided by our local university at the time of the study.
4.1 Participants
We recruited 8 students (4 female, 4 male) from different backgrounds (e.g. economics, natural sciences, psychology, history) aged between 21–27 (M = 24.13, SD = 2) from the local university. No participant had any disability hindering their physical movement, no participant had any form of color blindness, and all participants were right-handed. We asked participants to rate their experience in different topics on a scale from 0–5 (no experience – very experienced): Participants had mixed prior knowledge concerning data visualizations and data analysis: 4 had moderate experience (3–4) with visualizations (with 2 participants having prior experience with 3D data visualizations), and 4 participants were moderately experienced (3–4) with data analysis tools (e.g. R, Microsoft Excel). Combined, only 3 participants had no experience in either data visualization or data analysis. Prior usage of AR and VR was similarly mixed: 4 participants have not used any AR application prior to this study, while 3 participants have not used any VR application. In total, 3 participants had no prior experience in either VR or AR applications. Although all participants used a smartphone on a daily basis, only one participant used a tablet on a daily basis.
4.2 Apparatus
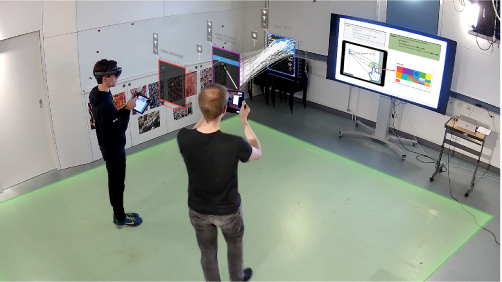
The study took place in a spacious room with a walkable workspace of approximately 3 m × 2.5 m, giving users ample space to place their visualizations and move around freely (see Figure 8). A large 84′′ monitor was used to convey information about the application, and later display the participant's tasks during the actual study. In addition, a desk outside of the participant's workspace was used for filling out questionnaires and the final interview. During the study, participants wore a Microsoft HoloLens 1 and carried an Apple iPad Pro (9.7′′) equipped with two HTC Vive Trackers (see Figure 7), while the experimenter used a laptop to control the study. In addition, the STREAM prototype was adjusted to focus on our study's tasks: Once less than ten data points are visible on a scatter plot, the tablet shows each data point's exact values in its 2D visualization; features that did not pertain to the tasks were removed (i.e. focus mode, filter and sort attribute), resulting in a simplified user interface. We also implemented a passive spectator viewer that allowed the experimenter to view the participant's AR environment through an Apple iPad Pro (9.7′′) (see Figure 8). The experimenter can either navigate the AR environment through egocentric navigation, or spectate the participant's AR view directly (due to technical restrictions without real world background).
4.3 Tasks & Data Set
Due to our narrow focus on evaluating STREAM's interaction concepts with non-experts, we opted for an artificial workflow that force participants to interact with STREAM's features, with tasks that resemble the workflow of similar systems. We imported the NASA Exoplanet data set4, as its high-dimensionality is a good fit for our visualization. To ease the burden on our participants and hardware, we reduced the data set to 500 randomly picked planets (from approx. 4000) and picked 22 dimensions (from 356).
Each task required participants to create new scatter plots, choose appropriate dimensions and selections, and link scatter plots together to find the one planet that matches the task's description. We used four tasks, all with a similar structure: “Find the Planet Name of the planet with the following properties: Ecliptic Longitude: Between 100° and 200°; [ ...]” Participants received step-by-step instructions to solve the first two tasks, and on-demand support for the latter two tasks. Although no time limit was imposed on participants, we chose tasks that were solvable in less than 30 minutes total, as prolonged wear of the HoloLens can cause discomfort [19].
4.4 Procedure
Participants were first welcomed and provided with introductory documents, containing information about the purpose of the user study and its procedure, a consent form, and a demographic questionnaire. The experimenter then explained the STREAM prototype and its visualizations to the participants, along with its interaction concepts (e.g. eyes-free interaction). Afterwards, participants were instructed on how to properly put on the HMD to ensure a comfortable wear and good visibility. After the application was started remotely by the experimenter and calibrated, participants received step-by-step instructions for the first two tasks by showing the participants visual instructions on a large display and monitoring their progress through STREAM's spectator viewer on a tablet. Once participants successfully completed the initial two tasks, they were given two similar tasks to solve on their own (without time limit). Afterwards, the experimenter asked participants to fill out a user experience questionnaire [55] and conducted a semi-structured interview. Participants then received monetary compensation for their time. In total, study duration ranged between 40–90 minutes (M = 67 min, SD = 16 min), with participants spending between 24–50 minutes (M = 31.14 min, SD = 9.6 min) using STREAM: Some participants went straight for the goal, while others playfully engaged with the application to solve the problem. One participant aborted the study after the second task due to simulator sickness, but still took part in the questionnaire and interview.
4.5 Data Collection
We collected audio data from a centrally placed microphone and video data from two opposing ceiling-mounted cameras (for verification of participant behavior). Furthermore, the screen of both the participant's and the experimenter's tablet were recorded. We did not record any video from the HoloLens due to significant performance degradation. Instead, all application and interaction data was logged on our server (e.g. user position within the room, touch input coordinates), allowing for a complete reconstruction of the study. This data was supplemented by a demographic questionnaire before the study and the user experience questionnaire after task completion. To gain further qualitative insights, we asked participants to use the Thinking-Aloud technique during task completion and conducted a semi-structured interview afterwards.
5 FINDINGS
We organized our observations (using the critical incidents technique), logging data, and user feedback using affinity diagramming to extract common themes. The followings sections discuss these themes in accordance with our research objectives of (1) the use of the spatially-aware tablet, (2) the multimodal interaction, and (3) the system usability.
5.1 Use of Spatially-Aware Tablet
We specifically investigated the use of the tablet's spatial awareness and how participants used the eyes-free interaction concept. In addition, participants expressed concerns about dropping the tablet during use.
Spatial awareness. The tablet's spatial awareness was used sparingly when moving scatter plots: After placing the first scatter plot, the tablet's spatial awareness was quickly forgotten in favor of aligning scatter plots to each other. Participants also thought that the tablet had to match scatter plot exactly (cf. high degree of compatibility [8, 15]), and thus tried to hold the tablet vertically to rotate the scatter plot. Although one participant generally appreciated the rotation feature, the participant found the tablet uncomfortable to hold in certain positions (e.g. when rotating by 90°).
On the other hand, the spatial awareness did play a significant role as spatial trigger (i.e. activating tablet lens): All participants often rotated their tablet briefly into a vertical position to switch to the tablet's 2D visualization view, thus circumventing a menu action (out of a total of 235 actions to activate the 2D visualization view, 127 were performed via touch and 108 via spatial trigger). Three participants even used this spatial trigger more often than the corresponding menu action. However, participants quickly put the tablet down into a position where the 2D visualization was still active, yet more comfortable to hold (see Figure 9).

Eyes-free interaction. Every participant reported that they understood the eyes-free interaction concept (i.e. interacting with the tablet without looking at it), although two participants admitted that they still looked at the tablet out of habit. Still, most participants appreciated the eyes-free interaction, especially due to the large buttons: “Consciously I never had to look at the tablet [ ...] I thought the two big buttons on the left and right side were really intuitive and practical.” (P1). Yet, even with HUD indicators and large buttons, all participants did not feel confident enough to use the eyes-free interaction right away: “I did actually use [the eyes-free interaction] once I knew [ ...] where each button is located” (P7).
Fear of dropping tablet. Participants generally appreciated having something tangible to manipulate objects from a distance: “That you can link this with your tablet, that's like a kind of remote control, that's really good” (P8). However, four participants expressed concerns about accidentally dropping the tablet, especially when holding the tablet in one hand (e.g. while drawing selections or using the on-screen keyboard). Three participants found the tablet heavy when holding it in one hand, yet upon further inquiry they indicated that this fear was not related to the tablet's extra weight.
5.2 Multimodal Interaction
For the use of multimodal interaction, we investigated four topics: (1) whether our choice of input modalities for a given tasks were justified; (2) if and how voice commands were used; (3) if the multimodal selection of 3D objects posed any issues; and (4) how participants used the AR environment, especially with regard to egocentric navigation.
Choice of input modalities. Participants generally liked that they had the option of using several different input modalities: “I also liked that you can speak, that you can do that with the [HoloLens], and with the tablet and all that.” (P6), and “I liked [the different input methods], I think they were somewhat intuitive after a while.” (P5) Two participants also suggested additional alternatives, such as mid-air gestures for linking scatter plots. Due to the concerns of dropping the tablet, one participant suggested using smartphones or VR controllers for general interaction, but did prefer the tablet for interacting with the 2D scatter plots (e.g. when creating selections). Two participants also tried to place a new scatter plot in-between two connected scatter plots, expecting that the existing link would automatically adapt to include the new scatter plot. This may warrant further investigation into utilizing proxemic interaction for more natural input (cf. [2, 36]).
Voice commands. While all participants had to perform at least one voice command as part of the introductory task, only one participant continued to use voice commands as part of their workflow (out of 635 commands where both options were available, only 36 were performed with voice commands). Still, three participants appreciated that they at least had an alternative option available, but five participants stated that they strongly preferred touch over voice: “I'm more of a haptic person, I want to grab things with my hands” (P3) and “I think touch is somehow more intuitive” (P5). However, four participants were open to the idea of using more complex voice commands (e.g. as used in [19, 59]), especially if it saves time. Still, showing the keywords as part of the HUD proved beneficial: “I liked that the [hints] were there [ ...] for a voice command that I didn't have present, I liked that I could look at it and there it is.” (P1)
Selection. Generally, participants found the selection through head-gaze easy to use, especially in simple visualizations with few selectable objects. While selecting scatter plots was straight-forward, selecting a link between two scatter plots caused problems for two participants, as their hitbox (i.e. selection target) was not apparent to the user. However, once an object was selected, it was immediately obvious to all participants due to both the particle effects in the AR environment as well as the tablet's matching background color: “What I liked, that it became instantly clear that you're now on the green scatter plot, because your tablet's background was now green [ ...] I really liked that” (P7).
To prevent the Midas touch problem, we employed a long dwell time with immediately-visible loading indicator. As a result, all participants reported that they never selected anything by accident, though two participants did find the immediate change of the tablet's background color distracting. Our logging data confirms that if an object was being selected, users almost always either completed the selection, or canceled the selection very early: 80% of canceled selection attempts lasted less than 0.8 seconds (M = 0.48 s, SD = 0.59 s). Yet, some participant did sometimes look away moments before the selection was completed, thereby canceling the selection accidentally. Two participants therefore suggested feedback (e.g. auditory) in addition to the existing visual feedback (i.e. indicator turning green) when the selection has been completed.
Lastly, we investigated if participants were able to skip the selection's dwell time by tapping on the tablet. Even though all participants had to skip the selection at least once as part of the tutorial, only three participants used it consistently during subsequent tasks. However, these three participants used this skipping method more frequently than waiting for the dwell time to complete: “That was very cool, that I could tap on [the tablet] and then it directly finished loading, I liked that.” (P7) Our logging data shows that manual skips occurred on average approximately 1.5 s after the selection started (M = 1.43 s, SD = 0.7 s, see Figure 10).

AR environment. Seven participants liked the use of AR, as they felt safe when moving around and felt an emotional connection to a workspace: “You still have the feeling of somehow sitting in a workplace” (P7). One participant suggested aligning virtual objects to real objects (e.g. walls), or put them into predefined anchors. Two participants also felt that a large, sterile room was necessary, as their own workspace was too small and too cluttered.
Participants generally made use of the spacious room to move around: Movement was sometimes explicit (e.g. participants stepping closer to zoom in) and sometimes implicit (e.g. slightly moving to select an object). Participants with more complex visualization (i.e. visualizations with more links and scatter plots) moved around more than users with less objects, suggesting that head-gaze alone may not be sufficient for selection in complex visualizations. The option to move around was, however, appreciated: “I like that you can move around, because otherwise you just sit there. [ ...] You can actively work with it.” (P3)
5.3 System Usability
Here we focus on the general system usability and on topics such as the user experience, the interaction with the visualization, and the use of space through placement and alignment of scatter plots.
User experience. In general, participants were positive about using the system and felt that it had “much potential” and that it was “interesting”, “cool”, but also “complex”: “What I liked, it reacted very quickly and was always there wherever I brought it with me.” (P6), and “It was so much fun to go through these tasks with it.” (P1) This is reflected in the user experience questionnaire (ranging from -3 to 3), receiving high scores in the hedonic qualities (stimulation: M = 2.3, SD = 0.33; novelty: M = 2.13, SD = 0.42) and scoring well in attractiveness (M = 1.78, SD = 0.36).
Due to our artificial workflow, the task related quality aspects received mostly lower scores (perspicuity: M = 0.88, SD = 0.92; efficiency: M = 1.25, SD = 0.08; dependability: M = 1.13, SD = 0.29). Additionally, all participants required some time to get used to the system: “As soon as you performed each action twice it actually was very intuitive and you could get a feel for it, I thought that was great” (P7). This habituation period may be partially due to the “many new terms” some participants had to learn which were “initially overwhelming”, but also due to the novelty of an AR HMD which most participants did not experience before and a novel interaction concept (i.e. eyes-free interaction with spatially-aware tablet). Two participants therefore valued the initial introduction (i.e. presentation and guided tasks), but wished for an even more interactive tutorial.
Visualization. The visualization was quickly understood by seven participants: “First it looked very complex, but as soon as I understood the filter feature [ ...] I thought it was actually very understandable” (P4). In our scenario, the 3D visualization served as a helpful overview, with three participants mentioning that it helped them keep track of each step and visually see how the data is reduced.
Participants also immediately understood the connection between the 2D visualization and its AR counterpart. While the tablet's size was appreciated when interacting with the 2D scatter plot, five participants did expect common touch gestures (e.g. pinch-to-zoom) to be available, which were not included due to an overlap with the voice command activation trigger: “Intuitively I thought you could zoom in somewhere on the tablet.” (P4)
Scatter plot placement & alignment. As part of the tutorial, participants had to place the first scatter plot at a position of their liking, and subsequent scatter plots in a straight line to get familiar with the alignment feature. Participants instantly grasped the multimodal interaction concept (i.e. using head-gaze, egocentric navigation, and touch gestures) to position scatter plots. Although the alignment was not necessary for the study's tasks (as there was no comparison of relative differences), the alignment was very well-received: “Especially [the alignment] was really good, because [ ...], once I opened a second layer, I could align the scatter plots with the ones next to them, and then it's clearly arranged” (P1), and “I was very, very happy about the alignment function” (P7).
6 Insights & Implications
In this section, we reflect on our implementation and present design insights (D1–D6) to guide the development of spatially-aware touch devices in AR, as well as research implications (I1–I7) for topics that need further investigation. Our insights and implications are based on both our design of STREAM (Section 3), which is grounded in the analysis of prior work (Section 2), and the usage patterns observed in our user study (Section 5). We structure our reflections based on our three research objectives of (1) the use of the spatially-aware tablet, (2) the multimodal interaction, and (3) the system usability.
6.1 Spatially-Aware Tablet
Although our interaction design and study tasks did not use the tablet's spatial awareness to its full potential, our results are still in line with previous research: (1) the tablet's physical rotation was not well-understood, uncomfortable, and overshadowed by the alignment feature (cf. [28]); and (2) our tablet lens, though not entirely used as we intended, was quickly adapted into the participant's workflow as spatial trigger (cf. [8]) (D1). Prior research has investigated a multitude of different spatial actions (e.g. tablet flip [61], holding a device at different angles for different actions [46]). Here, a study could investigate the feasibility of different spatial actions in terms of accuracy, fatigue, and speed (I1). Similarly, we chose a tablet as it provided a good trade-off between display size for symbolic interaction and mobility for egocentric navigation. This allowed us to interact with the 3D environment on a familiar 2D interface, which can also be applied to more general use cases (e.g. fine-grained control of object properties, cf. [62]). Since our design choice was informed by prior work on mobile devices in mixed reality (e.g. [10, 61, 62]), we did not compare our approach against alternative devices (e.g. VR controllers, mid-air gestures) or device sizes. Further studies are necessary to compare different approaches for interacting with 2D visualizations on different devices regarding accuracy, fatigue, and task completion time (I2).
Furthermore, our eyes-free interaction concept allowed users to concentrate on the AR environment, while also providing some of the benefits of touch interaction, such as haptic feedback (D2). However, our eyes-free interaction technique has inherent design limitations, as it occupies most of display space for the large buttons and is limited to at most four different actions (one for each corner). Because our eyes-free interaction design represents only one of many possible alternatives, further studies are necessary to compare alternatives, such as touch gestures (e.g. [15, 30]) for different actions or touch gestures to control radial menus (e.g. [7]) (I3). Despite these limitations, the eyes-free interaction can be a good fit for general hybrid user interfaces, as it allows users to benefit from a physical interface (e.g. tablet) while concentrating on the AR environment.
| Design Insights – Spatially-Aware Tablet |
|
| Research Implications – Spatially-Aware Tablet |
|
6.2 Multimodal Interaction
AR devices offer many opportunities to employ multimodal interaction, which can be beneficial for offering alternative input methods (in our case, voice commands) and combining the advantages of different modalities to unlock more degrees of freedom (e.g. placing objects using head-gaze, touch gestures, and egocentric navigation). Although voice commands were underused in our case, using the tablet as eyes-free trigger to activate voice commands proved to be useful and can be beneficial for collaborative scenarios (i.e. prevention of accidental voice commands). In addition, AR HMDs allow for unintrusive, always-visible, and context-aware hints of which voice commands are available to the user (D3) – which, in our case, extended the already available HUD for eyes-free interaction.
For the selection of different objects within the 3D visualization, we chose head-gaze combined with egocentric navigation, as this allowed for the selection of distant objects. While this worked well when only few objects were available for selection, users had to increasingly use egocentric navigation for more complex visualizations. This can be mitigated for example by selecting objects by touching the objects with the corner of our spatially-aware tablet (cf. [61]), but forgoes the advantages of head-gaze. Here, research could explore multimodal combinations that could, for example, allow users to select an occluded object from far away (I4).
Prior work (e.g. [32]) also advises for the use of dwell time to prevent the Midas touch effect. This works well in AR, as current AR devices employ an AR cursor to signify the exact position of the user's head gaze. This AR cursor can be useful to add contextual, unintrusive information, such as a loading indicator that informs the user of the current selection (D4). However, this indicator may give a false sense of security, causing users to look away before the selection has been completed; here, delaying the feedback of a completed selection by a few milliseconds can be beneficial.
During selection, the tablet performed two roles: (1) The tablet showed the color of the currently selected object, which was beneficial for some, but also distracting for others. (2) When selecting an object, users could tap on their tablet to instantly skip the dwell time. This skipping proved to be very beneficial, making the selection process much more responsive (D5).
Lastly, we also identified many opportunities for implicit proxemic interaction that can be helpful to make text within the 3D scene more readable (e.g. by rotating text towards the user). We decided against explicit proxemic actions on the basis of prior work, which found that proxemic zones may be hard to convey (cf. [2, 36]). However, these zones or interaction opportunities can be easily conveyed with AR, depending on the current context: For example, our alignment lines show the range in which the alignment is active. Further research could therefore explore the feasibility of different cues for proxemic interaction in AR (I5).
| Design Insights – Multimodal Interaction |
|
| Research Implications – Multimodal Interaction |
|
6.3 System Usability
To narrow our focus on the use of spatially-aware tablets in AR, we chose a 3D visualization that was easily decomposed into 2D components for interaction with the tablet. This allowed us to split our tasks into 2D interaction (e.g. drawing data selections) and 3D interaction (e.g. scatter plot position), thus leveraging the strengths of multimodal interaction and especially touch-based interaction. Due to hardware limitations, we made the visualization size a trade-off between good legibility and fitting within the user's augmented field of view. However, this required a large room to make full use of the visualization. Future iterations of AR HMDs may become commonplace in the user's workspace; future research could therefore investigate how to make effective use of this limited space for organizing and interacting with visualizations in the user's workspace (I6). Although we could make use of navigation techniques (cf. [15]), this space could also offer new interaction opportunities, for example by using predefined anchors in the user's workspace.
Due to our choice of visualization, we also added an alignment feature, allowing users to compare data between two scatter plots without introducing errors due to position differences. While this feature was not necessary in our user study, it appealed to all of our participants (D6). This alignment feature has the potential of reducing clutter within an AR environment, even outside of the context of immersive analytics – an important yet often neglected topic.
Lastly, while we chose a single-user scenario to explore the feasibility of our interaction concept, we still added the spectator viewer, allowing us to provide guidance to users in AR. One participant expressed the potential for this kind of asymmetric collaboration: “I found it really cool that you could look at what I was doing with my HoloLens by simply coming to me with a tablet, and that you did not have to also put on a HoloLens or boot up something else; but that you could simply look into it ‘quick and dirty’, I thought that was cool. Because assuming you just discovered something really great and you want to show it to someone else, then they can just look via the tablet” (P7). Recent works have demonstrated the benefits of symmetric collaboration in mixed reality environments for visual data analysis (cf. [18, 40, 53]), but the spectator viewer of our STREAM prototype also indicates the promise of asymmetric mixed device collaboration (I7).
| Design Insights – System Usability |
|
| Research Implications – System Usability |
|
7 LIMITATIONS & FUTURE WORK
To uncover initial usability problems and investigate the general feasibility of our interaction concept, we intentionally used an artificial workflow and non-expert users in our study. Thus, our results show the possible potential of using spatially-aware devices for interacting with a 3D data visualization in AR, but given the large amount of design parameters, further studies are necessary to investigate the advantages compared to other systems.
Many of the uncovered issues stem from the early state of our prototype: Most participants worried about dropping the tablet, which may be partially attributed to the heavy weight introduced by the spatial trackers. Since our results show that the spatial awareness was not used as much as we expected, we can now investigate more limited, yet lightweight solutions (e.g. internal sensors). Alternatively, we may compare our tablet-based approach against a smartphone-based approach to see if the handiness of the smartphone can offset the extra screen space of the tablet.
We also intentionally reduced the duration of our study to accommodate our users as the HMD can be very uncomfortable over longer periods. Since all of our participants needed some time to get accustomed to our system, this left little time to actually test out the system after getting used to its features. Given that future hardware iterations (e.g. Microsoft HoloLens 2) are more comfortable to wear, future studies should account for this habituation period by offering more extensive interactive tutorials.
8 CONCLUSION
We present the STREAM prototype, which combines spatially-aware tablets with head-mounted augmented reality for multimodal interaction with 3D visualizations. STREAM is a proof of concept that employs an established 3D visualization, allowing us to study the role of spatially-aware tablets in immersive analytics. We developed a novel eyes-free interaction technique for the seamless interaction between the tablet and the AR environment, which leverages the tablet's form factor to place prominent actions into each corner that can be operated thanks to an AR head-up display. In addition, our interaction concepts allow users to bridge the gap between tablet and AR environment, enabling fluid interaction between the 2D and 3D representation of our visualization. While we demonstrated our interaction design in the context of immersive analytics, our design (e.g. seamless interaction between AR and tablet, eyes-free interaction menu) can also be transferred to a more general use case.
Furthermore, we reflect on our implementation to contribute design insights to foster the application of spatially-aware touch devices in AR and research implications indicating areas that need further investigation. These insights and implications stem from both our experience of developing STREAM and observations from a user study, contributing towards a better understanding of the combination of mobile devices and head-mounted AR displays.
ACKNOWLEDGMENTS
This research was funded by the Deutsche Forschungsgemeinschaft (DFG, German Research Foundation) – Project-ID 251654672 – TRR 161 (Project C01) and SMARTACT (BMBF, Grant 01EL1820A).
REFERENCES
- Myroslav Bachynskyi, Gregorio Palmas, Antti Oulasvirta, Jürgen Steimle, and Tino Weinkauf. 2015. Performance and Ergonomics of Touch Surfaces: A Comparative Study Using Biomechanical Simulation. In Proceedings of the 33rd Annual ACM Conference on Human Factors in Computing Systems - CHI ’15. ACM Press, Seoul, Republic of Korea, 1817–1826. https://doi.org/10.1145/2702123.2702607
- Sriram Karthik Badam, Fereshteh Amini, Niklas Elmqvist, and Pourang Irani. 2016. Supporting Visual Exploration for Multiple Users in Large Display Environments, In 2016 IEEE Conference on Visual Analytics Science and Technology (VAST). 2016 IEEE Conference on Visual Analytics Science and Technology, VAST 2016 - Proceedings, 1–10. https://doi.org/10.1109/VAST.2016.7883506
- Huidong Bai, Lei Gao, and Mark Billinghurst. 2017. 6DoF Input for Hololens Using Vive Controller. In SIGGRAPH Asia 2017 Mobile Graphics & Interactive Applications on - SA ’17. ACM Press, Bangkok, Thailand, 1–1. https://doi.org/10.1145/3132787.3132814
- Till Ballendat, Nicolai Marquardt, and Saul Greenberg. 2010. Proxemic Interaction: Designing for a Proximity and Orientation-Aware Environment, In ACM International Conference on Interactive Tabletops and Surfaces - ITS '10. ACM International Conference on Interactive Tabletops and Surfaces - ITS ’10, 121. https://doi.org/10.1145/1936652.1936676
- Andrea Batch, Andrew Cunningham, Maxime Cordeil, Niklas Elmqvist, Tim Dwyer, Bruce H. Thomas, and Kim Marriott. 2019. There Is No Spoon: Evaluating Performance, Space Use, and Presence with Expert Domain Users in Immersive Analytics. IEEE Transactions on Visualization and Computer Graphics 26, 1 (jan 2019), 1–1. https://doi.org/10.31219/osf.io/wzqbu
- Jens Bauer and Achim Ebert. 2015. Virtual Buttons for Eyes-Free Interaction: A Study. In Human-Computer Interaction – INTERACT 2015, Julio Abascal, Simone Barbosa, Mirko Fetter, Tom Gross, Philippe Palanque, and Marco Winckler (Eds.). Vol. 9296. Springer International Publishing, Cham, 47–54. https://doi.org/10.1007/978-3-319-22701-6_4
- Jens Bauer, Achim Ebert, Oliver Kreylos, and Bernd Hamann. 2013. Marking Menus for Eyes-Free Interaction Using Smart Phones and Tablets. In Availability, Reliability, and Security in Information Systems and HCI, Alfredo Cuzzocrea, Christian Kittl, Dimitris E. Simos, Edgar Weippl, and Lida Xu (Eds.). Vol. 8127. Springer Berlin Heidelberg, Berlin, Heidelberg, 481–494. https://doi.org/10.1007/978-3-642-40511-2_35
- Michel Beaudouin-Lafon. 2000. Instrumental Interaction: An Interaction Model for Designing Post-WIMP User Interfaces. In Proceedings of the SIGCHI Conference on Human Factors in Computing Systems(CHI ’00). Association for Computing Machinery, New York, NY, USA, 446–453. https://doi.org/10.1145/332040.332473
- Hrvoje Benko and Steven Feiner. 2007. Balloon Selection: A Multi-Finger Technique for Accurate Low-Fatigue 3D Selection. In Proceedings of the IEEE Symposium on 3D User Interfaces (3DUI ’07). IEEE Computer Society, Washington, DC, USA, 79–86. https://doi.org/10.1109/3DUI.2007.340778
- Lonni Besançon, Mickael Sereno, Lingyun Yu, Mehdi Ammi, and Tobias Isenberg. 2019. Hybrid Touch/Tangible Spatial 3D Data Selection. Computer Graphics Forum 38, 3 (jun 2019), 553–567. https://doi.org/10.1111/cgf.13710
- Verena Biener, Daniel Schneider, Travis Gesslein, Alexander Otte, Bastian Kuth, Per Ola Kristensson, Eyal Ofek, Michel Pahud, and Jens Grubert. 2020. Breaking the Screen: Interaction Across Touchscreen Boundaries in Virtual Reality for Mobile Knowledge Workers. IEEE Transactions on Visualization and Computer Graphics 26, 12 (dec 2020), 3490–3502. https://doi.org/10.1109/tvcg.2020.3023567
- Sebastian Boring, Marko Jurmu, and Andreas Butz. 2009. Scroll, Tilt or Move It: Using Mobile Phones to Continuously Control Pointers on Large Public Displays. In Proceedings of the 21st Annual Conference of the Australian Computer-Human Interaction Special Interest Group: Design: Open 24/7(OZCHI ’09). Association for Computing Machinery, New York, NY, USA, 161–168. https://doi.org/10.1145/1738826.1738853
- Stephen Brewster, Joanna Lumsden, Marek Bell, Malcolm Hall, and Stuart Tasker. 2003. Multimodal ’eyes-Free’ Interaction Techniques for Wearable Devices. In Proceedings of the SIGCHI Conference on Human Factors in Computing Systems(CHI ’03). Association for Computing Machinery, New York, NY, USA, 473–480. https://doi.org/10.1145/642611.642694
- Gerd Bruder, Frank Steinicke, and Wolfgang Stürzlinger. 2013. Effects of Visual Conflicts on 3D Selection Task Performance in Stereoscopic Display Environments. In 2013 IEEE Symposium on 3D User Interfaces (3DUI). IEEE, 115–118. https://doi.org/10.1109/3dui.2013.6550207
- Wolfgang Büschel, Annett Mitschick, Thomas Meyer, and Raimund Dachselt. 2019. Investigating Smartphone-Based Pan and Zoom in 3D Data Spaces in Augmented Reality. In Proceedings of the 21st International Conference on Human-Computer Interaction with Mobile Devices and Services - MobileHCI ’19. ACM Press, Taipei, Taiwan, 1–13. https://doi.org/10.1145/3338286.3340113
- Wolfgang Büschel, Patrick Reipschläger, Ricardo Langner, and Raimund Dachselt. 2017. Investigating the Use of Spatial Interaction for 3D Data Visualization on Mobile Devices. In Proceedings of the 2017 ACM International Conference on Interactive Surfaces and Spaces(ISS ’17). Association for Computing Machinery, Brighton, United Kingdom, 62–71. https://doi.org/10.1145/3132272.3134125
- Peter W. S. Butcher, Nigel W. John, and Panagiotis D. Ritsos. 2019. VRIA - A Framework for Immersive Analytics on the Web. In Extended Abstracts of the 2019 CHI Conference on Human Factors in Computing Systems(CHI EA ’19). Association for Computing Machinery, Glasgow, Scotland Uk, 1–6. https://doi.org/10.1145/3290607.3312798
- Simon Butscher, Sebastian Hubenschmid, Jens Müller, Johannes Fuchs, and Harald Reiterer. 2018. Clusters, Trends, and Outliers: How Immersive Technologies Can Facilitate the Collaborative Analysis of Multidimensional Data. In Proceedings of the 2018 CHI Conference on Human Factors in Computing Systems - CHI ’18. ACM Press, New York, New York, USA, 1–12. https://doi.org/10.1145/3173574.3173664
- Marco Cavallo, Mishal Dolakia, Matous Havlena, Kenneth Ocheltree, and Mark Podlaseck. 2019. Immersive Insights: A Hybrid Analytics System for Collaborative Exploratory Data Analysis. In 25th ACM Symposium on Virtual Reality Software and Technology on - VRST ’19. ACM Press, Parramatta, NSW, Australia, 1–12. https://doi.org/10.1145/3359996.3364242
- Li-Wei Chan, Hui-Shan Kao, Mike Y. Chen, Ming-Sui Lee, Jane Hsu, and Yi-Ping Hung. 2010. Touching the Void: Direct-Touch Interaction for Intangible Displays, In Proceedings of the 28th international conference on Human factors in computing systems - CHI '10. Proceedings of the SIGCHI Conference on Human Factors in Computing Systems (CHI), 2625–2634. https://doi.org/10.1145/1753326.1753725
- Maxime Cordeil, Andrew Cunningham, Benjamin Bach, Christophe Hurter, Bruce H. Thomas, Kim Marriott, and Tim Dwyer. 2019. IATK: An Immersive Analytics Toolkit. In 2019 IEEE Conference on Virtual Reality and 3D User Interfaces (VR). IEEE, Osaka, Japan, 200–209. https://doi.org/10.1109/VR.2019.8797978
- Maxime Cordeil, Andrew Cunningham, Tim Dwyer, Bruce H. Thomas, and Kim Marriott. 2017. ImAxes: Immersive Axes as Embodied Affordances for Interactive Multivariate Data Visualisation. In Proceedings of the ACM Symposium on User Interface and Software Technology (UIST ’17). ACM Press, New York, NY, USA, 71–83. https://doi.org/10.1145/3126594.3126613
- Tobias Drey, Jan Gugenheimer, Julian Karlbauer, Maximilian Milo, and Enrico Rukzio. 2020. VRSketchIn: Exploring the Design Space of Pen and Tablet Interaction for 3D Sketching in Virtual Reality. In Proceedings of the 2020 CHI Conference on Human Factors in Computing Systems(CHI ’20). Association for Computing Machinery, Honolulu, HI, USA, 1–14. https://doi.org/10.1145/3313831.3376628
- Niklas Elmqvist, Andrew Vande Moere, Hans-Christian Jetter, Daniel Cernea, Harald Reiterer, and T J Jankun-Kelly. 2011. Fluid Interaction for Information Visualization. Information Visualization - Special Issue on State of the Field and New Research Directions 10, 4 (2011), 327–340. https://doi.org/10.1177/1473871611413180
- Steven Feiner and Ari Shamash. 1991. Hybrid User Interfaces: Breeding Virtually Bigger Interfaces for Physically Smaller Computers. In Proceedings of the 4th Annual ACM Symposium on User Interface Software and Technology(UIST ’91). Association for Computing Machinery, Hilton Head, South Carolina, USA, 9–17. https://doi.org/10.1145/120782.120783
- Jens Grubert, Matthias Heinisch, Aaron Quigley, and Dieter Schmalstieg. 2015. MultiFi: Multi Fidelity Interaction with Displays On and Around the Body. In Proceedings of the 33rd Annual ACM Conference on Human Factors in Computing Systems(CHI ’15). Association for Computing Machinery, Seoul, Republic of Korea, 3933–3942. https://doi.org/10.1145/2702123.2702331
- Jens Grubert, Matthias Kranz, and Aaron Quigley. 2016. Challenges in Mobile Multi-Device Ecosystems. mUX: The Journal of Mobile User Experience 5, 1 (aug 2016). https://doi.org/10.1186/s13678-016-0007-y
- Mark Hancock, Otmar Hilliges, Christopher Collins, Dominikus Baur, and Sheelagh Carpendale. 2009. Exploring Tangible and Direct Touch Interfaces for Manipulating 2D and 3D Information on a Digital Table. In Proceedings of the ACM International Conference on Interactive Tabletops and Surfaces - ITS ’09. ACM Press, Banff, Alberta, Canada, 77. https://doi.org/10.1145/1731903.1731921
- Chris Harrison, Shilpa Ramamurthy, and Scott E. Hudson. 2012. On-Body Interaction: Armed and Dangerous. In Proceedings of the Sixth International Conference on Tangible, Embedded and Embodied Interaction(TEI ’12). Association for Computing Machinery, New York, NY, USA, 69–76. https://doi.org/10.1145/2148131.2148148
- Tom Horak, Sriram Karthik Badam, Niklas Elmqvist, and Raimund Dachselt. 2018. When David Meets Goliath: Combining Smartwatches with a Large Vertical Display for Visual Data Exploration. In Proceedings of the 2018 CHI Conference on Human Factors in Computing Systems - CHI ’18. ACM Press, New York, New York, USA, 1–13. https://doi.org/10.1145/3173574.3173593
- Christophe Hurter, Nathalie Henry Riche, Steven M. Drucker, Maxime Cordeil, Richard Alligier, and Romain Vuillemot. 2019. FiberClay: Sculpting Three Dimensional Trajectories to Reveal Structural Insights. IEEE Transactions on Visualization and Computer Graphics 25, 1 (Jan. 2019), 704–714. https://doi.org/10.1109/TVCG.2018.2865191
- Robert J. K. Jacob. 1990. What You Look at Is What You Get: Eye Movement-Based Interaction Techniques. In Proceedings of the SIGCHI Conference on Human Factors in Computing Systems Empowering People - CHI ’90, Vol. 23. ACM Press, New York, New York, USA, 11–18. https://doi.org/10.1145/97243.97246
- Daniel A. Keim. Jan.-March/2002. Information Visualization and Visual Data Mining. IEEE Transactions on Visualization and Computer Graphics 8, 1(Jan.-March/2002), 1–8. https://doi.org/10.1109/2945.981847
- Matthias Kraus, Katrin Angerbauer, Juri Buchmüller, Daniel Schweitzer, Daniel A. Keim, Michael Sedlmair, and Johannes Fuchs. 2020. Assessing 2D and 3D Heatmaps for Comparative Analysis: An Empirical Study. In Proceedings of the 2020 CHI Conference on Human Factors in Computing Systems(CHI ’20). Association for Computing Machinery, Honolulu, HI, USA, 1–14. https://doi.org/10.1145/3313831.3376675
- M. Kraus, N. Weiler, D. Oelke, J. Kehrer, D. A. Keim, and J. Fuchs. 2019. The Impact of Immersion on Cluster Identification Tasks. IEEE Transactions on Visualization and Computer Graphics 26, 1 (jan 2019), 1–1. https://doi.org/10.1109/TVCG.2019.2934395
- Ricardo Langner, Tom Horak, and Raimund Dachselt. 2018. VisTiles: Coordinating and Combining Co-Located Mobile Devices for Visual Data Exploration. IEEE Transactions on Visualization and Computer Graphics 24, 1 (jan 2018), 626–636. https://doi.org/10.1109/TVCG.2017.2744019
- Joseph J. LaViola, Ernst Kruijff, Ryan P. McMahan, Doug A. Bowman, and Ivan Poupyrev. 2017. 3D User Interfaces: Theory and Practice (second edition ed.). Addison-Wesley, Boston.
- Huy Viet Le, Sven Mayer, and Niels Henze. 2018. InfiniTouch: Finger-Aware Interaction on Fully Touch Sensitive Smartphones. In Proceedings of the 31st Annual ACM Symposium on User Interface Software and Technology(UIST ’18). Association for Computing Machinery, New York, NY, USA, 779–792. https://doi.org/10.1145/3242587.3242605
- Bongshin Lee, Eun Kyoung Choe, Petra Isenberg, Kim Marriott, and John Stasko. 2020. Reaching Broader Audiences With Data Visualization. IEEE Computer Graphics and Applications 40, 2 (March 2020), 82–90. https://doi.org/10.1109/MCG.2020.2968244
- Benjamin Lee, Xiaoyun Hu, Maxime Cordeil, Arnaud Prouzeau, Bernhard Jenny, and Tim Dwyer. 2020. Shared Surfaces and Spaces: Collaborative Data Visualisation in a Co-Located Immersive Environment. IEEE Transactions on Visualization and Computer Graphics (Aug. 2020), 1–1. https://doi.org/10.1109/tvcg.2020.3030450
- Bongshin Lee, Arjun Srinivasan, John Stasko, Melanie Tory, and Vidya Setlur. 2018. Multimodal Interaction for Data Visualization. In Proceedings of the 2018 International Conference on Advanced Visual Interfaces - AVI ’18(Proceedings of the 2018 International Conference on Advanced Visual Interfaces - AVI ’18). ACM, 1–3. https://doi.org/10.1145/3206505.3206602
- Chi-Jung Lee and Hung-Kuo Chu. 2018. Dual-MR: Interaction with Mixed Reality Using Smartphones. In Proceedings of the 24th ACM Symposium on Virtual Reality Software and Technology(VRST ’18). Association for Computing Machinery, Tokyo, Japan, 1–2. https://doi.org/10.1145/3281505.3281618
- Yiqin Lu, Chun Yu, Xin Yi, Yuanchun Shi, and Shengdong Zhao. 2017. BlindType: Eyes-Free Text Entry on Handheld Touchpad by Leveraging Thumb's Muscle Memory. Proceedings of the ACM on Interactive, Mobile, Wearable and Ubiquitous Technologies 1, 2 (June 2017), 1–24. https://doi.org/10.1145/3090083
- Kim Marriott, Falk Schreiber, Tim Dwyer, Karsten Klein, Nathalie Henry Riche, Takayuki Itoh, Wolfgang Stuerzlinger, and Bruce H. Thomas (Eds.). 2018. Immersive Analytics. Number 11190 in Lecture Notes in Computer Science. Springer, Cham.
- Tamara Munzner. 2014. Visualization Analysis and Design. A K Peters/CRC Press, Boca Raton, FL. https://doi.org/10.1201/b17511
- Ian Oakley and Junseok Park. 2009. Motion Marking Menus: An Eyes-Free Approach to Motion Input for Handheld Devices. International Journal of Human-Computer Studies 67, 6 (June 2009), 515–532. https://doi.org/10.1016/j.ijhcs.2009.02.002
- Sharon Oviatt. 1999. Ten Myths of Multimodal Interaction. Commun. ACM 42, 11 (nov 1999), 74–81. https://doi.org/10.1145/319382.319398
- Sharon Oviatt and Philip Cohen. 2000. Perceptual User Interfaces: Multimodal Interfaces That Process What Comes Naturally. Commun. ACM 43, 3 (March 2000), 45–53. https://doi.org/10.1145/330534.330538
- Sharon Oviatt, Rebecca Lunsford, and Rachel Coulston. 2005. Individual Differences in Multimodal Integration Patterns: What Are They and Why Do They Exist?. In Proceedings of the SIGCHI Conference on Human Factors in Computing Systems - CHI ’05(Proceedings of the SIGCHI Conference on Human Factors in Computing Systems - CHI ’05). ACM Press, 241–249. Issue April. https://doi.org/10.1145/1054972.1055006
- Simon T. Perrault, Eric Lecolinet, James Eagan, and Yves Guiard. 2013. Watchit: Simple Gestures and Eyes-Free Interaction for Wristwatches and Bracelets. In Proceedings of the SIGCHI Conference on Human Factors in Computing Systems(CHI ’13). Association for Computing Machinery, New York, NY, USA, 1451–1460. https://doi.org/10.1145/2470654.2466192
- Arnaud Prouzeau, Antoine Lhuillier, Barrett Ens, Daniel Weiskopf, and Tim Dwyer. 2019. Visual Link Routing in Immersive Visualisations. In Proceedings of the 2019 ACM International Conference on Interactive Surfaces and Spaces(ISS ’19). Association for Computing Machinery, New York, NY, USA, 241–253. https://doi.org/10.1145/3343055.3359709
- Patrick Reipschläger and Raimund Dachselt. 2019. DesignAR: Immersive 3D-Modeling Combining Augmented Reality with Interactive Displays. In Proceedings of the 2019 ACM International Conference on Interactive Surfaces and Spaces - ISS ’19. ACM Press, Daejeon, Republic of Korea, 29–41. https://doi.org/10.1145/3343055.3359718
- Patrick Reipschläger, Tamara Flemisch, and Raimund Dachselt. 2020. Personal Augmented Reality for Information Visualization on Large Interactive Displays. IEEE Transactions on Visualization and Computer Graphics (Feb. 2020), 1–1. https://doi.org/10.1109/tvcg.2020.3030460
- Ayshwarya Saktheeswaran, Arjun Srinivasan, and John Stasko. 2020. Touch? Speech? Or Touch and Speech? Investigating Multimodal Interaction for Visual Network Exploration and Analysis. IEEE Transactions on Visualization and Computer Graphics 26, 6 (jun 2020), 1–1. https://doi.org/10.1109/TVCG.2020.2970512
- Martin Schrepp, Andreas Hinderks, and Jörg Thomaschewski. 2017. Construction of a Benchmark for the User Experience Questionnaire (UEQ). International Journal of Interactive Multimedia and Artificial Intelligence 4, 4 (2017), 40. https://doi.org/10.9781/ijimai.2017.445
- Ronell Sicat, Jiabao Li, Junyoung Choi, Maxime Cordeil, Won-Ki Jeong, Benjamin Bach, and Hanspeter Pfister. 2019. DXR: A Toolkit for Building Immersive Data Visualizations. IEEE Transactions on Visualization and Computer Graphics 25, 1 (Jan. 2019), 715–725. https://doi.org/10.1109/TVCG.2018.2865152
- Maurício Sousa, Daniel Mendes, Soraia Paulo, Nuno Matela, Joaquim Jorge, and Daniel Simões Lopes. 2017. VRRRRoom: Virtual Reality for Radiologists in the Reading Room. In Proceedings of the SIGCHI Conference on Human Factors in Computing Systems (CHI ’17). ACM Press, New York, NY, USA, 4057–4062. https://doi.org/10.1145/3025453.3025566
- Arjun Srinivasan, Bongshin Lee, Nathalie Henry Riche, Steven M. Drucker, and Ken Hinckley. 2020. InChorus: Designing Consistent Multimodal Interactions for Data Visualization on Tablet Devices. In Proceedings of the 2020 CHI Conference on Human Factors in Computing Systems(CHI ’20). Association for Computing Machinery, Honolulu, HI, USA, 1–13. https://doi.org/10.1145/3313831.3376782
- Arjun Srinivasan and John Stasko. 2018. Orko: Facilitating Multimodal Interaction for Visual Exploration and Analysis of Networks. IEEE Transactions on Visualization and Computer Graphics 24, 1 (jan 2018), 1–1. https://doi.org/10.1109/TVCG.2017.2745219
- Seung Youb Ssin, James A. Walsh, Ross T. Smith, Andrew Cunningham, and Bruce H. Thomas. 2019. GeoGate: Correlating Geo-Temporal Datasets Using an Augmented Reality Space-Time Cube and Tangible Interactions. In 2019 IEEE Conference on Virtual Reality and 3D User Interfaces (VR). IEEE, Osaka, Japan, 210–219. https://doi.org/10.1109/VR.2019.8797812
- Hemant Bhaskar Surale, Aakar Gupta, Mark Hancock, and Daniel Vogel. 2019. TabletInVR: Exploring the Design Space for Using a Multi-Touch Tablet in Virtual Reality. In Proceedings of the 2019 CHI Conference on Human Factors in Computing Systems - CHI ’19. ACM Press, Glasgow, Scotland Uk, 1–13. https://doi.org/10.1145/3290605.3300243
- Zsolt Szalavári and Michael Gervautz. 2008. The Personal Interaction Panel - a Two-Handed Interface for Augmented Reality. Computer Graphics Forum 16 (June 2008), C335–C346. https://doi.org/10.1111/1467-8659.16.3conferenceissue.35
- Slawomir Konrad Tadeja, Timoleon Kipouros, and Per Ola Kristensson. 2019. Exploring Parallel Coordinates Plots in Virtual Reality. In Extended Abstracts of the 2019 CHI Conference on Human Factors in Computing Systems - CHI EA ’19. ACM Press, Glasgow, Scotland Uk, 1–6. https://doi.org/10.1145/3290607.3313068
- Philipp Wacker, Oliver Nowak, Simon Voelker, and Jan Borchers. 2019. ARPen: Mid-Air Object Manipulation Techniques for a Bimanual AR System with Pen & Smartphone. In Proceedings of the 2019 CHI Conference on Human Factors in Computing Systems(CHI ’19). Association for Computing Machinery, Glasgow, Scotland Uk, 1–12. https://doi.org/10.1145/3290605.3300849
- Matt Whitlock, Stephen Smart, and Danielle Albers Szafir. 2020. Graphical Perception for Immersive Analytics. In 2020 IEEE Conference on Virtual Reality and 3D User Interfaces (VR). IEEE, Atlanta, GA, USA, 616–625. https://doi.org/10.1109/VR46266.2020.00084
- Pui Chung Wong, Kening Zhu, Xing-Dong Yang, and Hongbo Fu. 2020. Exploring Eyes-Free Bezel-Initiated Swipe on Round Smartwatches. In Proceedings of the 2020 CHI Conference on Human Factors in Computing Systems(CHI ’20). Association for Computing Machinery, Honolulu, HI, USA, 1–11. https://doi.org/10.1145/3313831.3376393
- Yalong Yang, Tim Dwyer, Bernhard Jenny, Kim Marriott, Maxime Cordeil, and Haohui Chen. 2018. Origin-Destination Flow Maps in Immersive Environments. IEEE Transactions on Visualization and Computer Graphics 25, 1 (jan 2018), 1–1. https://doi.org/10.1109/TVCG.2018.2865192
- Bo Yi, Xiang Cao, Morten Fjeld, and Shengdong Zhao. 2012. Exploring User Motivations for Eyes-Free Interaction on Mobile Devices. In Proceedings of the 2012 ACM Annual Conference on Human Factors in Computing Systems - CHI ’12. ACM Press, Austin, Texas, USA, 2789. https://doi.org/10.1145/2207676.2208678
- Fengyuan Zhu and Tovi Grossman. 2020. BISHARE: Exploring Bidirectional Interactions Between Smartphones and Head-Mounted Augmented Reality. In Proceedings of the 2020 CHI Conference on Human Factors in Computing Systems(CHI ’20). Association for Computing Machinery, Honolulu, HI, USA, 1–14. https://doi.org/10.1145/3313831.3376233
FOOTNOTE
1Please also refer to our supplemental video.
2 https://github.com/hcigroupkonstanz/STREAM
3Due to infrared interference between the HoloLens 1 and the Valve Lighthouses 1.0 causing tracking issues, we used the Valve Lighthouse 2.0.
4 https://exoplanetarchive.ipac.caltech.edu/ (last accessed 2021-01-12)

This work is licensed under a Creative Commons Attribution International 4.0 License.
CHI '21, May 08–13, 2021, Yokohama, Japan
© 2021 Copyright held by the owner/author(s).
ACM ISBN 978-1-4503-8096-6/21/05.
DOI: https://doi.org/10.1145/3411764.3445298