


ABSTRACT
We report the detection in IRC+10216 of lines of HNC J = 3 − 2 pertaining to nine excited vibrational states with energies up to ∼5300 K. The spectrum, observed with ALMA, also shows a surprising large number of narrow, unidentified lines that arise in the vicinity of the star. The HNC data are interpreted through a 1D-spherical non-local radiative transfer model, coupled to a chemical model that includes chemistry at thermochemical equilibrium for the innermost regions and reaction kinetics for the external envelope. Although unresolved by the current early ALMA data, the radius inferred for the emitting region is ∼0 06 (i.e., ≃ 3 stellar radii), similar to the size of the dusty clumps reported by IR studies of the innermost region (r < 03). The derived abundance of HNC relative to H2 is 10−8 < χ(HNC) <10−6, and drops quickly where the gas density decreases and the gas chemistry is dominated by reaction kinetics. Merging HNC data with that of molecular species present throughout the inner envelope, such as vibrationally excited HCN, SiS, CS, or SiO, should allow us to characterize the physical and chemical conditions in the dust formation zone.
Export citation and abstract BibTeX RIS
1. INTRODUCTION
Whereas small molecular species form under a wide range of physical conditions, the nucleation and growth of dust grains require high gas densities. In space, the main places for grain nucleation are the photospheres of asymptotic giant branch (AGB) stars, the ejecta of supernovae, and Wolf–Rayet stars (Williams et al. 1987; Gail 2010; Dwek & Cherchneff 2011). The dust grains that form are expelled into the interstellar medium, where they are processed by UV photons, energetic particles, and shocks. Protoplanetary disks, which also harbor high density regions, have temperatures too low for efficient nucleation, but are favorable sites for coagulation processes that allow previously formed dust grain seeds to grow from submicron diameters to millimeter and centimeter size particles (Blum & Gerhard 2008) and, in proper conditions, to micro-planetesimals and planets.
Both astronomical observations and physical and chemical modeling are needed to understand complex processes such as nucleation, dust processing, and the interaction of dust with gas-phase molecules and atoms. The regions of grain nucleation are however restricted to a few stellar radii; heavily obscured, they are not observable at optical wavelengths. Early mid-infrared (IR) observations have permitted the derivation of the physical properties of the circumstellar envelope (CSE) of IRC+10216 (Keady et al. 1988; Keady & Ridgway 1993; Ridgway & Keady 1988; Monnier et al. 2000). However, the closest AGB stars being more than one hundred parsecs away, mid and far IR, and submillimeter (sub-mm) observations have been limited so far by angular resolution. This is now changing with ALMA, which will be able to reach at sub-mm wavelengths resolutions comparable to stellar diameters. Although ALMA's present resolution and sensitivity are far from their nominal values, they outgrow those of any other sub-mm instrument. We present here the first sub-mm ALMA observations of an inner AGB star envelope, IRC+10216, and demonstrate their potential in revealing the dust formation zone.
Among the many molecular lines detected in the 20 GHz-wide spectrum, the lines of HNC, are fairly strong and can be traced from the immediate star surroundings to the outer CSE and have for our purpose a special interest. High-J rotational lines of its ground vibrational level have recently been observed in IRC+10216 from Herschel/HIFI observations. These low resolution data (HPBW = 30'') allowed us to model the HNC abundance distribution down to a few tens of stellar radii from the star (Daniel et al. 2012). The new HNC lines analyzed in this Letter not only were observed with a 50 times higher angular resolution, but pertain to excited vibrational states with energies of several thousands of kelvins, and probe a few stellar radii around the star.
2. OBSERVATIONS
The observations of IRC+10216 with ALMA were made between 2012 April 8 and 23 (ALMA Cycle0). They consisted in four spectral setups covering the frequency range 255.3–274.8 GHz (receiver band 6) with a 0.5 MHz channel spacing.8 Observations were obtained in two runs in a single spectral setup (referenced as id4 in the ALMA archive), which covered the range 269.8–274.0GHz. The array was configured with 16 antennas extending up to 402 m. Two runs of about 72 minutes each were performed, of which 26 minutes correspond to correlations on source. 3C279 and 3C273 were observed to calibrate bandpass and absolute flux, J0854+201 and J0909+013 every 10 and 20 minutes respectively to calibrate phase and amplitude gains. 3C279 was bright enough to allow an optimal radio frequency calibration. A flux of 4.26 Jy was adopted as reference for J0854+201 at 272.4 GHz (consistent with Submillimeter Array and Plateau de Bure Interferometer monitoring of this source). We estimate an uncertainty for the flux calibration of ∼8%, which is obtained from the reference flux uncertainty and the resulting differences in source continuum for the different observing runs. In addition, this standard calibration was subsequently improved by iterative self-calibration on the highly compact, bright source at the origin of vibrationally excited SiS emission (SiS ν = 1 J = 15 − 14 at 270.917 GHz). Imaging restoration was made with moderate robust weighting (with a 0.5 robustness value) for all the available channels, with 0.49 MHz spacing and an effective resolution of 0.98 MHz. The final synthetic beam is 06 × 05 and the rms per channel is ∼5 mJy Beam−1. That of the continuum map is 2 mJy Beam−1 with the continuum emission peak at α =  and δ = 13°16'4386 (J2000). Calibration was performed with the CASA software package, and data analysis with GILDAS. We finally note that in the originally delivered raw data (in ASDM format) the frequency plane was wrong by 2.89 MHz for the spectral window 1. When the error was identified, it could be simply corrected in the ms-format data files. We expect this error to be corrected in the ALMA archive data.
3. LINE MODELING AND DISCUSSION
Figure 1 shows for three selected frequency ranges the ALMA spectrum superimposed on the spectrum observed with the IRAM 30-m single-dish telescope (Cernicharo et al. 2011). The line identification was made with the MADEX code (Cernicharo 2012). The spectra show rotational lines of HCN, HNC, SiS (up to ν = 10), SiO, CS, SiC2, and metal-bearing species, together with their rare isotopologues, in the ground and excited vibrational states. Many pure ℓ-doubling lines (ΔJ = 0) of HCN in several vibrational levels are detected (see Figure 1; see also Patel et al. 2011). In addition, the ALMA spectrum shows an impressively large number of unidentified lines. The line width of the observed features ranges from 2–3 km s−1 to 10–15 km s−1. Narrow lines are formed close to the star's photosphere before the acceleration region. The line width of the features increases when the emission arises from the acceleration region (Fonfría et al. 2008; Cernicharo et al. 2011; Patel et al. 2011). A significant number of unidentified lines agree in frequency with lines of vibrationally excited CH2CHCN, a molecule known to be present in the outer envelope of IRC+10216 (Agúndez et al. 2008). However, a conclusive assignment awaits for a wider frequency coverage to access all major CH2CHCN lines, as well as for a more detailed model of the innermost CSE chemistry (Agúndez & Cernicharo 2006; Agúndez et al. 2010). A narrow feature at 268148 MHz agrees in frequency with the 2ν2 65, 2–74, 3 line of water vapor. A final assignment of this high energy transition requires the detection of more features of vibrationally excited H2O; so far, only lines from the ground H2O vibrational state have been reported in IRC+10216 (Decin et al. 2010).

Figure 1. ALMA spectrum (black) of IRC+10216 in three selected frequency ranges of the 20 GHz bandwidth covered by our data. For each selected frequency the ALMA spectrum is compared to the data obtained with the 30-m IRAM telescope (red) at the same frequency (Cernicharo et al. 2011). Intensity scale is in units of Jy Beam−1. Spectral resolution is ∼1 MHz for both datasets. The bottom panel of each selected frequency shows a close-up view of the ALMA data. Interestingly, a forest of narrow and unidentified lines are evidenced thanks to the extreme sensitivity, and much higher angular resolution, of ALMA. Note the good calibration agreement for lines spatially unresolved by both instruments. Labels in red correspond to lines detected with the 30-m telescope and filtered by the interferometer.
Download figure:
Standard image High-resolution imageIn this work we focus on the emission of the HNC lines shown in Figure 2 and arising from different vibrational modes. Their frequencies and intrinsic strengths have been calculated with the MADEX code (Cernicharo 2012) from a fit of all laboratory data, including the ℓ-type doubling lines from ν2 levels (Okabayashi & Tanimoto 1993; Creswell et al. 1976; Thorwirth et al. 2000; Maki & Mellau 2001; Mellau 2010, 2011; Amano & Zelinger 2002, 2004).
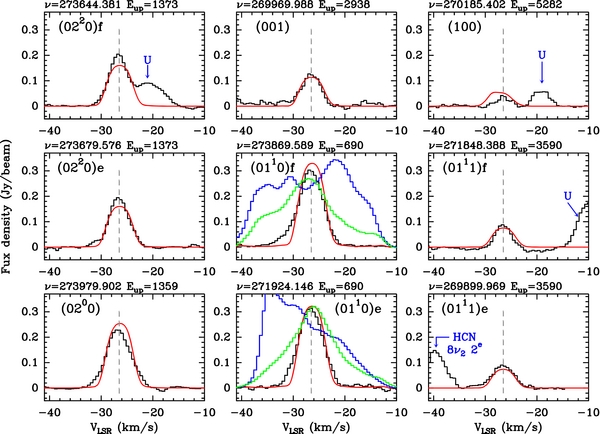
Figure 2. Observed (black curves) and modeled (red) line profile of the J = 3 − 2 in vibrationally excited states of HNC as observed with ALMA near ∼270 GHz. The blue and green curves show the corresponding ν2 lines of HCN (blue) and H13CN (green) observed in the same setup, scaled down by factors of 50 and 6 respectively. HNC frequencies (in MHz) and upper level energies (in kelvins) are given at the top of each box. The vertical line corresponds to the systemic velocity of IRC+10216.
Download figure:
Standard image High-resolution image3.1. Radiative Transfer and Chemical Modeling
The different gas phase processes leading to the formation of molecules throughout the CSE of IRC+10216 were reported by Agúndez & Cernicharo (2006). The chemistry of HNC in the outer CSE of IRC +10216 was extensively discussed by Daniel et al. (2012). We therefore focus here on the chemistry in the very innermost region, i.e., within a few stellar radii from the star where thermochemical equilibrium (TE) holds. We carried out TE calculations with the code described in Tejero & Cernicharo (1991), which is based on the formalism of Tsuji (1973). We adopted solar elemental abundances (Asplund et al. 2009), except for C, whose abundance was increased over O by a factor of 1.5. Our calculations include 21 elements and nearly 300 molecular species, whose thermochemical properties were mostly taken from various compilations (Chase 1998; Sauval & Tatum 1984; Irwin 1988). For HNC, the dissociation energy and partition function were taken from the more recent studies of Wenthold (2000) and Barber et al. (2002), respectively. The TE equations were solved for the region 1–10 R* of IRC+10216, adopting the temperature radial profile of Agúndez et al. (2012). A radial profile of H2 volume density somewhat lower than that of Agúndez et al. (2012) was adopted to adequately reproduce the HNC observed line profiles (see below).
Since HCN is one of the most abundant molecules in the atmosphere of carbon-rich AGB stars such as IRC+10216 (Fonfría et al. 2008; Cernicharo et al. 1996, 1999, 2011), HNC must also be fairly abundant near the photosphere. The calculated abundance of HNC is shown on Figures 3 and 4 (blue line). It is maximum at the stellar surface (2 × 10⁻⁶ relative to H2) and drops steeply with increasing radius. At TE, the HNC/HCN abundance ratio increases exponentially with temperature and depends only on that parameter. It reaches a value of ∼10% for a photospheric temperature of 2500 K (Cernicharo et al. 2011).
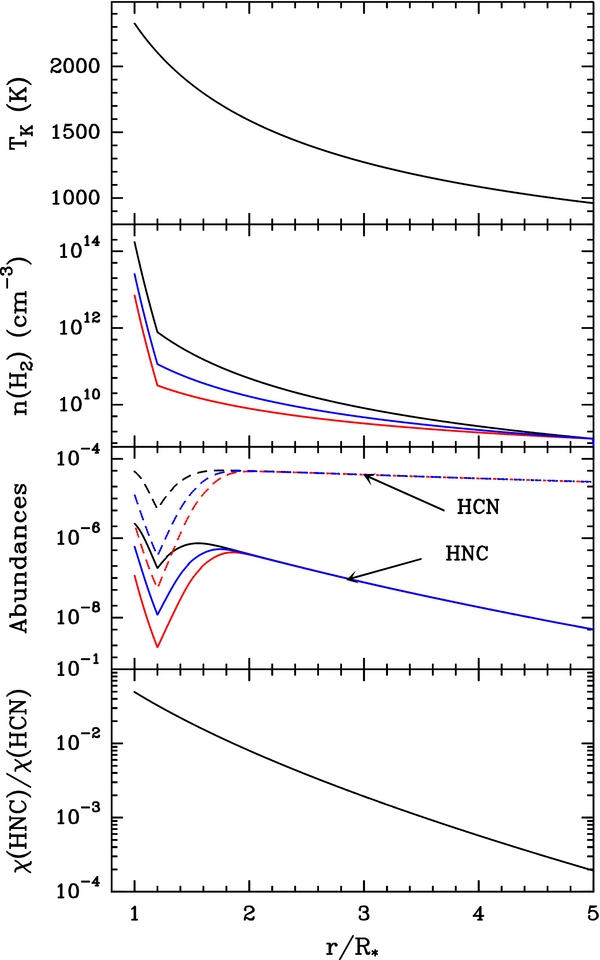
Figure 3. From top to bottom: gas temperature, H2 density, HCN & HNC fractional abundance, and the HNC/HCN abundance ratio adopted in our models. With the gas temperature fixed in the chemical modeling, the effect introduced by varying the H2 density on the HNC/HCN fractional abundances is emphasized by considering three different density radial profiles. The best results are obtained for the blue profile. The HNC/HCN abundance ratio does not depend on the adopted density profile.
Download figure:
Standard image High-resolution image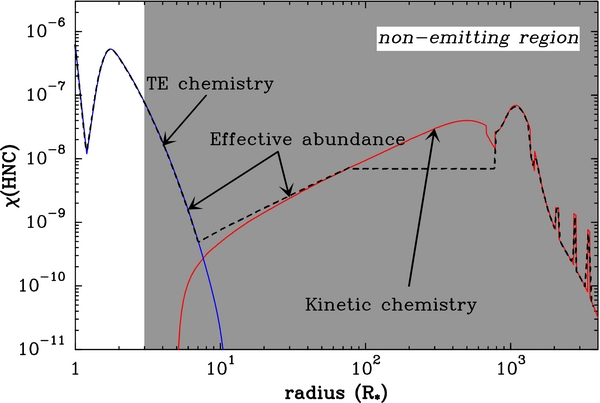
Figure 4. Radial profile of the HNC abundance, relative to H2, as predicted from the TE chemistry (blue curve) and from the kinetic chemistry (red curve). The effective abundance profile derived by Daniel et al. (2012) from at fit to all the sub-mm lines observed by Herschel is shown by the dashed black curve. The gray area corresponds to the region that does not contribute to vibrationally excited HNC emission.
Download figure:
Standard image High-resolution image
According to the above considerations, the fractional HNC abundance, χ(HNC), can be estimated in the TE regime if the gas temperature, HCN abundance, and volume density are known. Fonfría et al. (2008) and Cernicharo et al. (2011) have shown that TK and χ(HCN) are well constrained by the HCN observations in the mid-IR and sub-mm domains. This is not the case, however, for the H2 volume density (see Agúndez et al. 2012). On the assumption that in the innermost regions the temperature radial profile is well known and TE holds, the HNC line intensities observed by ALMA can be used to constrain the H2 volume density in these regions.
In order to constrain the abundance of HNC, we performed non-local radiative transfer (RT) calculations with the code described in Daniel & Cernicharo (2008). Test calculations showed that the predicted line intensities depend on the total number of vibrational levels included in the calculations. The dipole moments of the vibrational bands were taken from Maki & Mellau (2001). If not available, they were assumed identical to those of transitions with similar variations of the vibrational quantum numbers. For instance, the dipole moments of the (0310) → (0110) and (0200) → (000) bands, were assumed to be the same. The vibrational states which are included in the RT calculations are the (000), (010), (020), (030), (100), (001), (011), (021). In each vibrational state we consider the rotational levels up to J = 55 and include the ℓ-type doubling in the states with a bending mode. The number of energy levels considered is thus ∼950, which translates to a total of ∼8700 radiative transitions.
The collisional rate coefficients for the rotational transitions of HNC were derived from the calculations of Dumouchel et al. (2010). Those for the ro-vibrational and ℓ-type transitions are not listed in the literature. They were estimated by scaling down the rotational rate coefficients by a factor of 100, a value similar to that found for SiO at TK = 1500 K (Bieniek & Green 1983). Several runs were performed to check the effect of this assumption on the results. We found that, for the range of considered densities, the pumping of the molecular levels was not very sensitive to the assumed factor. Moreover, we tested that the pumping by IR photons is not important for these densities and for the considered vibrational levels.
We adopt a distance to IRC+10216 of 130 pc (Groenewegen et al. 2012) and a radius for the star of 4×1013 cm (Menten et al. 2012). The structure of the CSE, i.e., its gas/dust temperatures, dust opacity, and radial velocity profiles are taken from Fonfría et al. (2008), Agúndez et al. (2012) and Daniel et al. (2012) (see also Keady et al. 1988; Ridgway & Keady 1988; Keady & Ridgway 1993; Agúndez & Cernicharo 2006; Agúndez et al. 2010; Cernicharo et al. 2010; De Beck et al. 2012). While the HCN/HNC abundance ratio is expected to depend on temperature, the chemical modeling shows that χ(HNC) is largely influenced by the adopted H2 density for r ⩽ 2 R* (see Figure 3). Nevertheless, the observed HNC intensities are directly proportional to the column density of HNC. Hence, by using the HCN abundance profile derived by Fonfría et al. (2008), and adopting the TE HCN/HNC abundance ratio (see Figure 3), it is possible to constrain n(H2) from the observations and the models. The best fit to the data is obtained with the density profile shown by the blue curves in Figure 3. It corresponds to a downward revision of the density profile of Agúndez et al. (2012), and reproduces the observations reasonably well (see Figure 2).
Daniel et al. (2012) have already analyzed several HNC lines observed by Herschel and tried to constrain abundance profile of HNC over the entire envelope (see Figure 4). They found that gas-phase chemistry may reproduce this profile, except for the 70 R* < r < 700 R* region, where the gas-phase predicted abundances are significantly lower than observed (see Figure 2), a discrepancy that was explained by the large uncertainty on the HCNH+ + NH3 branching ratio.
In the current modeling, we kept for radii ⩾10 R* the "effective" abundance profile derived from the analysis of the Herschel observations by Daniel et al. (2012), but adopted for smaller radii the abundances predicted by TE since the signal from this region is highly diluted in the Herschel beam and cannot be modeled properly. Thus, the effective HNC abundance profile used in this study to fit all the HNC lines (Herschel, 30-m telescope and ALMA) follows the black dashed curve on Figure 4 down to ∼10 R* and the blue curve closer to the star. With such a profile, the RT calculations show that the vibrationally excited HNC lines observed by ALMA are only sensitive to the hot 1 R* < r < 3 R* region, where the HNC abundance is expected to be at TE. And indeed, Figure 2 illustrates that the TE abundances correctly predict the observed line profiles—except for a weak blue wing visible on the two ℓ-type doubling components of the lowest excited vibrational state (0,1,0). The latter must correspond to expanding gas in front of the star, as it disappears in all the higher energy lines. Figure 2 also shows the two J = 3 − 2 ν2 ℓ-doubling lines of HCN and H13CN for comparison. Those lines, especially those of the abundant isotopologue, are much broader and extend over the full velocity range of the envelope, i.e., trace the entire gas acceleration region, 1 R* < r < 20 R* (Fonfría et al. 2008; Cernicharo et al. 2011). In contrast, vibrationally excited HNC lines only trace the innermost region (r < 3 R*).
3.2. Discussion
The structure of the innermost region of IRC+10216 has been studied through interferometric observations of the dust near-IR emission (see, e.g., Men'shchikov et al. 2001; Leão et al. 2006), but is still a matter of debate. While the CSE seems to have a roughly spherical shape at large scales, the region r < 03 (R* = 0.02 arcsec) is dominated by a few bright clumps (Haniff & Buscher 1998) with diameters of typically ∼01, whose position and luminosity change on time-scales of a few years (see, e.g., Figure 2 of Leão et al. 2006). Although these clumps are not resolved in our ALMA data, their size of ∼012 in diameter is close to that of the HNC emitting region. The position of the star is not firmly established at this scale. Indeed, its location is chosen either to coincide with the brightest clump (Tuthill et al. 2005), or to lie in the middle of the clumps. It may be also possible that the star is hidden at the wavelengths at which the clumps were observed (Men'shchikov et al. 2001, 2002). The clumps have projected velocities ranging from ∼8 km s−1 to 18 km s−1 (Tuthill et al. 2000). Hence, it should be possible, in principle, to locate the star position by constraining the kinematics of the various clumps. However, in practice, this turns out to be a difficult task because of the proper motion of the star (Menten et al. 2012). The possibility that IRC+10216 hosts in fact a binary star (Guélin et al. 1993) has also to be addressed with more sensitive dust and molecular emission observations.
With our current model, it has been possible to successfully reproduce the emission of all the vibrationally excited J = 3 − 2 HNC lines up to energy levels ≃ 5300 K. The derived structure (assumed spherically symmetrical) implies a hot and dense emitting region(n(H2) > 5 109 cm−3 and Tg > 1300 K, in our model) extending from 1 R* up to 3 R* (corresponding to a projected distance of ∼006 at 130 pc). In a more realistic non-spherically symmetric model, and taking into account episodic events of high mass loss, those lines would arise from the dense clumps and not from a less dense homogeneous interclump medium. We have shown that for densities much lower than 109 cm−3, the HNC chemistry is dominated by bimolecular chemical reactions causing its fractional abundance to drop below χ(HNC)<10−8, a value too low to explain the observed line strengths.
The strong variation of the abundance of HNC with distance to the star is illustrated on Figure 2 by the comparison between the HNC and the HCN and H13CN line profiles. The latter lines are 50 and six times stronger, respectively, at our angular resolution, and are seen to cover the entire gas acceleration region (Cernicharo et al. 2011). The emitting region is still unresolved with the current observations (≃06 synthesized beam) and an angular resolution better than ∼005, as well as 2D or 3D modeling would be required to fully characterize this region.
HNC and HCN are excellent molecular tracers as their chemistry is strongly correlated in AGB stars. Coupling chemistry and RT modeling will be a powerful tool to study the innermost regions of CSEs. Higher angular resolution observations of HNC and HCN, that will become possible with ALMA in the coming years, and their analysis in conjunction with other dense refractory gas tracers, such as SiO, CS, SiC2, SiS, and metal-bearing species, will permit further study of the morphology and physics of the dust formation/gas acceleration zone and, mostly, allow us to follow on a time-scale of years the time-dependant chemistry in the moving gas clumps. This will open the possibility of studying the elemental processes that lead to the nucleation and growth of refractory dust grains
We would like to thank Spanish MINECO for funding support under grants CSD2009- 00038, AYA2006-14876, AYA2009-07304, AYA2012-32032, the CNRS/PCMI program, and the RTRA STAE (3PC project).
Footnotes
- 8
This Letter makes use of the following ALMA data: ADS/JAO.ALMA#2011.0.00229.S. ALMA is a partnership of ESO (representing its member states), NSF (USA) and NINS (Japan), together with NRC (Canada) and NSC and ASIAA (Taiwan), in cooperation with the Republic of Chile. The Joint ALMA Observatory is operated by ESO, AUI/NRAO and NAOJ.