Location via proxy:   [ UP ]  
[Report a bug]   [Manage cookies]                
  • Featured in Physics
  • Open Access

Storage and Release of Subradiant Excitations in a Dense Atomic Cloud

Giovanni Ferioli, Antoine Glicenstein, Loic Henriet, Igor Ferrier-Barbut, and Antoine Browaeys
Phys. Rev. X 11, 021031 – Published 10 May 2021
Physics logo See Viewpoint: Finding Light in Dark Atomic Clouds

Abstract

We report the observation of subradiance in dense ensembles of cold Rb87 atoms operating near Dicke’s regime of a large number of atoms in a volume with dimensions smaller than the transition wavelength. We validate that the atom number is the only cooperativity parameter governing subradiance. We probe the dynamics in the many-body regime and support the picture that multiply excited subradiant states are built as a superposition of singly excited states that decay independently. Moreover, we implement an experimental procedure to release the excitation stored in the long-lived modes in a pulse of light. This technique is a first step towards the realization of tailored light storing based on subradiance.

  • Figure
  • Figure
  • Figure
  • Figure
  • Figure
  • Figure
  • Figure
4 More
  • Received 18 December 2020
  • Accepted 3 March 2021

DOI:https://doi.org/10.1103/PhysRevX.11.021031

Published by the American Physical Society under the terms of the Creative Commons Attribution 4.0 International license. Further distribution of this work must maintain attribution to the author(s) and the published article’s title, journal citation, and DOI.

Published by the American Physical Society

Physics Subject Headings (PhySH)

Atomic, Molecular & OpticalGeneral Physics

Viewpoint

Key Image

Finding Light in Dark Atomic Clouds

Published 10 May 2021

Researchers have prepared and manipulated subradiant states—in which collective effects slow down the decay of excited atoms—in a dense atomic cloud.

See more in Physics

Authors & Affiliations

Giovanni Ferioli1, Antoine Glicenstein1, Loic Henriet2, Igor Ferrier-Barbut1,*, and Antoine Browaeys1

  • 1Université Paris-Saclay, Institut d’Optique Graduate School, CNRS, Laboratoire Charles Fabry, 91127, Palaiseau, France
  • 2Pasqal, 2 Avenue Augustin Fresnel, 91120 Palaiseau, France

  • *igor.ferrier-barbut@institutoptique.fr

Popular Summary

Interfaces between atoms and light are promising for quantum information protocols or metrology. When the atoms are close together, their influence on each other can produce collective interactions with the light field. A dramatic manifestation of this is “subradiance,” a strongly reduced emission rate of an excitation stored in a medium. This could be used to store and release light on demand, but the requirements for doing so are difficult to study. Here, we report the first observation of subradiance in a regime required for storing more than one photon.

Storage and release of light is possible when the distance between the atoms is smaller than the wavelength of the light and if the coupling between atoms can be controlled externally. This regime is very difficult to treat theoretically, making it challenging to understand subradiance beyond the regime where a single photon is stored in the ensemble. In our experiments, we trap an ensemble of ultracold rubidium atoms. By exciting the atoms with a resonant laser, we store light in subradiant excitations; we then use a second laser to switch off the interactions between the atoms and release the stored light.

These results provide an important benchmark for many-body theories and show that subradiance could provide an interesting path to tailored light-matter interfaces.
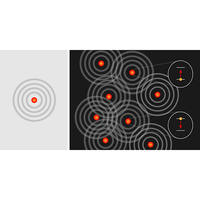
Key Image

Article Text

Click to Expand

References

Click to Expand
Issue

Vol. 11, Iss. 2 — April - June 2021

Subject Areas
Reuse & Permissions
Author publication services for translation and copyediting assistance advertisement

Authorization Required


×

Images

  • Figure 1
    Figure 1

    (a) Schematics of the experimental setup. Four high-numerical-aperture (0.5) lenses collect the fluorescence emitted by the atomic cloud along two axes, which is then fiber-coupled to avalanche photodiodes (APD). The excitation beam is aligned in the vertical direction. The trap beam (not shown) propagates along x, which is also the first collection axis. The second collection axis is at 45° with respect to the excitation direction. (b) Number of photons collected in bins of 0.5 ns as a function of time after switching off the excitation light (saturation parameter s27) for a cloud containing about 5000 (blue solid line) and 300 atoms (purple solid line), where data are represented with a moving average. These data are obtained by repetition of 20 pulses on 10000 clouds. Gray line: excitation pulse temporal shape. Dashed line: solution of the optical Bloch equations solved for our pulse shape. All curves have been normalized to their steady-state value during the excitation. (c) Time traces collected using the APD aligned along the y direction (APD, long-dashed purple) and along x (APD//, solid blue). The dashed black line shows the solution of OBEs. (d) Numerical simulations of the experiment using a nonlinear coupled-dipole model [31, 34] in an ensemble of 200 atoms with ρ0/k3=0.3. Black dashed line: solution of optical Bloch equations for a single atom.

    Reuse & Permissions
  • Figure 2
    Figure 2

    Decay times in units of the single-atom lifetime Γ01 evaluated by fitting the traces with a sum of two exponential decays (filled symbols) or with a single one (empty symbols), as explained in the text. The three different data sets are obtained in three different geometries, giving cloud Gaussian sizes (lr, lx): (0.7λ, 7.7λ) (circles), (0.5λ, 6.0λ) (diamonds), and (0.4λ,2.9λ) (squares). (a) Experimental data as a function of the atom number. (b,c) Same data plotted as a function of the optical depth b0 and of the central cloud density ρ0. For all the measurements, the saturation parameter is s=I/Isat27. Error bars on the decay time (standard errors from the fit) are smaller than the marker size.

    Reuse & Permissions
  • Figure 3
    Figure 3

    (a) Measurement of the decay time of the subradiant tail (unit of Γ01) as a function of the saturation parameter s of the excitation laser. Black dashed line: single-atom decay time. (b) Total number of counts recorded in the subradiant tail (normalized to the maximum value) as a function of s, together with a fit by a function αs/(1+αs) (blue solid line). From the fit, we extract a decay time τ=αΓ01 (see text), which is shown as a solid blue line in panel (a). Black dashed line: single-atom response obtained by setting α=1 in the previous equation. Inset: independent decay process of multiply excited subradiant states (here, exemplified with nexc=2). Singly excited states decay independently at a rate given by decay rates of the single-excitation subradiant eigenmodes.

    Reuse & Permissions
  • Figure 4
    Figure 4

    Release of the light stored in subradiant excitations. (a) Experimental realization, each time trace represents an experimental sequence where the inhomogeneous broadening is applied at a different time, highlighted by the respective arrows. (b) Histogram of the decay times of the collective modes evaluated from the eigenvalues of the interaction matrix for 5000 atoms with the same density distribution as in the experiment, for ten realizations. Red (blue) histograms are calculated with (without) inhomogeneous broadening. (c) Results of the mean-field nonlinear coupled dipole simulations. Dashed lines: temporal evolution of the total excited state population p(t). Solid lines: intensity dp/dt emitted in a 4π solid angle. Purple lines: case where the inhomogeneous broadening is applied at t=12.5/Γ0. Blue lines: no inhomogeneous broadening applied.

    Reuse & Permissions
  • Figure 5
    Figure 5

    Directionality of the emitted light pulse. Release of the subradiant excitation, observed with light collected axially (APD//) (bottom curves) and radially (APD) (top curves). The experiment is performed with a linear polarization of the excitation light, either parallel (dotted lines) or perpendicular (dashed lines) to the cloud, and with a circular polarization in the presence of a 50-G magnetic field aligned along the excitation direction (solid lines).

    Reuse & Permissions
  • Figure 6
    Figure 6

    Photon-count traces acquired as a function of the excitation frequency. The experimental data have been acquired in the shallowest trapping geometry described in the main text with N4500. The temporal traces have been divided by the number of pulses of light used; thus, they represent the mean number of photons collected during one pulse of resonant light.

    Reuse & Permissions
  • Figure 7
    Figure 7

    (a) Solid line: example of decay in the small-atom-number regime (N300) shown with the fit using a single exponential decay (dashed line). (b) Solid line: decay in the large-atom-number regime (N4000), dashed line: phenomenological fit with the sum of two exponential decays. The dotted lines represent the two different decay rates, i.e., super- and subradiance. The traces in panels (a) and (b) have been normalized to the steady state. (c) Values of χ2 obtained with the double-exponential (filled circles) or a single-exponential decay (empty markers) versus atom number.

    Reuse & Permissions
  • Figure 8
    Figure 8

    Photon-count decay with a linear polarization, no magnetic field, and no optical pumping, i.e., multilevel situation (blue). The same is shown for the two-level case: 20-G magnetic field, σ polarization, and prior optical pumping (purple). The two traces have been normalized to the steady state, with measurements for N4500 in the first trapping geometry (see Appendix pp4).

    Reuse & Permissions
  • Figure 9
    Figure 9

    Tail ratio as defined by Eq. (F) for the same data sets as used to extract the decay times in Fig. 2 (s27).

    Reuse & Permissions
  • Figure 10
    Figure 10

    (a) Photon-count decays acquired for different excitation intensities. (b) Numerical simulations performed with a nonlinear coupled-dipole model, using 100 atoms at a density ρ0/k3=0.3. The traces have been normalized to the steady-state value of the measurement at largest intensity. Here, we define the origin of the time (t=0) 30 ns after switching off the excitation.

    Reuse & Permissions
  • Figure 11
    Figure 11

    Left panel: photon-count decays acquired for different drive intensities. Right panel: photon-count decays acquired as a function of the atom number for the first trapping geometry (circles in Figs. 2 and 9).

    Reuse & Permissions
×

Sign up to receive regular email alerts from Physical Review X

Reuse & Permissions

It is not necessary to obtain permission to reuse this article or its components as it is available under the terms of the Creative Commons Attribution 4.0 International license. This license permits unrestricted use, distribution, and reproduction in any medium, provided attribution to the author(s) and the published article's title, journal citation, and DOI are maintained. Please note that some figures may have been included with permission from other third parties. It is your responsibility to obtain the proper permission from the rights holder directly for these figures.

×

Log In

Cancel
×

Search


Article Lookup

Paste a citation or DOI

Enter a citation
×