Location via proxy:   [ UP ]  
[Report a bug]   [Manage cookies]                
  • Open Access

Observation of Light-Induced Dipole-Dipole Forces in Ultracold Atomic Gases

Mira Maiwöger, Matthias Sonnleitner, Tiantian Zhang, Igor Mazets, Marion Mallweger, Dennis Rätzel, Filippo Borselli, Sebastian Erne, Jörg Schmiedmayer, and Philipp Haslinger
Phys. Rev. X 12, 031018 – Published 27 July 2022

Abstract

Light-matter interaction is well understood on the single-atom level and routinely used to manipulate atomic gases. However, in denser ensembles, collective effects emerge that are caused by light-induced dipole-dipole interactions and multiple photon scattering. Here, we report on the observation of a mechanical deformation of a cloud of ultracold Rb87 atoms due to the collective interplay of the atoms and a homogenous light field. This collective light scattering results in a self-confining potential with interesting features: It exhibits nonlocal properties, is attractive for both red- and blue-detuned light fields, and induces a remarkably strong force that depends on the gradient of the atomic density. Our experimental observations are discussed in the framework of a theoretical model based on a local-field approach for the light scattered by the atomic cloud. Our study provides a new angle on light propagation in high-density ensembles and expands the range of tools available for tailoring interactions in ultracold atomic gases.

  • Figure
  • Figure
  • Figure
  • Figure
  • Figure
  • Figure
  • Figure
2 More
  • Received 2 February 2022
  • Accepted 21 June 2022

DOI:https://doi.org/10.1103/PhysRevX.12.031018

Published by the American Physical Society under the terms of the Creative Commons Attribution 4.0 International license. Further distribution of this work must maintain attribution to the author(s) and the published article’s title, journal citation, and DOI.

Published by the American Physical Society

Physics Subject Headings (PhySH)

Atomic, Molecular & Optical

Authors & Affiliations

Mira Maiwöger1, Matthias Sonnleitner2,3, Tiantian Zhang1, Igor Mazets1,4,5, Marion Mallweger1,6, Dennis Rätzel7,3, Filippo Borselli1, Sebastian Erne1, Jörg Schmiedmayer1, and Philipp Haslinger1,3,*

  • 1Vienna Center for Quantum Science and Technology, Atominstitut, TU Wien, 1020 Vienna, Austria
  • 2Institute for Theoretical Physics, University of Innsbruck, 6020 Innsbruck, Austria
  • 3Erwin Schrödinger International Institute for Mathematics and Physics, University of Vienna, 1090 Vienna, Austria
  • 4Research Platform MMM “Mathematics-Magnetism-Materials,” c/o Fakultät für Mathematik, University of Vienna, 1090 Vienna, Austria
  • 5Wolfgang Pauli Institute, c/o Fakultät für Mathematik, University of Vienna, 1090 Vienna, Austria
  • 6Department of Physics, Stockholm University, SE-106 91 Stockholm, Sweden
  • 7Institut für Physik, Humboldt-Universität zu Berlin, 12489 Berlin, Germany

  • *philipp.haslinger@tuwien.ac.at

Popular Summary

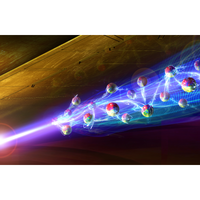
The interaction between individual atoms and laser light is well understood, and scientists routinely use light to trap and control small particles. But adding more atoms leads to complex phenomena mediated by multiple scatterings where the particles collectively interact with a light beam. One of these collective effects is that the incoming laser triggers an effective force between the atoms. This work presents the first observation of this force.

Our experiment starts by packing ultracold rubidium atoms into a dense, needle-shaped cloud. When a laser hits this cloud, each atom becomes an oscillating dipole emitting its own radiation. The next atom sees not only the laser field but also the light scattered by the first dipole—and of all other dipoles in the cloud. Through these interactions, the laser induces an effective dipole-dipole interaction.

This collective interaction can be interpreted as an effective optical force that arises because of the modification of the incoming light beam by the atomic cloud itself: For some laser frequencies, the cloud acts like a weak lens, focusing the light inside the atomic ensemble, roughly at regions of maximal particle density. Incidentally, the atoms are also pulled toward regions of high light intensity. This creates a feedback loop where atoms focus the light inside the cloud and the light pulls the atoms toward its focus. Experimentally, we observe that the light beam triggers a radial compression of the quasi-1D cloud.

Studying this compression provides a new way to test theoretical models on light propagation in high-density ensembles. Light-induced dipole-dipole interactions might also become a new tool to trap, control, and manipulate ultracold atomic gases.
Key Image

Article Text

Click to Expand

References

Click to Expand
Issue

Vol. 12, Iss. 3 — July - September 2022

Subject Areas
Reuse & Permissions
Author publication services for translation and copyediting assistance advertisement

Authorization Required


×

Images

  • Figure 1
    Figure 1

    (a) 3D illustration of the experimental setup. A 1D BEC is magnetically trapped below an atom chip. After releasing the atoms from the trap, they are illuminated with a spatially homogeneous laser pulse to induce the LIDD interaction. The beam is aligned nearly parallel to the long (z) axis (see the text). After 44 ms TOF, the atomic cloud is imaged using a light sheet imaging system. (b) Sketch of the experimental sequence: After switching off the trap, the 1D BEC expands for 10500μs before being illuminated with a 5μs-long laser pulse. The LIDD interaction causes the atomic cloud to contract in the transverse directions, resulting in a reduced transverse width σL compared to the width σ0 without additional illumination of the freely expanding cloud. Averaged light sheet images with mean atom number N=6600(130) (c) without and (d) with illumination by the laser beam with blue-detuned light (Δ=+100Γ) and intensity I=28.3(0.8)Isat for 5μs, 105μs after trap release. The lines indicate the corresponding transverse density profile after integrating over the full extension of the 1D BEC along the long z axis. Note that the 1D BEC expands mainly in the initially tightly confined transverse (radial) directions, resulting in an inverted aspect ratio of the cloud after 44 ms of flight in the light sheet image.

    Reuse & Permissions
  • Figure 2
    Figure 2

    Simulated interaction between a 1D BEC and red- or blue-detuned light. (a) Density distribution for N=6200 atoms after an expansion time of 100μs. For red-detuned light (Δ=392Γ), this corresponds to a peak refractive index of approximately 1.002. For blue-detuned light (Δ=+100Γ), the refractive index is reduced to approximately 0.993. The black dotted ellipse indicates where the atom density drops to 10% of its peak value. (b) The macroscopic electric field [solution to Eq. (8)] from the interaction between a red-detuned plane laser wave (traveling from left to right, indicated by arrows) and the cloud of atoms (indicated by the dotted ellipse). We see that atoms act like a focusing lens. (c) Resulting atom-light potential [cf. Eq. (9)]. The saturation is chosen as in Fig. 3 with s=319×106. (d) Radial potential at y=z=0 for red- and blue-detuned cases (red and blue solid line, respectively); the black, dash-dotted curve shows the original radial trapping potential ωx2/(2a2) for comparison; the radial atomic density is indicated by the dotted green curve and measured by the right ordinate. The potentials are shifted such that V(0)=0. Note that the collective atom-light potentials are remarkably strong, comparable to the original magnetic trapping potential, but they have a very different shape. The LIDD self-confining potential shows a depth equivalent to approximately 8μK. (e) The same as (b), but for blue-detuned (Δ=+100Γ) light. The atoms now act like a divergent lens. (f) The same as (c), atom-light potential for a saturation s=708×106 and Δ=+100Γ. In both (c) and (f), the highest potential energy corresponds to light interacting with a single atom. The spatial variation of the potential energy causes a compression for red as well as for blue detunings (force indicated by arrows).

    Reuse & Permissions
  • Figure 3
    Figure 3

    (a) Relative average transverse width σ¯L/σ¯0 of the 1D BEC after TOF with (σ¯L) and without (σ¯0) LIDD interaction at different expansion times (atomic densities). The blue triangles [red circles] depict results for a laser detuning of Δ=+100Γ [Δ=392Γ] with a saturation parameter s=708(20)×106 [s=319(11)×106] and mean atom number N=6600(130) [N=7450(60)]. The reduction of the relative mean transverse width is compared to the theoretical prediction with (solid lines) and without (dashed lines) considering the observed atomic loss, respectively [see the text and dashed line in (b)]. The shaded areas are theoretical predictions that account for a ±10% variation of the atom number and the saturation parameter. (b) Integrated fluorescence signal S¯L after LIDD interaction compared to the signal without laser pulse interaction S¯0 [for the dataset shown in (a) with Δ=392Γ, losses for Δ=+100Γ are similar]. The black triangles show the integrated signal of the entire light sheet image, the red circles the signal in the bulk BEC; see also Fig. 9. For densities smaller than 50atoms/μm3, only the density-independent recoil due to spontaneous emission induced by the laser pulse is observed. For larger densities, additional mechanisms like superradiance and possibly light-assisted collisions cause atom loss of up to 25% (red circles). Adding these losses in the simulations greatly reduces the difference between theory and data [compare dashed and solid lines in (a)]. Error bars depict the standard error of the mean.

    Reuse & Permissions
  • Figure 4
    Figure 4

    (a) Relative average transverse width after illuminating the BEC for 5μs (with beam intensity I=11.54mW/cm2 or s=150×106 at Δ=100Γ) as a function of the detuning Δ after 100 (=^54atoms/μm3, turquoise circles) and 200μs (=^16atoms/μm3, purple triangles) free expansion time. We observe a reduction of the transverse width for red and blue detunings, while the maximum compression is redshifted from the bare atomic resonance at Δ=0. (b) Atomic signal after illumination normalized to the initial signal for a mean atomic density of 54atoms/μm3. Close to resonance, we observe not only a growing scattering halo around the 1D BEC (turquoise circles), but also the onset of superradiance and additional atom loss (reduction of the total signal, black triangles). We also observe a redshift in the losses. These phenomena are not included in the numerical simulations [solid lines in (a)], which, therefore, only qualitatively match the data. The error bars depict the standard error of the mean. Because of the strong loss close to resonance, the data are postselected based on the remaining atom number in the 1D BEC (cf. Fig. 9). The dashed line in (b) shows the signal remaining in the 1D BEC after illumination of a dilute cloud (500μs expansion time). For dilute clouds, the total signal remains constant.

    Reuse & Permissions
  • Figure 5
    Figure 5

    Relative transverse width σL(z)/σ0(z) as a function of the (axial) z axis of the BEC (after TOF=44ms) with σL(z) and without σ0(z) interaction with a 5μs-long laser pulse at a detuning of (a) Δ=392Γ, atom number N=7450(60), and saturation s=319(11)×106 and (b) Δ=+100Γ, N=6600(130), and s=708(29)×106. The laser pulse propagates from left to right. The circles (triangles) represent the measurements with the light pulse triggered after 105 (235)μs expansion time. The error bars show the standard error of the mean. The lines show the results of simulations including thermal phase and density noise for the condensate temperature T=135nK; see Appendix pp2. The shaded areas depict the standard error of the mean obtained from 100 runs of the numerical simulation. An asymmetric compression of the transverse width along the axial direction of the BEC is clearly observable for different mean atomic densities ρ at the start of the LIDD interaction. This behavior arises due to the nonlocality of the LIDD interaction.

    Reuse & Permissions
  • Figure 6
    Figure 6

    Simulated expansion of a cloud of N=6600 atoms with (solid lines) and without (dashed lines) the interaction with a spatially homogeneous laser pulse. The pulse with a saturation s=708×106 and a detuning Δ=+100Γ starts after an expansion time texp=105μs and lasts for 5μs. In the trap, at t=0, the cloud has a Gaussian width a200nm. (a) Evolution of the average radial density ρ(t,x)=dydz|ψ(t,x,y,z)|2 (in 1000atoms/μm; see the color scale on the right); the lines indicate the width σ of a fitted Gaussianexp[x2/(2σ2)]. (b) Transverse width of the Fourier transformed wave functions, ρ˜(t,qx)=dqydqz|ψ˜(t,qx,qy,qz)|2exp[qx2/(2σ˜2)]. The dashed vertical lines indicate the interaction time with the light pulse. We see that the width of the cloud does not change during the pulse, but the width of its Fourier transform (its momentum distribution) does. During the interaction, the wave function accumulates a position-dependent phase, which explains why the widths in real and Fourier space are reduced despite the otherwise free expansion.

    Reuse & Permissions
  • Figure 7
    Figure 7

    Simulations of the relative average transverse width σ¯L/σ¯0 of a BEC illuminated after different expansion times. The solid lines show the compression calculated with the full atom-light potential from Eq. (9) (used also for Fig. 3), while the dashed lines use the lowest-order approximation given in Eq. (5). The blue (red) lines are for detuning Δ=+100Γ (Δ=392Γ), atom number N=6600 (7450), and saturation s=708×106 (319×106) and do not include the experimentally observed losses. For expansion times >100μs, we see that the full model is in good agreement with the experimental data (indicated by circles and squares), while the approximate potential [Eq. (5)] gives a misleading prediction, especially for the blue-detuned case.

    Reuse & Permissions
  • Figure 8
    Figure 8

    Measured 1D density after 44 ms TOF for N=7450(60) atoms (black dots, average over ten repeats) compared to the simulated 1D density including phase and amplitude noise for N=7450atoms and T=135nK after 44 ms TOF, averaged over 100 repeats (blue line; see the text). The red line shows a bimodal fit to the data yielding a temperature of T=135(10)nK. The density of the condensed fraction is modeled with a Yang-Yang profile, the thermal fraction containing approximately 10% of the atoms by a Bose function (dashed purple line) [67]. The gray shaded area depicts the plot range in Fig. 5 in the main text.

    Reuse & Permissions
  • Figure 9
    Figure 9

    Region of interests (ROI) for scattering rate measurement. Single-shot image of a 1D BEC after 44 ms time of flight without (a) and with (b) illumination with a 40μs-long laser pulse 500μs after trap release. The data are recorded with mean atom number N=7450(60), s=319(11)×106, and Δ=392Γ. The orange lines indicate the ROI for the evaluation of the signal in the atom cloud (cf. Fig. 3). The laser beam is aligned parallel to the axial direction of the initial 1D BEC and indicated by the yellow arrow. (c),(d) Integrated longitudinal profile without (c) and with (d) illumination (logarithmic scale), each averaged over five repeats. Apart from the bulk BEC at z=0, two additional side peaks at Δz±500μm are visible. This is the signal from atoms that have gained a momentum Δk=Δz(m/tTOF)±2h/λ=±2k0 along z while interacting with the laser beam (λ780nm). The peaks at Δz±500μm, corresponding to Δk±2k0, are due to superradiant emission, mostly in the forward direction. For 0k2k0, the recoil of the atoms due to absorption and spontaneous emission is clearly visible.

    Reuse & Permissions
×

Sign up to receive regular email alerts from Physical Review X

Reuse & Permissions

It is not necessary to obtain permission to reuse this article or its components as it is available under the terms of the Creative Commons Attribution 4.0 International license. This license permits unrestricted use, distribution, and reproduction in any medium, provided attribution to the author(s) and the published article's title, journal citation, and DOI are maintained. Please note that some figures may have been included with permission from other third parties. It is your responsibility to obtain the proper permission from the rights holder directly for these figures.

×

Log In

Cancel
×

Search


Article Lookup

Paste a citation or DOI

Enter a citation
×