Location via proxy:   [ UP ]  
[Report a bug]   [Manage cookies]                
  • Open Access

Interaction-Driven Topological Phase Diagram of Twisted Bilayer MoTe2

Wen-Xuan Qiu, Bohao Li, Xun-Jiang Luo, and Fengcheng Wu
Phys. Rev. X 13, 041026 – Published 7 November 2023

Abstract

Twisted bilayer MoTe2 is a promising platform to investigate the interplay between band topology and many-body interactions. We present a theoretical study of its interaction-driven quantum phase diagrams based on a three-orbital model, which can be viewed as a generalization of the Kane-Mele-Hubbard model with one additional orbital and long-range Coulomb repulsion. We predict a cascade of phase transitions tuned by the twist angle θ. At the hole-filling factor ν=1 (one hole per moiré unit cell), the ground state can be in the multiferroic phase, with coexisting spontaneous layer polarization and magnetism; the quantum anomalous Hall phase; and finally, the topologically trivial magnetic phases, as θ increases from 1.5° to 5°. At ν=2, the ground state can have a second-order phase transition between an antiferromagnetic phase and the quantum spin Hall phase as θ passes through a critical value. The dependence of the phase boundaries on model parameters, such as the gate-to-sample distance, the dielectric constant, and the moiré potential amplitude, is examined. The predicted phase diagrams can guide the search for topological phases in twisted transition metal dichalcogenide homobilayers.

  • Figure
  • Figure
  • Figure
  • Figure
  • Figure
  • Figure
  • Figure
6 More
  • Received 23 May 2023
  • Revised 6 September 2023
  • Accepted 12 October 2023

DOI:https://doi.org/10.1103/PhysRevX.13.041026

Published by the American Physical Society under the terms of the Creative Commons Attribution 4.0 International license. Further distribution of this work must maintain attribution to the author(s) and the published article’s title, journal citation, and DOI.

Published by the American Physical Society

Physics Subject Headings (PhySH)

Condensed Matter, Materials & Applied Physics

Authors & Affiliations

Wen-Xuan Qiu1, Bohao Li1, Xun-Jiang Luo1, and Fengcheng Wu1,2,*

  • 1School of Physics and Technology, Wuhan University, Wuhan 430072, China
  • 2Wuhan Institute of Quantum Technology, Wuhan 430206, China

  • *wufcheng@whu.edu.cn

Popular Summary

In solid-state materials, the interplay between electron interactions and band topology—which characterizes features similar to knots and twists in electronic band structure—can drive a plethora of intriguing quantum phases. Twisted bilayer MoTe2 is a promising platform for investigating this interplay. Here, two atom-thick layers of MoTe2 are stacked slightly askew to one another, creating a moiré interference pattern between the layers. It is the superlattice formed by this moiré pattern that provides a powerful platform for exploring various types of quantum phenomena. In this work, we present a theoretical study of the interaction-driven phase diagram of twisted bilayer MoTe2 at integer hole-filling factors, where each moiré unit cell has an integer number of doped holes.

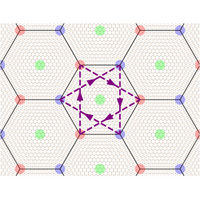
Our study is based on an interacting three-orbital model, where each unit cell contains three electron orbitals. This model faithfully captures the band dispersion, symmetry, and topology of low-energy moiré bands for a large range of twist angles. We predict a cascade of phase transitions, tuned by the twist angle. When each moiré unit cell has just one doped hole, the ground state can change from a multiferroic phase with coexisting spontaneous layer polarization and magnetism, to a quantum anomalous Hall phase, and finally to trivial magnetic phases, as the twist angle increases. At two holes per unit cell, the ground state can have a continuous phase transition between an antiferromagnetic phase and a quantum spin Hall phase as the twist angle passes through a critical value.

Our constructed three-orbital model can serve as a theoretical framework for studying twisted bilayer MoTe2, while the resulting theoretical phase diagrams can provide a guide for future experiments.

Key Image

Article Text

Click to Expand

References

Click to Expand
Issue

Vol. 13, Iss. 4 — October - December 2023

Subject Areas
Reuse & Permissions
Author publication services for translation and copyediting assistance advertisement

Authorization Required


×

Images

  • Figure 1
    Figure 1

    (a) Moiré superlattices formed in tMoTe2. Green, red, and blue dots indicate, respectively, O, A, and B sites, which also correspond to the centers of the three Wannier orbitals. The black dashed lines mark a moiré unit cell. (b,c) Moiré band structure at θ=1.5° and 2.5° in the +K valley. The integer numbers at γ and κ± label the C3z angular momentum of the first three bands (see Appendix pp1) while the color represents the relative weight of the three Wannier orbitals. The band structures are plotted along high-symmetry paths in momentum space with κ+=κ.

    Reuse & Permissions
  • Figure 2
    Figure 2

    Amplitude of each layer component of Wannier states Wnτ(r)=[Wbnτ(r),Wtnτ(r)]T for θ=2.5° and τ=+. The black lines mark the effective triangular lattice formed by O sites.

    Reuse & Permissions
  • Figure 3
    Figure 3

    (a,b) Top panel: quantum phase diagram at ν=1 as a function of θ and d. The color map plots the charge gap. White solid lines mark the first-order phase transitions. Bottom panel: energy per moiré unit cell of competing states relative to the layer unpolarized but valley-polarized (LUP-VP) states at d=20nm. Here, ε is 10 in (a) and 15 in (b). (c) Schematic illustration of competing states. In the LPFMx, LPFMz, LP120°AF+, and LP120°AF states, the A and B sublattices have unequal hole densities. In the LPFMx (LPFMz) state, A (or B) sublattices have ferromagnetism along the x (z) direction. In the LP120°AF+ (LP120°AF) state, the Néel order has an anticlockwise (clockwise) arrangement on A (or B) sublattices along the y direction. Similar notations are used for OFMx and O120°AF± states, of which magnetic moments are developed on the O sublattice. In QAHI and FMz states, the A and B sublattices have equal density, and the magnetization is along the z direction. The total Chern number is 1 in QAHI and 0 in FMz states, both of which can be classified as LUP-VP states.

    Reuse & Permissions
  • Figure 4
    Figure 4

    (a)–(c) HF band structure at ν=1 in (a) the LPFMz phase at θ=1.5°, (b) the QAHI phase at θ=2.5°, and (c) the FMz phase at θ=3.5°. The band structures are presented in the basis defined by cknτ and cknτ operators. The solid and dotted lines, respectively, plot bands from +K and K valleys. The color represents the weight of the three Wannier orbitals. The middle of the interaction-induced gap, marked by the black dashed line, is set to 0 in each plot. The integer numbers at γ and κ± label the C3z angular momentum of the band above the Fermi energy. (d) Sublattice polarization PAB (red line), the hole number nO on each O site (blue dashed line), and the charge gap (black line) in ν=1 ground states as a function of θ. Note that PAB characterizes the layer polarization and is defined as |nAnB|/(nA+nB), where nA (nB) is the hole number on each A (B) site. The vertical dashed lines mark the transitions between different phases. Here, d is 20 nm, and ε is 15 for panels (a)–(d).

    Reuse & Permissions
  • Figure 5
    Figure 5

    Quantum phase diagram at ν=1 and d=20nm as a function of θ and ε. The color map plots the charge gap. The symbol “M” stands for the metallic state without any symmetry breaking. The white dashed line separates gapped and gapless O120°AF± states.

    Reuse & Permissions
  • Figure 6
    Figure 6

    (a,b) Top panel: quantum phase diagram at ν=2 as a function of θ and d. The color map plots the charge gap. White solid (dashed) lines mark the first (second)-order phase transitions. Bottom panel: energy per moiré unit cell of competing states relative to the symmetric (sym) state at d=20nm. Note that ε is 10 in (a) and 15 in (b). (c) Schematic illustration of competing states at ν=2.

    Reuse & Permissions
  • Figure 7
    Figure 7

    (a)–(c) HF band structure at ν=2 in (a) the FMz phase at θ=1.5°, (b) the AFx phase at θ=2.5°, and (c) the QSHI phase at θ=4.7°. The band structures are presented in the basis defined by cknτ and cknτ operators. The color represents the weight of the O orbital. In panel (a), the solid and dotted lines, respectively, plot bands from +K and K valleys. In panels (b) and (c), each band is doubly degenerate. (d) Charge gap (black line) and the in-plane magnetic moment MxA on the A sublattice (blue line) in ν=2 ground states as a function of θ. Note that d is 20 nm, and ε is 15 for panels (a)–(d).

    Reuse & Permissions
  • Figure 8
    Figure 8

    Quantum phase diagram at ν=2 and d=20nm as a function of θ and ε. The color map plots the charge gap. The symbol “M” stands for the metallic state.

    Reuse & Permissions
  • Figure 9
    Figure 9

    Quantum phase diagram at ν=1 as a function of θ and V for d=20nm and ε=15. Different phases are separated by blue solid lines. The blue dashed line is a continuation of the phase boundary between the FMz and QAHI phases if the O120°AF± phase is fully suppressed by an out-of-plane magnetic field.

    Reuse & Permissions
  • Figure 10
    Figure 10

    Phase diagram of the Haldane-V model. Phase (i) is the QAHI phase with ρz=0 and quantized Chern number |C|=1. Phase (iii) is sublattice polarized with ρz0 and topologically trivial with |C|=0. There is an intermediate phase (ii) with ρz0 but |C|=1.

    Reuse & Permissions
  • Figure 11
    Figure 11

    Noninteracting Fermi surface (white dashed line) at half filling of the topmost moiré valence bands. The color map shows the energy dispersion in the first moiré Brillouin zone. The vector Q indicates an approximate nesting.

    Reuse & Permissions
  • Figure 12
    Figure 12

    Energy per moiré unit cell of competing states relative to the LUP-VP states at ν=1, ε=15, and d=20nm. The results are obtained using (a) one-band and (b) two-band models, respectively. Other parameter values are the same as those used in Fig. 3.

    Reuse & Permissions
  • Figure 13
    Figure 13

    (a)–(c) HF band structure for the ν=1 QAHI phase at θ=2.5° calculated with one-band, two-band, and three-orbital models, respectively. The solid and dotted lines, respectively, plot bands from the +K and K valleys. (d) Charge gap of the QAHI phase obtained from one-band (red), two-band (green), and three-orbital (blue) models for the twist angle range from 2° to 2.9°, where the QAHI phase is the same ground state in all three models. Parameter values are the same as those used in Fig. 12.

    Reuse & Permissions
×

Sign up to receive regular email alerts from Physical Review X

Reuse & Permissions

It is not necessary to obtain permission to reuse this article or its components as it is available under the terms of the Creative Commons Attribution 4.0 International license. This license permits unrestricted use, distribution, and reproduction in any medium, provided attribution to the author(s) and the published article's title, journal citation, and DOI are maintained. Please note that some figures may have been included with permission from other third parties. It is your responsibility to obtain the proper permission from the rights holder directly for these figures.

×

Log In

Cancel
×

Search


Article Lookup

Paste a citation or DOI

Enter a citation
×