Location via proxy:   [ UP ]  
[Report a bug]   [Manage cookies]                
  • Open Access

Measurement-Altered Ising Quantum Criticality

Sara Murciano, Pablo Sala, Yue Liu, Roger S. K. Mong, and Jason Alicea
Phys. Rev. X 13, 041042 – Published 5 December 2023

Abstract

Quantum critical systems constitute appealing platforms for exploring novel measurement-induced phenomena due to their innate sensitivity to perturbations. We study the impact of measurements on paradigmatic Ising quantum-critical chains using an explicit protocol, whereby correlated ancillae are entangled with the critical chain and then projectively measured. Using a perturbative analytic framework supported by extensive numerical simulations, we demonstrate that measurements can qualitatively alter critical correlations in a manner dependent on the choice of entangling gate, ancilla measurement basis, measurement outcome, and nature of ancilla correlations. We further show that measurement-altered Ising criticality can be pursued surprisingly efficiently in experiments featuring of order 100 qubits by postselecting for high-probability measurement outcomes or, in certain cases, by averaging observables separately over measurement outcomes residing in distinct symmetry sectors. Our framework naturally adapts to more exotic quantum-critical points and highlights opportunities for realization in noisy intermediate-scale quantum hardware and in Rydberg arrays.

  • Figure
  • Figure
  • Figure
  • Figure
  • Figure
  • Figure
  • Figure
15 More
  • Received 23 February 2023
  • Accepted 20 October 2023

DOI:https://doi.org/10.1103/PhysRevX.13.041042

Published by the American Physical Society under the terms of the Creative Commons Attribution 4.0 International license. Further distribution of this work must maintain attribution to the author(s) and the published article’s title, journal citation, and DOI.

Published by the American Physical Society

Physics Subject Headings (PhySH)

Condensed Matter, Materials & Applied Physics

Authors & Affiliations

Sara Murciano1,2,*, Pablo Sala1,2,*, Yue Liu1, Roger S. K. Mong3, and Jason Alicea1,2

  • 1Department of Physics and Institute for Quantum Information and Matter, California Institute of Technology, Pasadena, California 91125, USA
  • 2Walter Burke Institute for Theoretical Physics, California Institute of Technology, Pasadena, California 91125, USA
  • 3Department of Physics and Astronomy and Pittsburgh Quantum Institute, University of Pittsburgh, Pittsburgh, Pennsylvania 15260, USA

  • *These authors contributed equally to this work.

Popular Summary

Measurements play a fundamental role in quantum mechanics, spurring some of the most famous conundrums in physics. In the modern era, measurements can not only probe quantum systems, but also generate novel phenomena ranging from entanglement phase transitions to efficient preparation of exotic ground states. In this work, we extend measurement-induced phenomena into new, experimentally relevant territory by uncovering a remarkably rich interplay between measurements and correlations emerging at certain quantum phase transitions that arise in myriad settings.

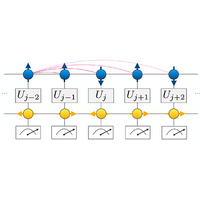
Specifically, we study 1D Ising phase transitions, which display universal fluctuations that arise when a collection of spins is tuned to a critical point between ferromagnetic and nonmagnetic states of matter. We explore a protocol—amenable to both experiment and theoretical methods—that weakly entangles an Ising critical system to auxiliary qubits and then measures the latter. This procedure “weakly” measures the critical degrees of freedom, yielding behavior that strikingly transcends the conventional Ising transition paradigm.

Conventionally in 1D Ising transitions, the microscopic constituents exhibit power-law correlations with rigid decay exponents that do not depend on any system details. In our procedure, depending on the particulars of the auxiliary system, measurements can instead yield continuously variable power-law exponents, or catalyze magnetic ordering. These effects can be revealed efficiently in experiments of order 100 qubits by either postselecting for high-probability measurement outcomes or, in certain cases, by averaging observables separately over measurement outcomes residing in distinct symmetry sectors.

Our results deepen the understanding of measurement-altered quantum criticality and offer practical guidelines for experimental investigations in current quantum computing hardware and Rydberg atom arrays.
Key Image

Article Text

Click to Expand

References

Click to Expand
Issue

Vol. 13, Iss. 4 — October - December 2023

Subject Areas
Reuse & Permissions
Author publication services for translation and copyediting assistance advertisement

Authorization Required


×

Images

  • Figure 1
    Figure 1

    Protocol used to explore measurement-altered Ising criticality (left) and summary of the main results (right). (a) The upper chain is always prepared in the ground state |ψc of the critical transverse-field Ising model. The ancilla chain is initialized into the ground state |ψa of the Ising model either in the paramagnetic phase or at criticality. (b) After a unitary that entangles the two chains followed by (c) ancilla measurements, the ancilla chain enters a product state |s˜ while the upper chain enters a state |ψs˜ dependent on the measurement outcome s˜. (d) Physical operators A for the top chain are then probed in the state |ψs˜. The table (e) summarizes our predictions for the four cases that we explore, distinguished by the ancilla measurement basis and symmetry of the postmeasurement wave function |ψs˜.

    Reuse & Permissions
  • Figure 2
    Figure 2

    Variance of Vjk for Z˜-basis measurements. Panels (a) and (b), respectively, correspond to paramagnetic and critical ancillae. The variance decays exponentially with |jk| in the former but decays approximately as |jk|4 in the latter. Data are obtained using the methods in Appendix pp2 with a system size N=20.

    Reuse & Permissions
  • Figure 3
    Figure 3

    Standard deviation of mj for Z˜-basis measurements. For paramagnetic ancillae [panels (a) and (c)], in either case I or case II, the standard deviation decreases with N, with the trend suggesting saturation to a finite value in the thermodynamic limit. With critical ancillae [panels (b) and (d)], the standard deviation increases extremely slowly with N in both cases but remains comparable to the values with paramagnetic ancillae. Data are obtained using results from Appendix pp2.

    Reuse & Permissions
  • Figure 4
    Figure 4

    Vjk profiles for a uniform measurement outcome in case I of Table 1. Translation invariance of the uniform string outcome implies that Vjk depends only on |jk|. Decay in Vjk is exponential with paramagnetic ancillae [panel (a)] but power law (|jk|4) with critical ancillae [panel (b)]. The data are obtained for N=280 for critical ancillae using results from Appendix pp2.

    Reuse & Permissions
  • Figure 5
    Figure 5

    Vjk and mj profiles for a two-domain-wall measurement outcome in case I of Table 1. Domain walls reside near sites 0 and 100 in a system with N=200. Left and right columns show data for paramagnetic and critical ancillae, respectively. Because of loss of translation symmetry, we show Vjk versus k for several j values. As shown in the insets, Vjk decays with the distance |jk|, although we find a relative bump close to the domain walls. The corresponding mj profiles [panels (c) and (d)] exhibit dips near zero in the immediate vicinity of the domain walls, but are otherwise roughly uniform matching the values obtained for a uniform string outcome (black dashed lines). Data obtained using results from Appendix pp2.

    Reuse & Permissions
  • Figure 6
    Figure 6

    Vjk profile for a uniform X˜-basis measurement outcome. Decay of Vjk is exponential with paramagnetic ancillae and power law (approximately |jk|1) with critical ancillae. In the critical case, note the significantly smaller exponent compared to Fig. 4. Data obtained using results from Appendix pp2 with system size N=280 for critical ancillae.

    Reuse & Permissions
  • Figure 7
    Figure 7

    Vjk profile for a two-domain-wall X˜-basis measurement outcome. The first 30 sites point in the energetically favorable direction, while the remaining 30 sites point in the unfavorable direction. Nondecaying behavior of Vjk occurs when j, k both reside in the unfavorable domain. Data obtained using results from Appendix pp2 for system size N=60.

    Reuse & Permissions
  • Figure 8
    Figure 8

    Correlation function Z0Zjs˜ for uniform measurement outcomes. The first row corresponds to case I from Table 1, while the second corresponds to case III. At u=0, the curves exhibit an exponent 1/4 that follows from the pristine Ising CFT. Turning on u0 yields a measurement-induced increase in the scaling dimension in all panels, as predicted by Eq. (54) for case I and Eq. (68) for case III. Data are obtained using infinite DMRG with bond dimension 1000 for paramagnetic ancillae and 2000 for critical.

    Reuse & Permissions
  • Figure 9
    Figure 9

    Scaling of the power-law exponent for Z0Zjs˜ with a uniform measurement outcome. Data correspond to case I in Table 1 assuming paramagnetic ancillae and are obtained using iDMRG. The numerically extracted exponent α scales approximately linearly with u2 at small u, in quantitative agreement with 2Δσ(u) predicted by Eq. (54). A linear fit to Eq. (54) yields κmconst=1.14.

    Reuse & Permissions
  • Figure 10
    Figure 10

    Relative correlation function δZjZj [Eq. (58)] for a domain-wall measurement outcome in case I from Table 1. Main panels illustrate the relative change in the two-point function resulting from insertion of a domain wall. Panel (a) corresponds to u=0.1 and panel (b) to u=0.3. The domain wall resides near site x0=128 in an N=256 system with open boundary conditions. When j and j both sit on one side of the domain wall, the change in correlations is negligible. When they sit on opposite sides, however, the correlations increase relative to the uniform measurement outcome. As we discuss in the main text, the behavior captured here reproduces the main qualitative features of the analytical prediction in Eq. (57). Data are obtained using DMRG with paramagnetic ancillae.

    Reuse & Permissions
  • Figure 11
    Figure 11

    One-point function Zj with a uniform measurement outcome. Panels (a) and (b), respectively, correspond to cases II and IV from Table 1. Results are obtained using infinite DMRG with C=1, assuming paramagnetic ancillae. The nonzero value generated by measurement at u0 validates analytic predictions, e.g., Eq. (64). Moreover, the fits shown by the dashed lines exhibit excellent agreement with the u dependence extracted using renormalization-group arguments.

    Reuse & Permissions
  • Figure 12
    Figure 12

    Average of Zis˜2 over measurement outcomes in case II of Table 1. Data are obtained using exact diagonalization for two chains of length N=6, 7, 8, 9, 10 with C=1. Panels (a) and (b) reveal well-behaved scaling with system size; larger values of u correspond to darker blue, with the darkest color corresponding to u=0.13. Panels (c) and (d) show the extrapolated dependence of E(Zjs˜2) with u. For small u, we find approximately u4 scaling, consistent with the crude expectation that Zjs˜u2mj for a particular measurement outcome.

    Reuse & Permissions
  • Figure 13
    Figure 13

    Average of Zis˜2 over measurement outcomes in case IV of Table 1. All parameters are the same as in Fig. 12, except here we consider only paramagnetic ancillae. The scaling of E(Zjs˜2) with u in panel (b) is much steeper (approximately u2) compared to the scaling found in Fig. 12.

    Reuse & Permissions
  • Figure 14
    Figure 14

    Correlation function Z0Zjs˜ for case IV in Table 1 with C=0 and critical ancillae. (a) At u>0 the correlator appears to decay faster than a power law for |j| less than O(10) in response to the measurement-induced long-range interaction in Eq. (70). Data are obtained using iDMRG with bond dimension 2000. (b) Two-point correlator at u=0.2 for a range of bond dimensions χ. Over the separations shown in (a), the data are well converged. For larger separations, however, the data continue to evolve with bond dimension.

    Reuse & Permissions
  • Figure 15
    Figure 15

    Ratio r(Z0Zj) in Eq. (76) involving symmetry-resolved measurement averages. The data correspond to case III from Table 1 with paramagnetic ancillae, and different system sizes between N=20 [light colors in (a)] and N=115 [dark colors in (a)]. At u>0, the curves exhibit power-law decay with exponent exceeding 1/4 in agreement with Eq. (81). The shift in scaling dimension becomes particularly clear for larger values of u when compared with the black dotted lines corresponding to a power-law-decay exponent 0.25. The tendency continues upon extrapolating to the thermodynamic limit, as shown in (b). The power-law exponents α displayed in panel (a) are obtained from fitting the data with the largest system size available. Data are obtained using finite DMRG with periodic boundary conditions and bond dimension 1000.

    Reuse & Permissions
  • Figure 16
    Figure 16

    Comparison between power laws for the r(Z0Zj) ratio and Z0Zjs˜ correlator with a uniform measurement outcome in case III. The measurement-induced shift in power-law exponent for r(Z0Zj) exceeds that of Z0Zjs˜, in qualitative agreement with perturbative analytical predictions (though the enhancement is smaller than the predicted factor of 2). The green dashed line represents a quartic fit (1/4+κmconstu2/2+bu4) in u of the exponent for the r ratio, while the orange and purple lines are the result of a quadratic fit (1/4+κmconstu2/2). Data correspond to paramagnetic ancillae and are obtained with finite DMRG for a system of size N=88 with periodic boundary conditions and bond dimensions 800 and 1000.

    Reuse & Permissions
  • Figure 17
    Figure 17

    Ratio r(Zj) in Eq. (76) involving symmetry-resolved measurement averages. The data correspond to case IV from Table 1 with paramagnetic ancilla C=1 and system sizes between N=20 [light colors in(a)] and N=115 [dark colors in (a)]. Panel (a) shows that the small-u data are well fit by an approximate u0.23 scaling form consistent with the prediction from Eq. (83). As shown in (b), increasing u suppresses the dependence on system size such that r(Zj) quickly saturates to a finite value. Data are obtained using finite DMRG with periodic boundary conditions and bond dimension 1000.

    Reuse & Permissions
  • Figure 18
    Figure 18

    Comparison between symmetry-resolved averages and postselection. The vertical axis captures the ratio Muni/MSRAΔp2/puni, where Muni characterizes the number of trials needed for postselection that targets the uniform measurement outcome, and MSRA characterizes the number of trials required for evaluation of symmetry-resolved averages with order-one variance. All panels are consistent with symmetry-resolved averages providing more favorable scaling with system size N over a window of small u, as argued on general grounds in the main text. Data are obtained using finite DMRG with bond dimension χ=800 and periodic boundary conditions; case IV results use C=1.

    Reuse & Permissions
  • Figure 19
    Figure 19

    Scaling of Muni and MSRA with system size N. The number of trials needed for postselection of the uniform measurement outcome and to extract symmetry-resolved averages are here estimated by Muni=1/puni and MSRA=1/(Δp)2, respectively. Both approaches offer complementary regimes of experimental viability even at large systems with NO(100), as evidenced by a number of required trials of O(103) or smaller. Data are obtained identically as in Fig. 18.

    Reuse & Permissions
  • Figure 20
    Figure 20

    Coefficient ϒ in Eq. (b15). The plot shows the behavior of the coefficient describing the exponential growth with system size of the probability puni(0) for obtaining the uniform measurement outcome at u=0.

    Reuse & Permissions
  • Figure 21
    Figure 21

    Exponential decay of symmetry-resolved differences A+A with system size. (a) Probability difference Δp corresponding to A=1. (b) One-point expectation value corresponding to A=Zj. The result does not depend on the evaluated site j due to translation invariance. (c) Two-point correlator A=Z0Z10 evaluated at a distance 10 from the reference site. Data are obtained using (finite) DMRG with periodic boundary conditions for case IV (with C=1) in panels (a) and (b), and case III in panels (c) and (d) assuming paramagnetic ancilla.

    Reuse & Permissions
  • Figure 22
    Figure 22

    Scaling of Δp and puni. Upper panels show that the ratio puni/puni(0) exhibits excellent data collapse when plotted versus uζN, with ζ exponents specified in the horizontal axes. Lower panels show similar data collapse for Δp. These results are consistent with scaling behavior ΔpecSRAuζN and puni/puni(0)ecuniuζN. Data are obtained using finite DMRG with bond dimension χ=800 and periodic boundary conditions. Panels (e) and (f) for case IV correspond to C=1.

    Reuse & Permissions
×

Sign up to receive regular email alerts from Physical Review X

Reuse & Permissions

It is not necessary to obtain permission to reuse this article or its components as it is available under the terms of the Creative Commons Attribution 4.0 International license. This license permits unrestricted use, distribution, and reproduction in any medium, provided attribution to the author(s) and the published article's title, journal citation, and DOI are maintained. Please note that some figures may have been included with permission from other third parties. It is your responsibility to obtain the proper permission from the rights holder directly for these figures.

×

Log In

Cancel
×

Search


Article Lookup

Paste a citation or DOI

Enter a citation
×