Location via proxy:   [ UP ]  
[Report a bug]   [Manage cookies]                
  • Open Access

Nonlocal Elasticity Yields Equilibrium Patterns in Phase Separating Systems

Yicheng Qiang, Chengjie Luo, and David Zwicker
Phys. Rev. X 14, 021009 – Published 12 April 2024
PDFHTMLExport Citation

Abstract

Recent experiments demonstrated the emergence of regular mesoscopic patterns when liquid droplets form in an elastic gel after cooling. These patterns appeared via a continuous transition and were smaller in stiffer systems. We capture these observations with a phenomenological equilibrium model describing the density field of the elastic component to account for phase separation. We show that local elasticity theories are insufficient, even if they allow large shear deformations. Instead, we can account for key observations using a nonlocal elasticity theory to capture the gel’s structure. Analytical approximations unveil that the pattern period is determined by the geometric mean between the elastocapillary length and a nonlocality scale. Our theory highlights the importance of nonlocal elasticity in soft matter systems, reveals the mechanism of this mesoscopic pattern, and will improve the engineering of such systems.

  • Figure
  • Figure
  • Figure
  • Figure
  • Figure
  • Figure
  • Figure
  • Received 1 August 2023
  • Revised 16 December 2023
  • Accepted 5 March 2024

DOI:https://doi.org/10.1103/PhysRevX.14.021009

Published by the American Physical Society under the terms of the Creative Commons Attribution 4.0 International license. Further distribution of this work must maintain attribution to the author(s) and the published article’s title, journal citation, and DOI. Open access publication funded by the Max Planck Society.

Published by the American Physical Society

Physics Subject Headings (PhySH)

Statistical Physics & ThermodynamicsPolymers & Soft Matter

Authors & Affiliations

Yicheng Qiang, Chengjie Luo, and David Zwicker*

  • Max Planck Institute for Dynamics and Self-Organization, Am Faßberg 17, 37077 Göttingen, Germany

  • *david.zwicker@ds.mpg.de

Popular Summary

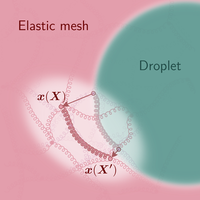
Phase separation is fundamental for forming patterns in many systems, including synthetic materials and living cells. These patterns are affected by the elastic properties of such systems, which oppose deformations induced by phase separation. Indeed, recent experiments in synthetic systems demonstrated that a regular pattern forms when a sufficiently stiff gel is cooled. These patterns appear continuously, reversibly, and independently of the cooling rate, suggesting they are equilibrium states originating from a trade-off between phase separation and elasticity. Yet, standard descriptions of such systems fail to explain the patterns. We propose a new phenomenological theory, which successfully predicts the formation of regular equilibrium patterns like those in experiments.

Our theory is based on nonlocal elasticity, which accounts for spatially correlated structures of the gel. We show that a combination of the gel’s elasticity and a nonlocality scale control the length scale of the emergent equilibrium pattern. We also hypothesize that the spatial heterogeneity of the gel’s network gives rise to the nonlocality scale. Our work highlights the importance of considering nonlocal elasticity for understanding phenomena occurring on length scales comparable to the correlation length of the material’s structure.

The insights from this work could advance the control of engineered patterns in soft-matter systems and improve our understanding of biological cells.

Key Image

Article Text

Click to Expand

Supplemental Material

Click to Expand

References

Click to Expand
Issue

Vol. 14, Iss. 2 — April - June 2024

Subject Areas
Reuse & Permissions
Author publication services for translation and copyediting assistance advertisement

Authorization Required


×

Images

  • Figure 1
    Figure 1

    Nonlocal elasticity yields regular equilibrium patterns. (a) Schematic picture of the experiment [1]: A relaxed elastic gel is swollen in a solvent at high temperature; after cooling, a regular pattern emerges. (b) Schematic of a network of elastic elements (curly lines) connecting material points (red dots). Arrows indicate the displacement of material points from the reference state (transparent, positions X) to the deformed state (opaque, positions x). The energy of the highlighted elastic element depends on the distance between the two connected points, revealing its nonlocal nature. Coarse graining this system yields the nonlocal convolution kernel (blue density), whose size ξ is roughly given by the length of the elastic elements. Note that the elastic elements need not correspond to molecules, but could capture the interaction of dense mesh regions since realistic meshes are heterogeneous. (c) Equilibrium profiles ϕ(x) for various stiffnesses E and interaction parameters χ for ϕ0=1, ϕ¯=0.5, and κ=0.05ξ2. Profiles were obtained by numerically minimizing Fnonlocal; see Supplemental Material [10].

    Reuse & Permissions
  • Figure 2
    Figure 2

    Grand-canonical phase diagrams reveal patterned phase. (a) Phase diagram as a function of the chemical potential μ and the interaction strength χ for E=0.01kBT/ν. Homogeneous phases (region H) coexist on the brown line between the critical point of phase separation (black disk) and the triple point (gray star), while the patterned phase (region P) coexists with the homogeneous phase on the blue and brown dashed line. (b) Phase diagram as a function of μ and χ for E=0.2kBT/ν. The binodal line separating the homogeneous and patterned phase exhibits either a first-order transition (blue and brown dashed line) or a continuous transition (red dotted line with associated critical points marked by red disks; see details in the Supplemental Material [10]). (a),(b) Model parameters are ϕ0=1 and κ=0.05ξ2.

    Reuse & Permissions
  • Figure 3
    Figure 3

    Closed systems exhibit phase coexistence. (a) Schematic free energy of homogeneous and patterned phases with common-tangent construction (thin gray lines) for two stiffnesses E. Figure S2 in Supplemental Material shows corresponding numerical results [10]. (b) Phase diagram as a function of the average fraction ϕ¯ of the elastic component and interaction strength χ for various E. Only the homogeneous phase (region H) is stable outside the binodal (brown line; black disk marks critical point) with a continuous phase transition at the red dotted part. Only the patterned phase (region P) is stable inside the blue lines with color codes indicating length scale and amplitude in the left- and right-hand column, respectively. Two indicated phases (H+P, P+H, H+H) coexist in other regions. The triple point corresponds to the tie line (thin gray line), where fractions ϕ¯ of coexisting homogeneous and patterned phases are marked by brown and blue stars, respectively. (c) Phase diagram as a function of ϕ¯, χ, and E. The binodal of the homogeneous phase (brown surface) and the patterned phase (blue surface) overlap in the continuous phase transition (red surface). The critical points in (b) now correspond to critical lines, which all merge in the tricritical point (large black disk). A rotating version of the diagram is available as a movie in Supplemental Material [10]. (a)–(c) Model parameters are ϕ0=1 and κ=0.05ξ2.

    Reuse & Permissions
  • Figure 4
    Figure 4

    Continuous phase transition recovers experimental measurements. Squared amplitude (a) and length scale (b) of periodic patterns as a function of interaction strength χ for various parameters indicated in (b), ϕ0=1, and κ=0.05ξ2. The amplitude indicates a continuous (colored data) and first-order (gray data) transition.

    Reuse & Permissions
  • Figure 5
    Figure 5

    Pattern length scale exhibits scaling laws. Length scale L as a function of stiffness E (a) and interfacial parameter κ (b) for various parameters. Putative scaling laws are indicated and the prediction by Eq. (9) is shown for ϕ0=1, ϕ¯=0.5, χ=4, and γkBTκ1/2/ν (green line).

    Reuse & Permissions
  • Figure 6
    Figure 6

    Approximate model explains scaling laws. (a) Example for a volume fraction profile (pink lines) and the corresponding piecewise approximation (dotted gray lines) in the reference (top) and lab frame (bottom). (b) Derivatives of the average energy density (in units of kBTξ/ν) as a function of the pattern period L˜. Shown are data from full numerics (symbols), numerics for the piecewise profile (solid lines), and asymptotic functions (dashed lines) for the elastic (gray, disks) and negative interfacial energy (violet, squares). The stable length L corresponds to the crossing point of the elastic (black) and the interfacial terms (violet). Model parameters are E=0.02kBT/ν, κ=0.05ξ2, ϕ0=1, ϕ¯=0.5, and χ=4.

    Reuse & Permissions
  • Figure 7
    Figure 7

    Heterogeneity could explain nonlocality scale ξ. (a) Schematic of a relatively regular mesh, whose nonlocality scale ξ is linked to the mesh size. (b) Schematic of a heterogeneous mesh, where ξ is given by the correlation length of spatial heterogeneities.

    Reuse & Permissions
×

Sign up to receive regular email alerts from Physical Review X

Reuse & Permissions

It is not necessary to obtain permission to reuse this article or its components as it is available under the terms of the Creative Commons Attribution 4.0 International license. This license permits unrestricted use, distribution, and reproduction in any medium, provided attribution to the author(s) and the published article's title, journal citation, and DOI are maintained. Please note that some figures may have been included with permission from other third parties. It is your responsibility to obtain the proper permission from the rights holder directly for these figures.

×

Log In

Cancel
×

Search


Article Lookup

Paste a citation or DOI

Enter a citation
×