Location via proxy:   [ UP ]  
[Report a bug]   [Manage cookies]                
  • Featured in Physics
  • Open Access

Observation of Pairwise Level Degeneracies and the Quantum Regime of the Arrhenius Law in a Double-Well Parametric Oscillator

Nicholas E. Frattini, Rodrigo G. Cortiñas, Jayameenakshi Venkatraman, Xu Xiao, Qile Su, Chan U. Lei, Benjamin J. Chapman, Vidul R. Joshi, S. M. Girvin, Robert J. Schoelkopf, Shruti Puri, and Michel H. Devoret
Phys. Rev. X 14, 031040 – Published 3 September 2024
Physics logo See Focus story: New Quantum Effect in Textbook Chemistry Law

Abstract

By applying a microwave drive to a specially designed Josephson circuit, we have realized a double-well model system: a Kerr oscillator submitted to a squeezing force. We have observed, for the first time, the spectroscopic fingerprint of a quantum double-well Hamiltonian when its barrier height is increased: a pairwise level kissing (coalescence) corresponding to the exponential reduction of tunnel splitting in the excited states as they sink under the barrier. The discrete levels in the wells also manifest themselves in the activation time across the barrier which, instead of increasing smoothly as a function of the barrier height, presents steps each time a pair of excited states is captured by the wells. This experiment illustrates the quantum regime of Arrhenius’s law, whose observation is made possible here by the unprecedented combination of low dissipation, time-resolved state control, 98.5% quantum nondemolition single shot measurement fidelity, and complete microwave control over all Hamiltonian parameters in the quantum regime. Direct applications to quantum computation and simulation are discussed.

  • Figure
  • Figure
  • Figure
  • Figure
  • Figure
  • Figure
  • Figure
7 More
  • Received 28 December 2022
  • Revised 18 May 2024
  • Accepted 9 July 2024

DOI:https://doi.org/10.1103/PhysRevX.14.031040

Published by the American Physical Society under the terms of the Creative Commons Attribution 4.0 International license. Further distribution of this work must maintain attribution to the author(s) and the published article’s title, journal citation, and DOI.

Published by the American Physical Society

Physics Subject Headings (PhySH)

Quantum Information, Science & TechnologyCondensed Matter, Materials & Applied Physics

Focus

Key Image

New Quantum Effect in Textbook Chemistry Law

Published 3 September 2024

The observation of quantum modifications to a well-known chemical law could lead to performance improvements for quantum information storage.

See more in Physics

Authors & Affiliations

Nicholas E. Frattini*,†, Rodrigo G. Cortiñas*,‡, Jayameenakshi Venkatraman, Xu Xiao, Qile Su, Chan U. Lei, Benjamin J. Chapman, Vidul R. Joshi, S. M. Girvin, Robert J. Schoelkopf, Shruti Puri, and Michel H. Devoret§

  • Department of Applied Physics and Physics, Yale University, New Haven, Connecticut 06520, USA

  • *These authors contributed equally to this work.
  • Contact author: nick@nordquantique.ca
  • Contact author: rodrigo.cortinas@yale.edu
  • §Contact author: michel.devoret@yale.edu

Popular Summary

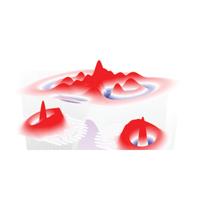
A prototypical model in quantum mechanics is that of a massive particle in a symmetric double-well potential. The rate at which the particle moves from one well to the other is important for multiple applications, including predicting the rate of nuclear reactions as well as the decoherence rate of quantum information stored in such a system for quantum computation. However, experimentally tuning the double-well potential and preparing excited quantum states in it is difficult. Here, we realize an experimental platform that does just that.

Our prototypical double-well system consists of a quantum electromagnetic oscillator in which photons attract each other while subjected to a squeezing interaction (generating pairs of photons). By measuring the spectrum of the system up to ten excited states, we find that, as the squeezing strength is increased, the spectrum of the anharmonic oscillator morphs into pairs of degenerate states—a signature of tunneling in a double-well potential. We also observe that the coherence lifetime of the ground-state manifold increases in steps as the squeezing strength increases. This brings to light a new effect of general interest: the quantum regime of Arrhenius’s law, which describes thermal activation across a barrier.

Our results reveal how out-of-equilibrium quantum circuits can create new control mechanisms in quantum computation and simulation, showcasing an experimental test bed. Furthermore, the strongly enhanced coherence times along with the fast quantum control and high-fidelity readout leave our system poised for implementation in proposed quantum computing architectures.

Key Image

Article Text

Click to Expand

References

Click to Expand
Issue

Vol. 14, Iss. 3 — July - September 2024

Subject Areas
Reuse & Permissions
Author publication services for translation and copyediting assistance advertisement

Authorization Required


×

Images

  • Figure 1
    Figure 1

    Implementation of the squeeze-driven Kerr oscillator. (a) Rendering of the half-aluminum, half-copper sample package containing two sapphire chips, each with a SNAIL transmon, readout resonator, and Purcell filter (see Ref. [88]). Only one chip is used in the present work. Applying a strong microwave drive at ωd2ωa transforms the SNAIL-transmon Hamiltonian into a squeeze-driven Kerr oscillator. (b) Schematic of the SNAIL transmon: A two-SNAIL array serves as the nonlinear element. The capacitor pads are shifted with respect to the axis of the array to couple it to the readout resonator. (c) Scanning electron micrograph of the two-SNAIL array. The SNAIL loops are biased with an external magnetic flux Φ/Φ0=0.33, where Φ0 is the magnetic flux quantum. (d) Metapotential (gray) of the squeeze-driven Kerr oscillator static-effective Hamiltonian Eq. (2) for ε2/K=8.5. Wigner functions of the first seven eigenstates are shown. The highly nonlinear double-well structure hosts three pairs of degenerate eigenstates. The arrows represent incoherent jumps causing a well-occupation flip from right to left. (e) Wigner functions of the even and odd superpositions of the two degenerate ground coherent states of (d), the Kerr-cat qubit |±Z=|Cα± states.

    Reuse & Permissions
  • Figure 2
    Figure 2

    QND measurement and quantum jumps. (a) Top and middle: histogram of the readout resonator output field when performing 2.5×10⁸ measurements after preparation in |±α with a previous, stringently thresholded measurement with a bias of 6.5 standard deviations (σ). Bottom: corresponding probability distribution along the I quadrature, and Gaussian fits (solid lines) with standard deviation used to scale the axes. Applying a fair (unbiased) threshold represented by the dashed vertical line yields a readout infidelity of 0.46%. All data shown here are for ε2/K=10.7. (b) Pulse sequence to performing repeated measurements, each with a duration of 4.44μs. (c) Example quantum jump trajectories (gray) under repeated measurements. Averages of trajectories conditioned on the first measurement of |±α (green and orange) fit together with single exponentials (black line) with decay time TXjumps=(485±1)μs. (d) State lifetime for |±α (green and orange) with no intermediate measurements (free decay). Black lines are a single-exponential fit with decay time TX=(482±4)μs.

    Reuse & Permissions
  • Figure 3
    Figure 3

    Spectroscopic fingerprint of the squeeze-driven Kerr oscillator and coherence of the ground-state manifold. (a) Spectroscopy data taken with the pulse sequence in (b). While applying a squeezing drive with swept amplitude ε2/K(=|α|2), we perform spectroscopy by scanning ωpr. Color denotes probability Ps that both measurements give the same result. A low Ps means a transition has occurred between the readout pulses. For |α|2<0.3, the measurement is not QND and thus yields a poor contrast. (c) Purple open dots are the extracted resonances from (a). Black dashed lines are a parameter-free diagonalization of H^SK. Gray vertical lines indicate the number of levels per Hamiltonian well using quantization calculated by phase-space area (see Appendix pp6). (d) Coherent state lifetime TX (black circles) as a function of squeezing amplitude, measured by fitted single-exponential decay timescale from experimental pulse sequences in (b) (without spectroscopy probe). Solid lines are extracted from fits to time-dependent master equation simulations including phenomenological parameters that emulate coupling to a photon bath at rate κ1 with nonzero temperature nth (colors), and low-frequency detuning noise (see Appendix pp7). (e) The cat-state—equally weighted superpositions of |±α—lifetime (TYZ, blue open dots) as a function of its size (|α|2), measured with the Ramsey-like pulse sequence in (f). The solid line inside the gray band is the prediction with no free parameters.

    Reuse & Permissions
  • Figure 4
    Figure 4

    Global error protection and large error bias cat qubits. (a) Pulse sequence for measurement of TX coherent state lifetime in (c) and (e). (b) Pulse sequence for measurement of TYZ cat-state lifetimes in (d). (c),(d) Kerr-cat qubit operating at Δ=0 and ε2/K=1.85 where average coherence surpasses that of the bare system. (c) Green and orange data for preparation in |±α and black lines are single-exponential fits with decay time T+X=(101±4)μs and TX=(103±4)μs. (d) Cat-state coherences for the two parityless cats (top, yellow and pink) and for the even and odd parity cats (bottom, red and blue). Black lines are single-exponential fits with T+Y=(5.9±0.2)μs, TY=(6.5±0.2)μs, and T+Z=(6.1±0.1)μs, TZ=(6.2±0.4)μs, respectively. (e),(f) Operation point with drive detuning Δ/2π=4.5MHz and ε2/K=8.9 implying a mean photon number of 15. (e) Lifetime measurement for |±α (green and orange). The black line is an exponential fit with timescale T±X=(1.102±0.008)ms. (f) Oscillations between cat states as a function of single-photon drive time and phase [pulse sequence as in Fig. 3]. Fits of the line cut at zero phase yield a coherent oscillation with decay time of TYZ=(0.76±0.08)μs.

    Reuse & Permissions
  • Figure 5
    Figure 5

    The adiabatic mapping of the Kerr-cat qubit Bloch sphere to the Fock encoding. The logical states in the Kerr-cat qubit and their parity conserving adiabatic mapping to the two-level transmon Bloch sphere.

    Reuse & Permissions
  • Figure 6
    Figure 6

    Measurement calibration and robustness to readout power. (a) Pulse sequence for readout drive amplitude calibration experiment [see (b) and (c)]. Preparing the Fock qubit on the equator of the Bloch sphere (squeezing drive off), a readout pulse at ωBS=ωbωa implements a fluorescence readout. (b) Example time trace of readout resonator output field recorded as a heterodyne signal after amplification. Black lines are fits to extract beam-splitter strength gBS. (c) Extracted gBS (green circles) as of function of readout pulse amplitude fit to a line (black) with no offset. (d) Pulse sequence for repeated measurement as in main text, where again ωBS=ωbωd/2. (e)–(g) Fidelity, QNDness, and decay time during repeated measurements, respectively, as a function of readout drive amplitude for three different squeezing drive strengths on resonance. Lines connecting points are a guide to the eye.

    Reuse & Permissions
  • Figure 7
    Figure 7

    Bias robustness during gate operation. (a) Pulse sequence to measure TX in the presence of a strong cat Rabi drive at frequency ωd/2 with amplitude εx and phase set to zero to drive cat Rabi oscillations at rate Ωx=Re{4εxα*}. (b) The coherent state lifetime TX is unaffected by the strong Rabi drive. The two sets of points corresponds to a coherent state of |α|2=10 (Δ/2π=0, orange) and |α|2=15 (Δ/2π=4.5MHz, blue).

    Reuse & Permissions
  • Figure 8
    Figure 8

    Bohr quantization of the squeezed Kerr oscillator. (a) Equienergy contours of HSKcl describing Cassinian oval orbits, including a lemniscate of Bernoulli (red) taken for Δ=0. (b) Quantum spectrum of the squeezed Kerr oscillator and (c) the energy gap in between kissing eigenenergies as a function of the squeezing drive amplitude. (d) The point of maximal rate of approach is defined as the kissing point and determined by the inflection point in the energy gaps. These are marked as blue dots in (b). (e) Comparison in between the quantum Hamiltonian treatment and Bohr’s quantization semiclassical argument.

    Reuse & Permissions
  • Figure 9
    Figure 9

    Cat Rabi as a calibration tool. (a) The experimental sequence used to perform Rabi oscillations in between oscillator states. (b) We show 15 of the 101 cat Rabi oscillations, each for a different squeezing amplitude. The frequency of the oscillation is directly proportional to the square root of the cat size and the decoherence constant is inversely proportional to it. (c) Fit of the cat Rabi frequency as a function of the voltage control parameter. (d) Inverting the formula for the Rabi frequency we measure directly the average number of photons n¯ in the ground state of the metapotential, which is equivalent to average number of photons in the parityless Yurke-Stoler (YS) cats.. (e) Measurement of the cat-state lifetime. The solid line is a parameter-free theory prediction with shaded error bars correspondng to the experimental uncertainty on the independently measured single-photon lifetime.

    Reuse & Permissions
  • Figure 10
    Figure 10

    The Yurke and Stoler experiment as a calibration tool. (a) The experimental sequence of pulses allowing for the observation of the phase collapse and the phase revival in free Kerr oscillator. At times equal to π/qK the system is in a q-legged Schrödinger cat state. (b) The signal corresponds to the mean vale of the operator X^|+α+α||αα| [cf. Eq. (b4)] achieving maximal revival at π/K. For large cats the periodicity of the signal is lost due to decoherence (see Ref. [140]). (c) Fitting the cat size over the free Kerr evolution signal provides an efficient calibration of the drive parameters which is consistent with that obtained from the cat Rabi experiments discussed in Fig. 9. (d) The revival is expected at π/K independently of the cat size and thus fitting the signals in (b) provides a good calibration for the Kerr parameter K. It is found to be K320kHz in agreement with independently performed spectroscopic experiments (see main text). (e) The fitted effective dissipation rate as a function of the cat size. We find a nontrivial dependence on the dissipation rate for larger cats. This suggests an effective heating of the setup for the larger squeezing amplitudes.

    Reuse & Permissions
  • Figure 11
    Figure 11

    (a) Numerical simulations in absence of phase noise (κϕ=0) for a set of different thermal populations. The steps in the coherence state lifetime originated by the discretization of phase-space orbits are apparent. (b) The lifetime study is performed in presence of white phase noise for a range of temperatures keeping the coherent state lifetime in the region of interest. (c) The lifetime study is performed in absence of thermal photons for a set of white phase-noise amplitudes. (d) For a given temperature, the effect of different phase-noise amplitude is compared. (e) Experimental data compared with a sample of Markovian noise models. (f) The low |α|2 behavior of the data is reproduced by a non-Markovian toy model including low-frequency components in the fluctuations of the Hamiltonian term Δa^a^ [see Eq. (1) in the main text].

    Reuse & Permissions
  • Figure 12
    Figure 12

    Tunnel splitting for H^SK. |ψ0+ and |ψ0 are exactly degenerate. The nth excited-state manifold has tunnel splitting δnδnn+=ωn+ωn<δn+1.

    Reuse & Permissions
  • Figure 13
    Figure 13

    Spectral fingerprint of the RWA Lindbladian on the coherent state lifetime. (a) Comparison between exact and approximate coherence time of |X using L and Leff(γ). Orange dots: coherence time extracted from Lindbladian time evolution initialized in state |XX|. Solid blue line: [Re(λ)]1 where λ is the eigenvalue of L with the smallest nonzero real part. Solid green line: [Re(λ˜)]1 where λ˜ is the eigenvalue of the 2γ×2γ matrix Leff(γ) with the smallest nonzero real part, and γ=1. Solid red line: γ=2. Dashed black line: γ=3. (b) Comparison of TX(γ) in presences and absences of tunnel splittings. The lifetime in the absences of tunnel splittings is derived from LD(γ). Black line: extracted from Leff(γ) with γ=8. Blue line: with γ=4. Gray lines: extracted from LD(γ) with γ=1,2,3,,8 from bottom to top. In both figures, κ1/K=0.025 and nth=0.01. Red dashed line: fit of the black line restricted to |α|2>6.

    Reuse & Permissions
  • Figure 14
    Figure 14

    The emergence of the Arrhenius law from quantum mechanics. As the dissipation overcomes the nonlinearity, the quantum features disappear, and the classical Arrhenius exponential law emerges from the staircase in TX vs ε2/K. The temperature was kept constant at nth=0.05. The interplay of macroscopicity, nonlinearity, and dissipation determines the quality of the classical treatment.

    Reuse & Permissions
×

Sign up to receive regular email alerts from Physical Review X

Reuse & Permissions

It is not necessary to obtain permission to reuse this article or its components as it is available under the terms of the Creative Commons Attribution 4.0 International license. This license permits unrestricted use, distribution, and reproduction in any medium, provided attribution to the author(s) and the published article's title, journal citation, and DOI are maintained. Please note that some figures may have been included with permission from other third parties. It is your responsibility to obtain the proper permission from the rights holder directly for these figures.

×

Log In

Cancel
×

Search


Article Lookup

Paste a citation or DOI

Enter a citation
×