Location via proxy:   [ UP ]  
[Report a bug]   [Manage cookies]                
  • Open Access

Single-Atom Trapping in Holographic 2D Arrays of Microtraps with Arbitrary Geometries

F. Nogrette, H. Labuhn, S. Ravets, D. Barredo, L. Béguin, A. Vernier, T. Lahaye, and A. Browaeys
Phys. Rev. X 4, 021034 – Published 23 May 2014

Abstract

We demonstrate single-atom trapping in two-dimensional arrays of microtraps with arbitrary geometries. We generate the arrays using a spatial light modulator, with which we imprint an appropriate phase pattern on an optical dipole-trap beam prior to focusing. We trap single Rb87 atoms in the sites of arrays containing up to approximately 100 microtraps separated by distances as small as 3μm, with complex structures such as triangular, honeycomb, or kagome lattices. Using a closed-loop optimization of the uniformity of the trap depths ensures that all trapping sites are equivalent. This versatile system opens appealing applications in quantum-information processing and quantum simulation, e.g., for simulating frustrated quantum magnetism using Rydberg atoms.

  • Figure
  • Figure
  • Figure
  • Figure
  • Figure
  • Figure
  • Figure
3 More
  • Received 21 February 2014

DOI:https://doi.org/10.1103/PhysRevX.4.021034

This article is available under the terms of the Creative Commons Attribution 3.0 License. Further distribution of this work must maintain attribution to the author(s) and the published article’s title, journal citation, and DOI.

Published by the American Physical Society

Authors & Affiliations

F. Nogrette, H. Labuhn, S. Ravets, D. Barredo, L. Béguin, A. Vernier, T. Lahaye, and A. Browaeys

  • Laboratoire Charles Fabry, UMR 8501, Institut d’Optique, CNRS, Univ Paris Sud 11, 2 avenue Augustin Fresnel, 91127 Palaiseau cedex, France

Popular Summary

Optical tweezers, invented more than 30 years ago, are essentially very tightly focused laser beams that are used to trap and manipulate small particles such as polymer beads, living cells, and even laser-cooled atoms. Based on a careful choice of experimental parameters, it is possible to ensure that a single atom can be trapped in the tweezers, which opens up exciting new perspectives for the engineering of quantum systems. Using the strong interactions existing between Rydberg atoms—highly excited atoms in which an electron orbits far away from the nucleus—results have recently shown that it is possible to create entangled states of two neutral atoms. Extending these demonstrations to a larger number of atoms is currently an active area of research; an experimentally appealing technique is generating large arrays of optical tweezers for single-atom trapping.
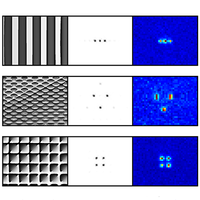
We demonstrate the trapping of single Rb87 atoms in two-dimensional arrays of optical tweezers containing up to 100 traps separated by as few as 3 microns. These arrays are generated using a spatial-light modulator to imprint an appropriate phase on the trapping laser. The array is produced at the focal point of a large numerical-aperture lens and is the diffraction pattern of the imprinted phase. The setup allows for the creation of almost arbitrary geometries of arrays of tweezers, including squares, triangles, and honeycombs. We take full advantage of the reconfigurable spatial-light modulator to ensure the quality of the arrays by compensating for optical aberrations and by using a closed-loop optimization of the uniformity of the tweezers’ depths over the array. We are able to reduce the variation in trap depth, ensuring that the trap depths are neither too low (translating into poor trapping probabilities) nor too high (opening up the possibility that more than one atom will be trapped simultaneously). The total power required for the traps is on the order of mW, well within feasible experimental bounds.

Arrays of optical tweezers make it possible to investigate the physics of ultracold atoms in reconfigurable arrangements without having to rely on traditional optical lattices.

Key Image

Article Text

Click to Expand

References

Click to Expand
Issue

Vol. 4, Iss. 2 — April - June 2014

Subject Areas
Reuse & Permissions
Author publication services for translation and copyediting assistance advertisement

Authorization Required


×

Images

  • Figure 1
    Figure 1

    Generation of an array of microtraps for single-atom trapping. The SLM imprints the calculated phase pattern φ(x,y) on the 850-nm dipole-trap beam. A high-numerical-aperture aspheric lens under vacuum focuses it at the center of a MOT. The intensity distribution in the focal plane is |FT(A0eiφ)|2, where A0 is the initial Gaussian amplitude profile of the 850-nm beam and FT stands for Fourier transform. The atomic fluorescence at 780 nm is reflected off a DM and detected using an EMCCD camera. A second aspheric lens (identical to the first one) recollimates the 850-nm beam. This transmitted beam is used for trap diagnostics (either with a diagnostics CCD camera or a SH wave-front sensor).

    Reuse & Permissions
  • Figure 2
    Figure 2

    A gallery of microtrap arrays with different geometries. For each panel, we show the calculated phase pattern φ used to create the array (left), an image of the resulting trap arrays taken with the diagnostics CCD (middle), and the average of approximately 1000 fluorescence images of single atoms loaded into the traps (right).

    Reuse & Permissions
  • Figure 3
    Figure 3

    Single-atom trapping in a 3×3 array. (a) Image of the traps, separated by 4μm, obtained with the diagnostics CCD camera. (b) Sample fluorescence images of single atoms trapped in the array. The exposure time is 50 ms. (c) Photon counts per 50 ms at the pixels corresponding to each of the nine trap positions, as a function of time. The random, telegraphlike signal with only two fluorescence levels is the signature of single-atom trapping. (d) Histogram of the occurrences of images with n atoms trapped (with 0n9) over a set of approximately 2500 images. The red dots correspond to the binomial distribution [Eq. (1)] with p=0.53.

    Reuse & Permissions
  • Figure 4
    Figure 4

    Pupil conjugation. (a) Without a telescope, for a given field y0, the dipole-trap beam is clipped and not centered on the aspheric lens. (b) The implemented telescope adapts the size of the beam to the aspheric lens pupil; by conjugating the SLM aperture to the entrance pupil of the aspheric lens, the beam is well centered, whatever the field.

    Reuse & Permissions
  • Figure 5
    Figure 5

    The Gerchberg-Saxton algorithm. The field in the lens focal plane is calculated by the FFT of the complex field in the SLM plane. If the obtained intensity |Anf|2 does not match the target intensity It, another iteration must be performed: The amplitude of the field in the focal plane is forced to the target amplitude It, and this new field is propagated back to the pupil plane by the inverse FFT, resulting in a new amplitude and a new phase φn+1. This new phase is kept as the next SLM phase pattern, while the amplitude is forced to the incident one A0, giving a new input field A0eiφn+1 for the next iteration.

    Reuse & Permissions
  • Figure 6
    Figure 6

    Composition of the phase pattern φtot displayed on the SLM for generating the trap array of Fig. 2. The sum is calculated modulo 2π.

    Reuse & Permissions
  • Figure 7
    Figure 7

    Effect of the Shack-Hartmann correction pattern φSH. A CCD image of 4×4 microtraps is shown (a) only with the factory correction and (b) with both the factory and the Shack-Hartmann patterns applied. (c) Intensity profiles along the dashed lines on (a) and (b), with (blue curve) and without (orange curve) the correction φSH. The arrays are created with the same calculated phase φ. The laser power and the exposure time of the CCD camera are the same for both cases.

    Reuse & Permissions
  • Figure 8
    Figure 8

    (a) Trap depth U0/kB as a function of the trap power, with (blue diamonds) and without (orange disks) Shack-Hartmann correction. With the latter, the trap depth increases by about 50%. (b) Recapture probabilities for an atom oscillating in the trap as a function of the hold time ΔThold. The trap frequency increases by about 30% when the Shack-Hartmann correction pattern is added to the SLM.

    Reuse & Permissions
  • Figure 9
    Figure 9

    Improving the uniformity of trap depths in a 10×10 square array. (a) Histogram of the maximal intensity levels of the microtraps Ii, measured with the diagnostics CCD camera (see the inset), for the trap array obtained after a single use of the GS algorithm and a target image where all traps have the same intensity. The standard deviation is 19%. (b) Same as (a) but after the closed-loop optimization of the uniformity of the trap intensities. The standard deviation is now 1.4%.

    Reuse & Permissions
  • Figure 10
    Figure 10

    Closed-loop algorithm used for improving the uniformity of trap depths. From the various trap intensities measured with the CCD camera (red profile), we calculate a new target intensity It following Eq. (3): The brightest traps are dimmed, while the dimmest ones are enhanced. We then use this adapted target as the input for a new iteration of the GS algorithm, with the previously calculated phase as the initial condition.

    Reuse & Permissions
×

Sign up to receive regular email alerts from Physical Review X

Reuse & Permissions

It is not necessary to obtain permission to reuse this article or its components as it is available under the terms of the Creative Commons Attribution 3.0 License. This license permits unrestricted use, distribution, and reproduction in any medium, provided attribution to the author(s) and the published article's title, journal citation, and DOI are maintained. Please note that some figures may have been included with permission from other third parties. It is your responsibility to obtain the proper permission from the rights holder directly for these figures.

×

Log In

Cancel
×

Search


Article Lookup

Paste a citation or DOI

Enter a citation
×