Location via proxy:   [ UP ]  
[Report a bug]   [Manage cookies]                
  • Featured in Physics
  • Open Access

Rapid Evolution of the Photosystem II Electronic Structure during Water Splitting

Katherine M. Davis, Brendan T. Sullivan, Mark C. Palenik, Lifen Yan, Vatsal Purohit, Gregory Robison, Irina Kosheleva, Robert W. Henning, Gerald T. Seidler, and Yulia Pushkar
Phys. Rev. X 8, 041014 – Published 23 October 2018
Physics logo See Synopsis: Pinning down the Chemistry of Photosynthetic Water Splitting  
PDFHTMLExport Citation

Abstract

Photosynthetic water oxidation is a fundamental process that sustains the biosphere. A Mn4Ca cluster embedded in the photosystem II protein environment is responsible for the production of atmospheric oxygen. Here, time-resolved x-ray emission spectroscopy (XES) is used to observe the process of oxygen formation in real time. These experiments reveal that the oxygen evolution step, initiated by three sequential laser flashes, is accompanied by rapid (within 50μs) changes to the Mn Kβ XES spectrum. However, no oxidation of the Mn4Ca core above the all-MnIV state is detected to precede OO bond formation, and the observed changes are therefore assigned to OO bond-formation dynamics. We propose that OO bond formation occurs prior to the transfer of the final (fourth) electron from the Mn4Ca cluster to the oxidized tyrosine TyrZ residue. This model resolves the kinetic limitations associated with OO bond formation and suggests an evolutionary adaptation to avoid releasing harmful peroxide species.

  • Figure
  • Figure
  • Figure
  • Figure
  • Received 10 May 2018
  • Revised 18 July 2018

DOI:https://doi.org/10.1103/PhysRevX.8.041014

Published by the American Physical Society under the terms of the Creative Commons Attribution 4.0 International license. Further distribution of this work must maintain attribution to the author(s) and the published article’s title, journal citation, and DOI.

Published by the American Physical Society

Physics Subject Headings (PhySH)

  1. Physical Systems
Physics of Living Systems

Synopsis

Key Image

Pinning down the Chemistry of Photosynthetic Water Splitting  

Published 23 October 2018

A time-resolved x-ray study indicates that certain chemical changes of oxygen atoms during photosynthesis occur in a different order than current models predict.

See more in Physics

Authors & Affiliations

Katherine M. Davis1,†, Brendan T. Sullivan1,‡, Mark C. Palenik1,§, Lifen Yan1, Vatsal Purohit1,¶, Gregory Robison1,∥, Irina Kosheleva2, Robert W. Henning2, Gerald T. Seidler3, and Yulia Pushkar1,*

  • 1Department of Physics and Astronomy, Purdue University, West Lafayette, Indiana 47907, USA
  • 2Center for Advanced Radiation Sources, The University of Chicago, Chicago, Illinois 60637, USA
  • 3Department of Physics, University of Washington, Seattle, Washington 98195, USA

  • *Corresponding author. ypushkar@purdue.edu
  • Present address: Department of Chemistry, Princeton University, Princeton, NJ 08544, USA.
  • Present address: Neutron Scattering Division, Oak Ridge National Laboratory, Oak Ridge, TN 37830, USA.
  • §Present address: Naval Research Laboratory, Washington, DC 20375, USA.
  • Present address: Department of Biology, Purdue University, West Lafayette, IN 47907, USA.
  • Present address: Department of Physics and Astronomy, Hanover College, Hanover, IN 47243, USA.

Popular Summary

Society is faced with multiple challenges to energy security including increased energy demand, the scarcity of carbon-based fuels, and climate disruption as a result of using those fuels. Finding new ways of generating clean energy is therefore an imperative. Since green plants already do this with unparalleled efficiency, there is significant interest in echoing photosynthesis in artificial devices. Despite intense efforts from the biophysics community to understand this process on a mechanistic level, the final step remains a matter of speculation. In this work, we use very bright, short laser and x-ray pulses to drive photosynthesis and track electronic transitions through the process.

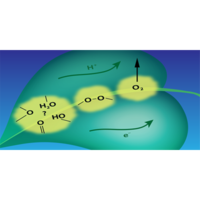
During photosynthesis, green plants use sunlight to extract electrons and protons needed to generate fuel, creating molecular oxygen as a byproduct. The critical step in which two oxygen atoms bond to form O2 is the part that is not understood. Our experiments strongly suggest that this bond forms prior to the transfer of the last electron. We further show that this new catalytic mechanism promotes rearrangement of atoms and the formation of new molecules with the smallest possible waste of energy.

By providing a blueprint for mimicking this biological process, these results will accelerate the development of artificial photosynthesis on a scale large enough to address society’s future energy needs.

Key Image

Article Text

Click to Expand

Supplemental Material

Click to Expand

References

Click to Expand
Issue

Vol. 8, Iss. 4 — October - December 2018

Subject Areas
Reuse & Permissions
Author publication services for translation and copyediting assistance advertisement

Authorization Required


×

Images

  • Figure 1
    Figure 1

    (a) Current model of the Kok cycle. Depiction of sequential incident visible-light photon absorptions triggering electron or proton release [3]. The dashed region is based on previous analysis of the S3-to-S0 transition in which the S4 state is proposed [3, 4]. (b) Electronic transitions, reflected in the Kβ main lines, are influenced by the spin state of the Mn ion. (c) A spectral comparison of Mn oxides depicts the effect of oxidation state on the Kβ emission lines. (d) Nanosecond laser pulses (1, 2, or 3) are used to advance the Kok cycle in the protein (Table S1 [5]). The pump-probe delay time Δt, measured from the final laser flash to the center of the x-ray pulse, is set dependent on the desired S state. X-ray fluorescence from the sample is reflected by ten flat analyzer crystals onto a 2D-position-sensitive detector. Kβ emission spectra are extracted to form snapshots of the electronic structure in time. Smoothed emission spectra are presented for 2F (majority S3) and two time points during the S3-to-S0 transition. (e) The proposed reaction scheme shows the early evolution of the OEC during the S3-to-S0 transition, providing an interpretation of spectroscopic results.

    Reuse & Permissions
  • Figure 2
    Figure 2

    Analysis of the statistical significance for S1S2S3 transitions serves as a proof of concept. (a) Spectral shifts occurring as a result of 0F1F and 1F2F transitions are characterized using 2D heat maps, illustrating the p value (see Table S2 for n [5]) for changes to first moments calculated over the ranges defined by the x and y axes, i.e., start and end energy, respectively. Contours appear in plots comparing 0F1F data indicate a statistically significant difference. By contrast, limited low p-value regions are observed for the 1F2F transition, suggesting a smaller change. The directionality and magnitude of spectral shifts are shown in the final column. These 2D heat maps, which graphically illustrate the change in first moments (ΔFM=FMpostflashFMpreflash) calculated over the ranges defined by the x and y axes. 0F1F and 1F2F transitions are dominated by negative, or oxidative, shifts. An example of statistical noise is presented by randomly dividing a 0F data set and performing the same analysis, e.g., 0F0F. Relevant data from data sets 1–4 are merged to generate the final columns. Note that 0F and 1F data are not collected for data set 4, while data set 5 is collected independently following a beam-line upgrade and is therefore analyzed separately; see Fig. S4 [5]. (b) Wavelet-transform smoothed and background-subtracted emission spectra for merged 0F, 1F, and 2F data. The region (6.485–6.495 keV), over which the first moment is calculated, is highlighted, and a magnified inset as well as difference spectra are presented. Difference spectra are smoothed with a rolling average calculated over 14 points (approximately ±0.7eV). (c) (Top) Average first moments from unprocessed (color) and processed (gray) spectra. Errors are presented as SEM with n given in Table 3. Those moments with a statistically significant difference (p<0.05) from 0F data are indicated with an asterisk. (Bottom) Dot plot of first moments from raw data. Each dot represents a calculated first moment from a thread collected during the beam time corresponding to its color in the legend. Dashed lines represent the average first moment, while solid bars are the 95% confidence interval.

    Reuse & Permissions
  • Figure 3
    Figure 3

    Rapid onset of spectral changes observed during the S3-to-S0 transition. (a) Spectral shifts occurring as a result of the 2F3F transition are characterized using 2D heat maps colored by p value (see Table S2 [5] for n), for changes to first moments calculated over the ranges defined by the x and y axes, i.e., start and end energy, respectively. Strong contours are consistently observed, indicative of a statistically significant spectral change. The directionality and magnitude of spectral shifts occurring with these transitions are also shown as 2D heat maps, which graphically illustrate the change in first moments (ΔFM=FMpostflashFMpreflash) calculated over the ranges defined by the x and y axes. All 2F3F comparisons yield primarily positive, or reductive, shifts. Determined p values of approximately 0.02 (Table 3) for the 200μs time point are further supported by the above heat maps; however, little information can be gleaned from these plots of data set 2, likely due to much lower x-ray shot count; see Table 2. Although the 500μs time point is equally compelling, the traditional energy range (6.485–6.495 keV) selected for reporting first moments does not deliver statistical significance (Table 3). (b) Wavelet transform smoothed and background-subtracted emission spectra for merged 2F, 3F50μs, and 3F200μs data, calculated as in Fig. 2. (c) (Top) Average first moments from unprocessed (color) and processed (gray) spectra. Errors are presented as SEM with n given in Table 3. Those moments with a statistically significant difference (p<0.05) from 2F data are indicated with an asterisk. (Bottom) Dot plot of first moments from raw data, presented as in Fig. 2. See Fig. S3 [5] for 2D plots of the 40 ms (majority S0 state) time point.

    Reuse & Permissions
  • Figure 4
    Figure 4

    Analysis of Mn Kβ first moments. Placement of fully processed 2F and 3F data along a linear fit to a series of Mn oxide first moments empirically predicts the average spin state of Mn centers in the OEC. For reference, relevant Mn coordination complexes are placed along the line by using the nominal spins reported by Davis et al. and Jensen et al. [31, 46]. Note that S4a and S4b correspond to 3F states with Δt between the final laser flash and an x-ray pulse of 50 and 200μs, respectively. Compounds 1–3 are formally mixed valence MnIII/MnIV complexes. 1 is a diμoxo dimer, [Mn2O2L4] (ClO4)3, while 2 and 3 are two examples from the Mn cubane family, Mn4O4L6. Compounds 4 and 5, by contrast, are mononuclear Mn complexes [MnIV(OH)2(Me2EBC)]2+ and [MnIV(O)(OH)(Me2EBC)]+, respectively.

    Reuse & Permissions
×

Sign up to receive regular email alerts from Physical Review X

Reuse & Permissions

It is not necessary to obtain permission to reuse this article or its components as it is available under the terms of the Creative Commons Attribution 4.0 International license. This license permits unrestricted use, distribution, and reproduction in any medium, provided attribution to the author(s) and the published article's title, journal citation, and DOI are maintained. Please note that some figures may have been included with permission from other third parties. It is your responsibility to obtain the proper permission from the rights holder directly for these figures.

×

Log In

Cancel
×

Search


Article Lookup

Paste a citation or DOI

Enter a citation
×