Online Application Guidance for Heterogeneous Memory Systems
Authors:  M. Ben Olson, Brandon Kammerdiener, Michael R. Jantz, Kshitij A. Doshi, and Terry JonesAuthors Info & Claims
Article No.: 45, Pages 1 - 27
Abstract
As scaling of conventional memory devices has stalled, many high-end computing systems have begun to incorporate alternative memory technologies to meet performance goals. Since these technologies present distinct advantages and tradeoffs compared to conventional DDR* SDRAM, such as higher bandwidth with lower capacity or vice versa, they are typically packaged alongside conventional SDRAM in a heterogeneous memory architecture. To utilize the different types of memory efficiently, new data management strategies are needed to match application usage to the best available memory technology. However, current proposals for managing heterogeneous memories are limited, because they either (1) do not consider high-level application behavior when assigning data to different types of memory or (2) require separate program execution (with a representative input) to collect information about how the application uses memory resources.
This work presents a new data management toolset to address the limitations of existing approaches for managing complex memories. It extends the application runtime layer with automated monitoring and management routines that assign application data to the best tier of memory based on previous usage, without any need for source code modification or a separate profiling run. It evaluates this approach on a state-of-the-art server platform with both conventional DDR4 SDRAM and non-volatile Intel Optane DC memory, using both memory-intensive high-performance computing (HPC) applications as well as standard benchmarks. Overall, the results show that this approach improves program performance significantly compared to a standard unguided approach across a variety of workloads and system configurations. The HPC applications exhibit the largest benefits, with speedups ranging from 1.4× to 7× in the best cases. Additionally, we show that this approach achieves similar performance as a comparable offline profiling-based approach after a short startup period, without requiring separate program execution or offline analysis steps.
1 Introduction
Recent market and architectural trends have placed enormous strain on the memory system of modern machines. The popularity of artificial intelligence and other types of data-driven decision making, which often require frequent and detailed analyses of very large datasets, have driven demands for in-memory processing to unprecedented heights. Unfortunately, high energy costs [44] and other technological constraints [37, 54] have limited dynamic random access memory (DRAM) capacity and bandwidth improvements for several product generations. At the same time, CPU core counts still continue to rise, and many applications now rely on multiprocessing for performance scaling. The end result is that the access and allocation demands of the processor have significantly outpaced the capabilities of conventional memory systems.
To address this challenge, many high-end computing systems have begun to incorporate multiple types of memory hardware, distinct from conventional DRAM, within the same compute node. Such heterogeneous memory architectures organize main memory in a hierarchical fashion, where each layer of the hierarchy corresponds to a different memory technology with distinct performance and capacity characteristics. For example, Intel’s latest Xeon processors (codenamed “Cascade Lake”) support access to conventional DRAM as well as non-volatile Optane DC memory within the same address space. While this configuration greatly expands the capacity of main memory, access to the non-volatile tier has limited bandwidth and longer latencies. Other systems, such as the (now defunct) Intel Knights Landing, and many GPU-based platforms package high bandwidth (but lower capacity) memories (commonly known as “on-package” or “die-stacked” RAMs) alongside conventional memory to enable better performance for a portion of main memory. Future memory systems are expected to be even more complex as architectures with three (or more) types of memory and more flexible operating modes have already been announced [14].
Despite their potential benefits, heterogeneous memory architectures present new challenges for data management. Computing systems have traditionally viewed memory as a single homogeneous address space, sometimes divided into different non-uniform memory access (NUMA) domains, but consisting entirely of the same storage medium (i.e., double data rate (DDR)* synchronous DRAM (SDRAM)). To utilize heterogeneous resources efficiently, alternative strategies are needed to match data to the appropriate technology in consideration of hardware capabilities, application usage, and in some cases, NUMA domain.
Spurred by this problem, the architecture and systems communities have proposed a range of hardware and software techniques to manage data efficiently on heterogeneous memory systems. The existing solutions exhibit various advantages, disadvantages, and tradeoffs, with most hardware-based techniques offering more ease of use and software transparency at the expense of flexibility and efficiency, while software-based solutions provide more fine-grained control of data placement (and, thus, better performance) in exchange for additional effort from developers and users. Section 2 provides a more detailed overview of these existing approaches. Unfortunately, there is currently no silver bullet, as the more flexible and more efficient software-based approaches still require significant efforts (and, in many cases, expert knowledge) to be effective.
To fill this gap, we began developing a hybrid data management solution for complex memory systems based on automated application guidance [58, 60]. Our previous approach employs source code analysis and offline architectural profiling to collect information about how applications use different regions in their virtual address space. It also includes a recommendation engine, based on sorting and bin-packing heuristics, to decide which memory tier to use for data allocated during subsequent executions of the same application. While this approach can significantly improve performance for many applications, it still has some significant limitations. Specifically, (1) it requires earlier execution with a representative input to collect information about how the application uses program data objects, and (2) it only provides static placement recommendations and cannot adjust data-tier assignments as application usage shifts.
This work addresses these limitations by extending our previous approach and toolset with online components that are able to collect and apply application-level memory tiering guidance during production execution and without the need for a separate profile run. We evaluate our online approach using high-performance computing (HPC) as well as standard (SPEC CPU) computing benchmarks on an Intel Cascade Lake platform with two tiers of memory: conventional DDR4 SDRAM and non-volatile Optane DC. Our experiments show that our updated toolset can generate effective tiering guidance with very low overhead and typically achieves performance similar to our previous offline profiling-based approach after a short initial startup period. The primary contributions of this work are:
(1)
We extend the Simplified Interface to Complex Memory (SICM)1 runtime with new techniques for profiling memory usage during production execution. For the benchmarks in this study, our approach is able to collect detailed data-tiering guidance with negligible execution time overhead in most cases and less than 10% overhead in the worst case.
(2)
We design and implement an online data tiering solution that leverages this application feedback to steer data allocation and placement across a heterogeneous memory hierarchy. Our approach, inspired by solutions to the classical ski rental problem, only migrates data when the expected cost of doing so is outweighed by the cost of leaving it in place.
(3)
We demonstrate the effectiveness of this approach on a state-of-the-art heterogeneous memory system with both conventional DRAM and large-capacity NVRAM. The results show that it significantly outperforms unguided execution on average and achieves speedups ranging from 1.4× to more than 7× for our selected HPC workloads. Additionally, it attains speedups similar to a comparable offline profiling-based approach after a short startup period.
2 Related Work
2.1 Data Management Strategies for Conventional Systems
Data placement is a long-standing and well-studied problem in computer science. Many prior works have successfully used program profiling and analysis to improve data management across the cache, memory, and storage hierarchies. Some researchers have proposed static techniques with offline profiling and/or source code analysis to allocate hot fields and objects closer together in the heap, thereby improving caching efficiency [9, 28, 33, 42, 65]. Others have combined online profiling with high-level language features, such as object indirection and garbage collection, to enable similar benefits transparently, and in an adaptive runtime environment [11, 12, 25, 26, 27, 67, 71, 74].
A number of other works integrate application-level guidance with physical data management in the operating system and hardware. Some projects developed frameworks to expose kernel resources to applications [7, 20] or to facilitate communication between user- and system-level data management [5, 6, 32, 38]. More recent efforts have combined these cross-layer approaches with automated collection of high-level guidance to address a variety of issues, including: DRAM energy [31, 59], cache pollution [24], NUMA traffic congestion [15], and data movement costs for non-uniform caches [53, 70]. While these works evince some of the benefits of integrating usage feedback during data management, their purposes and goals are very different from this project.
2.2 Data Management Strategies for Heterogeneous Memory Systems
Propelled by the simultaneous growth of data analytics and stalling of conventional DRAM scaling, research interest in alternative memory technologies has grown significantly over the past decade. The shifting landscape has pushed the architecture, systems, and high-performance computing communities to propose new strategies, tools, and techniques for mapping application data across heterogeneous device tiers.
2.2.1 Hardware-managed DRAM Caches.
One common strategy is to exercise the faster, smaller capacity tier(s) as a hardware-managed cache. For example, Intel’s Cascade Lake includes a “memory-mode” option, which applies this approach with DDR4 as a direct-mapped cache to storage class Optane DC memory [29]. While hardware-managed caching provides some immediate advantages, such as software-transparency and backwards compatibility, it is inflexible, often less efficient, and reduces the system’s available capacity.
Some works have proposed architectural strategies to address these issues, for example, by co-locating tags and data in DRAM to increase efficiency [47, 51], keeping track of cache contents in TLBs and page tables to reduce metadata traffic [30, 43, 73], or swapping data lines out of the cache to preserve capacity [13, 68]. Mittal and Vetter provide a modern (2016) survey of this research [52]. In contrast to these works, this work extends and develops techniques to increase efficiency solely through software-driven data placement, without relying on architectural modifications or non-standard hardware. Some recent work has also shown that profile guidance can enhance data management on systems that support hardware-directed caching and OS paging simultaneously but for different portions of their address space [18]. We expect the approach proposed in this work can also boost performance on platforms with such mixed data management options.
2.2.2 Software-directed Heterogeneous Memory Management.
The alternative strategy of software-based data tiering uses either the OS by itself or the OS in conjunction with the application to assign data into different memory tiers, with facilities to allow migrations of data between tiers as needed. Some heterogeneous memory systems also provide APIs that allow applications to control the placement of their data objects through the use of source code annotations [10, 56]. These finer-grained controls enable developers to coordinate tier assignments with data allocation and usage patterns, potentially exposing powerful efficiencies.
Several prior works have integrated software-based data management with program profiling to facilitate the assignment of data to memory tiers. For instance, some prior works integrate coarse-grained architectural profiling with page-level management in the OS [2, 36, 45, 50]. Since these works do not attempt to coordinate tier assignments with application data structures and events, they may be vulnerable to inefficiencies that arise from the high-level software working at cross-purposes from the OS and hardware.
Some other projects employ application-level tools to tag and profile certain data structures, and then use heuristic models to assign objects to the appropriate tier [1, 3, 16, 40, 63, 66]. While these efforts demonstrate that application guidance can be useful for certain usage scenarios, they require manual source code modifications or expensive online detection to attach recommendations to data objects. Several prior works, including our own, have attempted to address this limitation with static and lightweight runtime tools that are able to attach tiering guidance to program data automatically [17, 18, 58, 60, 72]. However, all of these previous works employ offline profiling and analysis to collect information about how the application uses memory and generate only static tier recommendations. In contrast, this project leverages lightweight architectural profiling and novel runtime algorithms to enable automated, feedback-directed data placement with very low execution time overhead. Moreover, it does so without requiring earlier, profiled execution of the same application with representative input.
3 Offline Application Guidance for Heterogeneous Memory Systems
The online data tiering approach described in this work builds upon our earlier efforts to improve application performance on heterogeneous memory systems. Our previous work extended the SICM runtime and API to implement an offline profile-based approach for guiding data placement on multi-level memory systems. This section provides a brief overview of SICM as well as our offline approach, which is called MemBrain.
3.1 Simplified Interface to Complex Memory
The U.S. Department of Energy Exascale Computing Project (ECP) is a large, multi-disciplinary effort with the goal of achieving exaFLOP performance in the supercomputing domain [39, 57]. The SICM is one of the ECP subprojects. It seeks to deliver a simple and unified interface to the emerging complex memory hierarchies on exascale nodes [4, 41, 61]. To achieve this goal, SICM employs two separate interfaces, as shown in Figure 1. The high-level interface delivers an API that allows applications to allocate, migrate, and persist their data without detailed knowledge of the underlying memory hardware. To implement these operations efficiently, the high-level API invokes the low-level interface, which interacts directly with device-specific services in the OS. Our prior work extends both layers of SICM with profiling tools and analysis, as well as new data management algorithms, to enable guided data placement on complex memory platforms [58].
Fig. 1.

3.2 MemBrain: Automated Application Guidance for Hybrid Memory Systems
To automate the conversion of program profiles to tier recommendations for different memory regions, this work adopts a similar strategy as our previous offline approach called MemBrain [60]. MemBrain generates data-tier guidance by associating profiles of memory behavior (such as bandwidth and capacity) with program allocation sites. Each allocation site corresponds to the source code file name and line number of an instruction that allocates program data (e.g., malloc or new) and may optionally include part or all of the call path leading up to the instruction. A separate analysis pass converts the profiles into tier recommendations for each site prior to guided execution. Figure 2 presents an overview of this approach.
Fig. 2.

3.2.1 Converting Site Profiles to Tier Recommendations.
MemBrain includes three options for converting memory usage profiles into tier recommendations for each allocation site.
Knapsack:. The knapsack approach views the task of assigning application data into different device tiers as an instance of the classical 0/1 knapsack optimization problem. In this formulation, each allocation site is an item with a certain value (bandwidth) and weight (capacity). The goal is to fill a knapsack such that the total capacity of the items does not exceed some threshold (chosen as the size of the upper tier), while also maximizing the aggregate bandwidth of the selected items.
Hotset:. The hotset approach aims to avoid a weakness of knapsack, namely, that it may exclude a site on the basis of its capacity alone, even when that site exhibits high bandwidth. Hotset simply sorts sites by their bandwidth per unit capacity and selects sites until their aggregate size exceeds a soft capacity limit. For example, if the capacity of the upper tier is C, then hotset stops adding the sorted sites after the total weight is just past C. By comparison, knapsack will select allocation sites to maximize their aggregate value within a weight upper bound of C.
Thermos:. Since hotset (intentionally) over-prescribes capacity in the upper tier, cold or lukewarm data could potentially end up crowding out hotter objects during execution. The thermos approach aims to address this occasional drawback. It only assigns a site to the upper tier if the bandwidth (value) the site contributes is greater than the aggregate value of the hottest site(s) it may displace. In this way, thermos avoids crowding out performance-critical data, while still allowing large-capacity, high-bandwidth sites to place a portion of their data in the upper-level memory.
4 Online Application Guidance for Heterogeneous Memory Systems
Our earlier approaches for guiding data tiering are limited, because they require a separate, profiled execution of each application (with representative input) and only generate static data-tier recommendations for subsequent program runs. This work addresses these limitations by adapting MemBrain for use as an online and fully automated feedback-directed optimization. Specifically, our updated approach monitors application memory behavior, converts this information into data-tier recommendations and enforces these recommendations to distribute data efficiently across the memory hierarchy, all within a single run of the application.
Realizing this vision required two major extensions to our existing SICM+MemBrain framework: (1) updates to the profiling infrastructure, including new arena allocation schemes and OS instrumentation, to increase the efficiency of collecting and organizing memory usage information, and (2) a new online decision engine that analyzes the profiles of all active memory regions and decides when and how to migrate application data across the available memory hardware. This section presents design and implementation details for these new components.
4.1 Effective Memory Usage Monitoring with Low Overhead
The earlier MemBrain approach attempts to provide memory tier recommendations for the data associated with each program allocation context. To do so, it requires two bits of information for each allocation context: (1) the cumulative resident set size (RSS) of the data it allocates and (2) the usage rate of its data relative to other contexts. To collect this information, it employs an offline profile run where each allocation context is associated with a distinct page-aligned region of virtual addresses, known collectively as an arena. During the profile run, each new data object is allocated to an arena that is unique to its own allocation context. This approach ensures objects from different allocation contexts do not share the same page, which facilitates profile collection.
To estimate the relative access rate of the data in each arena, our profiling tools employ architectural features commonly available in modern processors. Specifically, the profiler uses the Linux perf facility [64] to sample the addresses of data accesses that miss the last level cache. It then maps each sampled address to its corresponding arena and maintains a count of the number of accesses to data in each arena. In this way, the counts comprise a heatmap of the relative usage of each allocation context at the end of the profile run. Additionally, the profiler estimates the maximum resident set size of each allocation context by keeping track of the number of physical pages associated with each arena. For this work, we have updated this mechanism to reduce its overhead, as described in Section 4.1.2.
4.1.1 Hybrid Arena Allocation to Reduce Locking.
While our earlier approach is suitable for offline profiling, it can incur significant execution time overheads (more than 2×, in some cases) and often takes too long to build effective guidance for usage in an online feedback-directed optimization (FDO). On further investigation, we found that most of the execution time overhead is due to thread contention during allocation to shared arena spaces. In our original profiling configuration, all application threads that allocate from the same program context use the same arena, as shown in Figure 3(a). If two or more threads try to allocate from the same context simultaneously, then one thread will acquire a lock and force the other threads to wait while it completes its allocation request. While such locking can degrade the performance of the profile run, the slowdowns can be avoided during subsequent guided executions by using a different arena allocation strategy. In our original offline approach, the guided run creates a unique set of arenas for every program thread (i.e., one arena for each memory hardware tier) to obviate the need for locking, as shown in Figure 3(b).
Fig. 3.

However, this strategy is not feasible for an entirely online approach where profiling is performed alongside guided execution. Moreover, the naïve approach of creating a unique set of arenas for every allocation context for every thread is also not sufficient, because many of the applications that run on complex memory hierarchies employ dozens of threads and reach hundreds or thousands of allocation contexts. Hence, creating thousands of unique arenas for every program thread fragments the address space and reduces spatial locality. It also slows down operations to aggregate and analyze memory usage profiles of each arena, which can also reduce the efficacy of this approach.
To address these issues, we developed a hybrid arena allocation scheme that aims to enable profiling of most application data without the need for locking in most cases. Our approach exploits the observations that (1) most of the lock contention during profiling arises due to frequent allocations of very small data objects and (2) even if they are cold or their usage patterns unknown, such allocations can often be assigned to the smaller, faster tier(s) of memory with little penalty, since they do not require much capacity.
Figure 3(c) presents our hybrid allocation scheme. The allocator for the hybrid scheme creates two sets of arenas: one set of thread private arenas, each of which may contain data created from any allocation context, and another set of arenas shared among all program threads, each of which corresponds to exactly one allocation context. By default, all program data are allocated to the private arena corresponding to the thread that created it. However, the runtime also keeps track of the cumulative size of the data allocated at each allocation context. When the number of active bytes corresponding to a particular context exceeds a predefined and configurable threshold (say, 4 MB), new data created from that context are allocated to the shared arena designated for that context.
In this way, frequent allocations from contexts with smaller capacity requirements can complete without needing to lock a shared resource. Additionally, by choosing an appropriately small threshold, the private arenas will never require much physical capacity and can always be assigned to the smaller, faster tier(s) with little penalty. Hence, the online profiler does not attempt to track the origin of data in the thread private arenas and only profiles the usage of the shared arenas.
4.1.2 System-level Integration for More Effective Capacity Profiling.
Another challenge in adapting the SICM+MemBrain approach for use as an online FDO is that the approach it uses to measure the capacity requirements of each arena can incur significant overheads and is often too slow to be effective. Specifically, our previous approach employed a separate runtime thread to periodically count up the number of resident physical pages using the Linux pagemap facility [62]. There are two main drawbacks to using this approach in an online framework: (1) to prevent the application from modifying addresses as they are read, the profiling thread has to lock each arena as it walks over the heap, and (2) it can be very slow for large applications, because it requires numerous seek and read system calls to collect information about each and every virtual page.
For this work, we developed an alternative strategy that leverages existing data structures and deeper integration with the Linux kernel to enable fast and effective capacity profiling for large-scale applications. Linux organizes the virtual address space of each process into a set of Virtual Memory Areas (VMAs), where each VMA is comprised of a contiguous range of virtual addresses with similar access permissions and other properties. The metadata for each region are kept in a structure called the vm_area_struct, and information regarding each VMA, such as its address range, backing file, and permissions, can be read by applications via the proc interface.
For this enhancement, we extended Linux’s proc interface with facilities for applications to create a new VMA for a given virtual address range, provided that the given range is already part of the process’s virtual address space. Additionally, we added instrumentation in the page fault and page release paths of the Linux memory manager to track the number of resident physical pages corresponding to each VMA.2 To track the RSS of each arena, the application runtime creates new VMAs for each contiguous range of addresses within each arena by writing to the custom proc interface. The online profiling thread then reads from this same proc interface to collect up-to-date counts of the number of resident pages for each VMA (and by extension, each arena).
While this VMA-based implementation is sufficient to demonstrate the benefits of increased coordination between system- and user-level profiling in this work, it has two limitations that could restrict its adoption by the wider community: (1) It requires modifications to the standard Linux kernel and (2) Linux imposes a hard limit on the total number of VMAs for each process (i.e., 65,536).3 Fortunately, some recent Linux features make it possible to implement this approach without either limitation. Specifically, the extended Berkeley Packet Filter (eBPF), which has been supported in Linux since version 4.1, enables users to write and attach custom instrumentation to a live kernel image, without any risk of crashing or hanging system code [22]. In the next iteration of this work, we plan to develop an eBPF tool that addresses these limitations of our current approach. The tool will create a record of each contiguous range of addresses in each user-level arena and will then use system-level instrumentation to track the resident pages within each range.
4.2 Deciding When and How to Migrate Application Data
An important component of any online FDO is how it decides if and when to expend computing resources on program optimization. Optimizing too early can lead to poor optimization decisions due to inaccurate or incomplete profile information. Such premature optimization is especially harmful in the context of this work due to the high cost of migrating data across memory tier boundaries. However, optimizing too late is also harmful, because the program will spend a longer portion of its execution time without the benefit of the optimization. Previous works that use offline profiling or static tier recommendations avoid this dilemma, because the information needed to optimize is readily available at the start of program execution.
To construct an online FDO for data tiering, we express the problem of choosing when to migrate application data as an instance of the classical ski rental problem. The ski rental problem describes a class of optimization problems where, at every time step, one must pay a repeating cost (i.e., renting a pair of skis) or pay a larger one-time cost to reduce or eliminate the repeating cost (i.e., buying a pair of skis). This formulation has been used to solve online problems in a range of domains including just-in-time compilation [8], cache coherence [34], and cloud computing [35]. For this work, we view the problem of whether to move application data across tiers as a choice between continuing to pay the repeating cost of keeping relatively warm data in a slow memory tier and paying the larger cost of remapping application data to a different tier.
Our solution follows the break-even algorithm, which is known to be the best deterministic algorithm for solving the ski rental problem [48]. Algorithm 1 presents pseudocode of our approach. As the application executes, a separate runtime thread counts the total number of memory access samples and number of pages resident on each memory tier in each virtual arena. The runtime then examines this information at regular intervals to determine if and how it should move any data to a different memory tier. For this operation, it first estimates the optimal data-tier assignments for every arena and allocation site using one of the three MemBrain strategies (i.e., knapsack, hotset, or thermos) with the current memory profile (Algorithm 1, line 19). Next, it computes and compares two costs: (1) the rental cost, which is the expected cost of keeping the current data-tier assignments, and (2) the purchase cost, which is the cost of migrating application data to match the MemBrain recommendations.

To compute the rental cost, our approach calculates \( (a) \) the number of data reads that are resolved in the slower memory tier, but which would have been resolved on the faster memory if the optimal data-tier assignments were enforced, as well as \( (b) \) the number of reads resolved in faster memory that would have been resolved in slower memory with the recommended data placement. The runtime can estimate these values online by scaling the relevant sample counts in the current profile by the sample period. If \( (a) \) is greater than \( (b) \) , then the application is currently paying a repeating cost to keep its data in a suboptimal tiering configuration. To calculate the magnitude of this repeating cost, our approach multiplies \( (a - b) \) by the average additional execution time cost of each read from the slower memory tier (Algorithm 1, line 12). For example, on our experimental platform, the average read latency of the Optane DC tier is about 300 ns longer than the DDR4 SDRAM memory tier [29]. Thus, the rental cost is calculated as \( (a - b) * 300 \) ns.
The application can remove this repeating cost for subsequent program intervals by paying the one-time purchase cost of migrating data between tiers to match the (expected) optimal configuration. To estimate this purchase cost, the runtime computes the number of pages of data it would need to move to enforce the optimal tier recommendations and multiplies this value by the average rate with which the platform is able to migrate data between tiers (Algorithm 1, line 13). On our Linux-based platform, we found that moving data between tiers (via the move_pages system call) requires about 2 \( \mu \) s for each 4-KB page. Thus, we estimate the purchase cost as 2 \( \mu \) s times the total number of pages that would move if the tier recommendations were to be enforced.
At each decision interval, the runtime simply compares the rental and purchase costs (Algorithm 1, line 21). If the cumulative rental cost ever exceeds the purchase cost, then the current data-tier recommendations are enforced. Specifically, any arenas that are mapped to the faster tier and that contain relatively cold program data will first be remapped to the slower tier to make space for the hotter data. Next, arenas with relatively warm program data residing in the slower tier will then be remapped to the faster tier. Additionally, the runtime updates a side table with the current site-tier assignments to ensure accurate bookkeeping going forward.
Before completing the interval, the runtime may optionally reset or re-weight the profile information to gradually forget older intervals and enable faster adaptation to new memory behavior. However, in our current implementation, profile information is never reset or re-weighted. Memory access samples always accumulate over time, and capacity estimates are updated instantaneously as the application maps and unmaps physical memory in its address space. We have found that this configuration tends to work well for applications with relatively stable memory usage patterns, including most of the memory-intensive applications we used for this study.
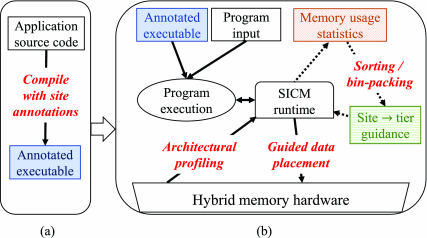
4.3 Summary of Online Approach
Figure 4 shows an overview of our online approach. The online approach still employs compiler analysis to annotate each allocation instruction, and potentially several layers of function call context, with a unique identifier. Once the annotated executable has been built, the profile-guided data tiering process is entirely automatic. During program execution, the custom runtime collects memory usage information, converts it to tier recommendations for the application’s allocation sites and existing program data, and enforces these data-tier recommendations, all within the same program run, and without any need for additional input or direction from the user.
Fig. 4.
5 Experimental Setup
5.1 Platform Details
Our evaluation platform contains a single Intel Xeon Gold 6246R processor (codenamed “Cascade Lake” or CLX) with 16 compute cores, each running with a clock speed of 3.4 GHz, and a shared 35.75 MB L3 cache. The processor includes a memory controller that services requests to both DDR4 SDRAM as well as Optane DC persistent memory through a common memory bus. The bus is divided into six identical channels, each of which is connected to one 32 GB, 2933 MT/s, DDR4 DIMM and one 128 GB, 2666 MT/s, Optane DC module. Thus, the system contains a total of 192 GB of DDR4 SDRAM and 768 GB of Optane DC persistent memory. Data reads from the persistent memory require 2× to 3× longer latencies and sustain only 30% to 40% of the bandwidth of the DDR4 memory. While latency for writes is similar for both types of memory, the DDR4 also supports 5× to 10× more write bandwidth than the Optane memory [29].
We installed Debian 10 with Linux kernel version 5.7.2 as the base operating system. For all software-based tiering configurations (i.e., first touch, offline, and online), we used system configuration tools (e.g., daxctl, ndctl, etc.) to assign the DDR4 and Optane device tiers to separate NUMA nodes. This configuration allows applications and system software to track and modify allocations to each type of memory using the standard NUMA API [38].
5.2 Workloads
Our evaluation employs applications from two popular sets of benchmark programs: CORAL [46], which includes several widely used HPC applications and proxy applications, and SPEC CPU 2017 [69], which is comprised of a variety of industry standard applications for stressing processor and memory performance. From CORAL, we selected three proxy applications (LULESH, AMG, and SNAP) and one full-scale scientific computing application (QMCPACK) based on their potential to stress cache and memory performance on our platform. To study the impact of online tiering guidance with more varied inputs and capacity requirements, we also constructed and evaluated three separate input sizes for each CORAL application. The top part of Table 1 provides descriptions and relevant usage statistics for each CORAL application-input pair included in this study.
Table 1.

Table 1. Workload Descriptions and Statistics
The columns on the right show the # of allocation sites reached during execution, as well as the execution time and peak resident set size (in GB) of each benchmark with the default (unguided first touch) configuration. The CORAL table also shows the arguments that were used to construct the different inputs for each workload as well as the absolute figure of merit (FoM) for the default configuration. All experiments with the SPEC CPU 2017 benchmarks use the standard ref program input.
The benchmarks in SPEC CPU 2017 are designed to test a variety of system behavior and include several single-threaded and CPU-bound applications as well as multi-threaded and memory intensive programs. For this study, we focused our evaluation on multi-threaded floating point (FP) benchmarks that provide the option to distribute their processing over a configurable number of application threads through the use of OpenMP directives.4 When configured to use larger numbers of software threads, these FP workloads tend to have higher memory bandwidth requirements and thus magnify the importance of data placement on our platform. The bottom part of Table 1 provides descriptions and other relevant usage statistics for our selected SPEC CPU benchmarks. All of our experiments with these benchmarks use the standard ref program input.
5.3 Common Experimental Configuration
All applications were compiled using the LLVM compiler toolchain (v. 7.1.0) with default optimization settings and -march=x86_64. C/C++ codes use the standard clang frontend, and Fortran codes are converted to LLVM IR using Flang [55]. All guided and non-guided configurations use SICM with the unmodified jemalloc allocator (v. 5.2.0) with oversize_threshold set to 0, background_thread set to true, and max_background_threads set to 1.5 To prepare executables for guided execution, we configure the compilation pass to clone up to three layers of call path context to each allocation site. Our previous work has shown that this amount of context is sufficient to obtain the benefits of this approach for most applications [19, 60].
For the default and offline configurations, each benchmark is configured to use 16 software threads to match the number of cores on our experimental platform. The offline configuration always uses the same program input for the profile and evaluation runs. The online configuration, as well as the profile run of the offline configuration, creates only 15 software threads for each application, because they require an additional runtime thread to profile and periodically enforce data-tier recommendations. We tested the alternative strategy of over-provisioning compute resources by running 16 application threads alongside this extra thread and leaving it to the system scheduler to resolve conflicts for computing cores. However, we found that this approach consistently produced much worse performance than the 15-thread configuration with our benchmarks.
To reduce sources of variability between runs, all of our experiments execute each application in isolation on an otherwise idle machine. Prior to each experimental run, an automated script clears out the Linux page cache and disables transparent huge pages for the application process.
To estimate the usage rate of each site, the offline and online profilers use the Linux perf [64] facility to sample memory reads from the target application that miss the last-level processor caches. Specifically, we sample MEM_LOAD_L3_MISS_RETIRED event on our platform with a PEBS reset value of 512. We also compute the resident set size for each site by counting the number of active (4-KB) pages associated with the site’s corresponding VMA, as described in Section 4.1.2.
For the online approach, we experimented with a number of interval lengths for analyzing profile information and migrating program data (i.e., the IntervalTime parameter in Algorithm 1), including: 0.1 seconds, 1 second, 10 seconds, and 100 seconds. We found that relatively short intervals of 1 second or less were more sensitive to shifts in memory usage but also incurred higher overheads due to more frequent interruptions and data migrations. Of the interval lengths we tested, 10 seconds provided the best balance of relatively low migration overheads with relatively quick convergence to a good data-tiering configuration and provided the best overall performance for the applications we tested. Hence, all of our online results in the next section use an interval length of 10 seconds.
Additionally, we configured the hybrid arena allocator to promote an allocation context to its own thread-shared arena after it allocates more than 4 MB of data (in total) to the thread-private arenas. With this configuration, all of our benchmarks allocate the vast majority of their data objects to the shared arenas. Specifically, the peak capacity of the private arenas is no more than a few MBs in all but two benchmarks (621.wrf_s and 627.cam4_s). In the worst case of 627.cam4_s, the peak RSS of the private arenas is 0.3 GBs.
Last, in previous works with offline guided data tiering, we have found that the thermos approach is the most effective approach for converting profile information to memory tier recommendations [58, 60]. Hence, in this work, all of the offline and online guided data tiering configurations use thermos to partition the allocation sites into sets for the faster and slower memory tiers.
5.4 Reporting Details
Aside from the results showing profile overhead, which use execution time, all performance measurements for each configuration and application are presented as throughput. For the CORAL benchmarks, we report the application-specific figure of merit, which, for our selected benchmarks, is always a measure of throughput. For SPEC CPU 2017, we report time per operation (i.e., the inversion of wall clock execution time) for each benchmark run.
Except for the CORAL benchmarks with large and huge input sizes, all results are reported as the mean average of five experimental runs relative to the default configuration. The larger CORAL inputs often require multiple hours for even a single run, and so we only conducted one run of each to limit computing time. For experiments with multiple runs, we estimate variability and significance of our results by computing the 95% confidence intervals for the difference between the mean results of the experimental and default configurations, as described in Reference [23]. These intervals are plotted as error bars around the sample means in the relevant figures. However, it is important to note that variability is too low for these bars to be visible in some figures.
6 Evaluation
6.1 Online Profile Overhead
6.1.1 Execution Time Overhead.
Let us first consider the performance overhead of collecting memory usage information during program execution. For this evaluation, we compare the previous offline profiling approach and our online profiling enhancements described in Section 4 (but without any data migration mechanisms) to a default configuration. In the default configuration, each benchmark program is configured to use 16 application threads (one for each hardware thread on our evaluation platform) and the unmodified jemalloc allocator with default execution options. In contrast, each profile configuration uses only 15 program threads and an extra thread to conduct all profiling operations. For presentation purposes, this section omits detailed results for the CORAL benchmarks with the large and huge input sizes.
Figure 5 shows the execution time overhead of the previous offline and current online profiling mechanisms relative to the default configuration. In addition to the two profiling configurations, we also tested two other configurations to isolate the impact of using one less application thread as well as the effect of the hybrid arena allocation strategy described in Section 4.1.1. The default-15 configuration is identical to the baseline but uses only 15 application threads. Hybrid arenas uses our custom allocator to apply the hybrid arena allocation strategy and also uses only 15 application threads but does not collect any profile information.
Fig. 5.

The results show that using one less application thread to reserve one core for profiling only has a marginal impact for these workloads on our 16-core processor. Overall, both the CORAL and SPEC sets run about 4% slower with one less thread, on average, with a worst-case slow down of 10% for SNAP. The hybrid arena allocator has a mixed effect. In some cases, such as SNAP and QMCPACK, this approach actually improves performance over the default allocator. However, for some SPEC benchmarks, such as 627.cam4_s and 638.imagick_s, it can cause significant slow downs. On average, and in comparison to the default-15 configuration, the hybrid allocator improves performance by 3% for the CORAL benchmarks, and degrades performance by 6% for SPEC.
We also find that the new online profiler, which includes the hybrid arena allocator and more efficient RSS accounting, significantly outperforms the previous offline profiling approach. On average, execution with the online profiler is 8% faster with the CORAL benchmark set and 26% faster with SPEC compared to the offline profiling approach. Relative to the default configuration with no online profiling and an extra application thread, the online profiler adds 5% and 14% execution time overhead for CORAL and SPEC, respectively. If the system includes at least one free computing core to run the profile thread, then the overhead is even lower. Specifically, in comparison to the default-15 configuration, the online profiler adds \( \lt \) 1% and \( \lt \) 10% execution time cost, on average, for the CORAL and SPEC benchmark sets, respectively.
In most cases, the execution time cost is due to the use of the alternative arena allocation strategy during profiling. Indeed, comparing the online profiler and hybrid arenas configurations directly shows that enabling the memory access and RSS tracking adds only about 3.5% overhead, on average, across all of our selected benchmarks. Hence, while the overhead for profiling is already relatively low compared to previous works, further optimization efforts that enable the runtime to compute and organize the necessary information for each allocation context without affecting data locality could reduce it even further.
Time per Profile Interval. In addition to the overhead reductions shown in Figure 5, the profiling enhancements developed for this work also reduce the time necessary to collect each profile. These reductions enable the runtime to make faster tiering decisions based on more recent memory behavior. Table 2 shows the mean and maximum number of seconds necessary to collect and analyze profiles of every allocation context during program execution for each benchmark set. Thus, the enhancements reduce the time per profile interval by more than 11× across both benchmark sets. The vast majority of this improvement is driven by the system-level instrumentation that tracks the number of pages mapped for each arena. As it is no longer necessary to visit every page that is mapped in each arena during the profile interval, the profiler estimates the capacity of each allocation context much more quickly.
6.1.2 Memory Capacity Overhead.
Let us next examine the memory capacity overhead of our custom allocator and online profiling tools. There are two primary reasons our approach could potentially increase memory capacity relative to the default allocator. First, dividing the application heap into separate arenas for each allocation context increases fragmentation and could boost the number of unused bytes on resident pages. Second, the runtime itself requires some additional space to collect and organize profiling information. In particular, in-memory buffers to store raw data access samples, as well as structures to aggregate and hold memory usage information for each allocation context increase capacity requirements during profiling.
Figure 6 shows the peak resident set size of each benchmark with (1) the hybrid arena allocation scheme, but without any profiling enabled, and (2) the online profiler, which uses the hybrid arena scheme but also collects and stores memory usage information that is necessary for our online approach. All results are shown relative to the peak RSS of execution with the default allocator.
Fig. 6.

Thus, the online profiler does require a modest increase in memory capacity compared to the default allocator for most applications. For the medium CORAL benchmarks, capacity rises by about 10% with online profiling enabled, on average, with a worst-case increase of 18% for LULESH. For SPEC, the average increase is somewhat larger at 29%, but this difference is mostly driven by outsize increases in smaller benchmarks, such as 621.wrf_s and 644.nab_s. These benchmarks use only a few hundred MBs of memory with the default configuration, and so, even a relatively small amount of additional capacity appears as a substantial overhead. Additionally, we found that the space overhead of our approach does not necessarily scale with larger workload sizes. In particular, the capacities of the large and huge CORAL workloads with the online profiler (which are not shown in Figure 6 to avoid clutter) are only about 1% larger, on average, than default execution.
We also note that, while these overheads could potentially increase pressure in the faster memory tier(s), heterogeneous memory platforms typically support much larger capacities through additional memory layers. Hence, unless the online approach does a poor job of separating the sources of these overheads from hot program data, this additional capacity is less likely to be a burden on real platforms, as it will usually be accommodated by larger (but slower) memory storage.
6.2 Performance of Guided Data Management with Varying Capacity Constraints
Our next set of experiments aim to evaluate the performance of offline and online guided data management with varying capacity constraints in the faster memory tier. For this evaluation, we again use the CORAL benchmarks with medium input sizes as well as the selected SPEC CPU 2017 benchmarks. To evaluate each workload and configuration with different capacity constraints, we extended our Linux kernel with new facilities to control the amount of DRAM available for a given process. Specifically, we added an option to the memory control group (cgroup) interface [49] to allow individual processes or process groups to limit the amount of physical memory that they are able to allocate and keep resident on a particular NUMA node at any given point in time. Thus, if a process attempts to map a virtual page to a new physical page on a node whose specified limit has already been reached, then the kernel will force the process to use a page from a different NUMA node to satisfy the fault or fallback to page reclaim if no other memory is available.
To prepare these experiments, we first measured the peak resident set size of a run of the default configuration of each benchmark application. Subsequent experiments then use the cgroup controls to limit the capacity available in the DRAM tier to be a percentage of the measured peak RSS of the running application. Specifically, we tested configurations with DRAM capacity limited to 10%, 20%, 30%, 40%, and 50% of the peak RSS of the application. For comparison against a standard data tiering approach that does not use any profile guidance, we also ran each benchmark with each capacity limit with an unguided first touch configuration. The first touch configuration simply satisfies all memory demands from the application with allocations from the DRAM tier if capacity is available and, otherwise, from the Optane tier.
Figure 7 presents the performance of each benchmark with first touch as well as the offline and online guided data tiering approaches. All results show throughput relative to the default configuration with no capacity limitations in the DRAM tier (i.e., all memory objects use the faster memory devices), and, thus, higher is better. We can make several key observations based on these results. First, profile guided data tiering enables significant speedups compared to first touch for all four CORAL benchmarks. In the best cases, the offline approach is up to 7.3× faster than first touch (LULESH, 20% DRAM), while the online approach is up to 7.1× faster (QMCPACK, 50% DRAM). Average (geometric mean) speedups with the CORAL benchmarks range from 2.1× to 3.3× for the offline approach, and 1.8× to 2.5× for the online approach, across the different capacity limits.
Fig. 7.

The performance impact of profile guided data tiering with the SPEC benchmark set is more modest but still significant. Several benchmarks (specifically, 607.cactuBSSN_s, 621.wrf_s, 638.imagick_s, and 644.nab_s) exhibit little or no improvement with guided data management. In some cases (specifically, 638.imagick_s, and 644.nab_s), the online approach actually slightly degrades performance, because the overhead of profiling is not offset by any gains in efficiency. However, guided data tiering does enable significant speedups for the other SPEC benchmarks. For instance, the offline approach speeds up some configurations of 603.bwaves_s and 654.roms_s by more than 50%, while the online approach speeds up these applications by up to 18% and 35%, respectively, compared to first touch. The best case for both the offline and online approaches is 628.pop2_s with 20% DRAM capacity, which speeds up by more than 84% with either guided approach. Overall, and across the different capacity limits, average speedups for the full group of SPEC benchmarks ranges from \( 5.7\% \) to \( 14.6\% \) for the offline approach and \( 1.8\% \) to \( 8.6\% \) for the online approach.
6.2.1 Comparing the Offline and Online Approaches.
While there are a few cases where the online approach outperforms the offline approach, in general, the offline approach enables faster execution times than the online approach. To explain why, we analyzed the individual online profiles of several of our selected benchmarks. We found that the capacity and usage of data associated with each allocation site may shift substantially during early portions of the run, but after a short initial period, the sorted rank of each site and selection of sites assigned to the upper tier remains relatively stable from interval to interval. Indeed, in every case we analyzed, the online approach generates a solution that is similar to the offline approach after this short initial period.
To understand how this behavior impacts the operation of the online approach, consider Figure 8, which plots the total memory (DRAM + Optane) bandwidth as well as the number of GBs migrated between memory tiers over time with the online approach for the four CORAL benchmarks with their medium input sizes. These results correspond to the configuration with DRAM capacity limited to 50% of the application’s peak RSS. Thus, we see that memory bandwidth for the online run is relatively low during early portions of the run, that is, until the runtime has enough profile information to make good data placement decisions. Additionally, the majority of data migration occurs during this early period of relatively poor performance. Even after the runtime identifies a good data placement strategy, later intervals may still sometimes interrupt the application to change data placement, but these migrations have relatively little impact on system bandwidth.
Fig. 8.

However, frequent data movement, if not accompanied with a rise in efficiency, can be a significant overhead of the online approach. The rightmost column of Table 3 shows the migration rate (in MB per seconds) during execution with the online approach alongside the execution times of the default (unguided), offline, and online approaches for each CORAL-medium and SPEC benchmark. The results use the configuration that limits DRAM capacity to 50% of the peak RSS of the application. Thus, migration rates for the online approach range from less than 1 MB/second (for 621.wrf_s) to almost 339 MB/second (for AMG). Overall, applications with higher migration rates do tend to exhibit more substantial slowdowns compared to the offline approach. However, for some applications, such as QMCPACK and 649.fotonik3d_s, the benefits of dynamic adaptation ultimately outweigh these additional costs.
Table 3.
| Application | Execution Time (s) | MB/sec | ||
|---|---|---|---|---|
| Unguided | Offline | Online | ||
| LULESH | 2,097 | 467 | 611 | 197.5 |
| AMG | 974 | 669 | 817 | 338.9 |
| SNAP | 1,659 | 901 | 1,206 | 136.3 |
| QMCPACK | 5,895 | 1,181 | 882 | 26.8 |
| 603.bwaves_s | 413 | 270 | 348 | 99.5 |
| 607.cactuBSSN_s | 435 | 435 | 475 | 14.1 |
| 621.wrf_s | 379 | 370 | 392 | 0.4 |
| 627.cam4_s | 1,799 | 1,466 | 1,672 | 3.7 |
| 628.pop2_s | 701 | 628 | 610 | 21.9 |
| 638.imagick_s | 400 | 400 | 429 | 16.5 |
| 644.nab_s | 193 | 193 | 205 | 3.3 |
| 649.fotonik3d_s | 1,473 | 1,343 | 1,282 | 146.7 |
| 654.roms_s | 1,002 | 659 | 788 | 225.3 |
In sum, there are three main reasons that the performance of the online approach sometimes lags the offline approach for these benchmarks. For one, the offline approach does not incur any overhead for profiling and is able to use an additional computing core for program execution. We expect that future efforts could reduce online profile overhead by disabling some or most of the profiler after it has collected sufficient information to characterize the current usage pattern. Some relatively lightweight profiling might still be necessary to detect if program usage shifts substantially. Next, even if the online approach eventually generates a similar or better solution than the offline approach, the application still executes with suboptimal data placement during the initial profiling period. We found that this effect can have a considerable negative impact in some cases, as this initial period can be a significant portion of the total execution time for some benchmarks (e.g., AMG in Figure 8(b)). And third, certain usage patterns may cause the online approach to move data between tiers more frequently but with relatively little benefit to overall performance. Even with these limitations, the online approach is still preferable to the offline approach in cases where (1) it is not feasible to collect or maintain offline profile data or (2) it is not possible or very difficult to construct and profile program inputs that are representative of production execution.
6.3 Performance Analysis with Large Memory Workloads
We conclude our evaluation by examining the impact of guided data tiering on the CORAL benchmarks with the large and huge input sizes. There are several benefits of evaluation with such large-scale memory workloads. Since these workloads require more memory capacity than there is available DRAM on our platform, there is no need to artificially limit the available capacity of the faster memory tier. As a result, data movement costs are also more realistic, because the system may migrate data into and out of the entire DRAM tier. Additionally, this approach allows for direct comparison between guided (and unguided) software-based data tiering approaches and the hardware-managed DRAM caching available on our platform.6
Figure 9 shows the performance of the four CORAL benchmarks with the offline and online approaches alongside the hardware-managed DRAM caching option on our platform. Each bar shows throughput relative to the unguided first-touch configuration, and, thus, higher is better. We find that the offline and online approaches significantly outperform unguided first touch in almost every case. In the best case, LULESH with the large input achieves speedups of more than 7.7× and 6.1× for the offline and online approaches, respectively.
Fig. 9.

For LULESH, AMG, and SNAP, the guided approaches achieve similar, or somewhat better, performance than the hardware-managed caching mode on our platform. The biggest improvement comes with the large input of AMG, which is almost 70% faster with the offline approach and 45% faster with the online approach compared to HW caching. For these cases, there is also significant potential for memory energy savings with the guided approaches, as hardware-managed caching typically generates much more data movement between tiers than software-based approaches.
For QMCPACK, however, hardware-managed caching is much more efficient than either guided approach and achieves speedups ranging from 2.8× to 7× faster compared to the guided approaches. This case highlights one of the remaining limitations of our profile guided approaches. On further analysis, we found that the larger QMCPACK inputs use a single allocation site for the vast majority of their data allocations. Specifically, this site creates between 60% and 63% of all resident program data during runs with the large and huge inputs. Despite its large size, the data created at this site also exhibits the most frequent usage per byte relative to the other data in the application. As a result, these data are almost always assigned to the DRAM tier during guided execution, even if a significant portion of them is relatively cold for some time. Hence, while the guided approaches still outperform first touch, they lag the performance of the hardware-based approach, which is able to evict and replace cold data in the DRAM cache at a much finer granularity. One approach that could potentially address this limitation is to break up large sets of data created from the same site based on different data features, such as the age of the data, or the PID of the allocating thread.
7 Future Work
This study targeted a state-of-the-art heterogeneous memory platform with conventional DDR4 SDRAM and non-volatile Optane RAM. In the next few years, memory systems are expected to become even more complex, with more diverse technologies and capabilities within a single heterogeneous architecture, including high bandwidth memories, mixed HW/SW data management modes, processing-in-memory, non-uniform cache access, as well as GPUs and other accelerators. As we take this work forward, we plan to modify our tools and framework to support these technologies and will explore the challenges and opportunities that arise from guiding data management on more complex memory architectures.
To prepare for these future platforms, we are currently refactoring our toolset to separate the profiling and data management components of our approach into separate modules. At the same time, we are building new versions of this approach that do not require access to program source code or recompilation. The updated toolset will allow the runtime allocator, or the application itself, to specify address ranges with similar expected usage and then send this information to a system-level daemon that tracks and manages data allocations and placement for one or more processes. The goal is to create a more flexible toolset, which will enable users to rapidly design and implement alternative strategies for profiling application data usage, along with new policies for managing application data placement. Eventually, we will use these tools to investigate different design choices and options for guiding data placement, and will evaluate their benefits with a wider range of workloads on computing platforms with more varied and complex heterogeneous memory hardware. Some planned experiments include evaluating different ways of clustering program data into groups with similar expected usage (e.g., as described at the end of Section 6.3), with the goal of enabling more effective prediction and management of memory usage. Additionally, we plan to explore challenges presented by workloads with more varied and irregular access patterns, including web servers and multi-process workloads.
Last, we plan to develop techniques that exploit features of managed languages, such as Java, to further enhance guided data management. Managed language virtual machines (VMs) offer a number of features that can simplify (and often boost the efficiency of) classifying and migrating heap data. In particular, these systems typically shield applications from directly accessing the locations of objects on the heap, thereby freeing them from the need to update references with relocated addresses when objects migrate. Other VM features, such as garbage collection, and emulation engines that are designed for FDOs, can also make guidance-based data management easier to deploy and more effective for managed language applications.
8 Conclusions
This work develops the first-ever fully automatic and online profile guided data tiering solution for heterogeneous memory systems. It extends our previous offline profiling-based approach with new techniques to collect data tiering guidance with very low, and often negligible, performance overhead. It also develops a novel online algorithm that periodically analyzes this high-level information and uses it to steer data allocation and placement across a heterogeneous memory architecture. The evaluation shows that this approach significantly outperforms unguided data placement on a state-of-the-art Intel platform with DDR4 SDRAM and Optane NVRAM, with speedups ranging from 1.4× to 7× for a standard set of HPC workloads. Additionally, we find that, aside from a short startup period needed for convergence, the online approach achieves performance similar to that of a well-tuned offline approach. However, because it adapts automatically to the program as it runs, it does not need to collect or store profile information from a separate execution, which can be unwieldy and may lead to stale or unrepresentative profile guidance.
Footnotes
1
Described in Section 3.1, the SICM project, which is part of the U.S. Department of Energy Exascale Computing Project [39], is a memory allocator and runtime system designed to facilitate usage of HPC applications on complex memory machines. Its source code adopts and extends the popular jemalloc allocator [21].
2
This instrumentation is actually straightforward to implement in recent Linux kernels as it follows existing code to track of the resident set size of each memory control group.
3
It is important to note that the applications we selected for our evaluation did not reach this limit in our experiments.
4
Specifically, our study includes all of the multi-threaded ( \( 6xx \) ) FP benchmarks in SPEC CPU 2017 with OpenMP directives with the exception of 619.lbm_s, which is omitted, because it only allocates a single, large heap object throughout its entire run, and is therefore not likely to exhibit benefits with guided object placement.
5
Setting oversize_threshold to 0 disables a feature of jemalloc that allocates objects larger than a specific size to a dedicated arena (to reduce fragmentation). The other two parameters control the number of background threads, which enable jemalloc to purge unused pages asynchronously.
6
In Intel’s literature, the hardware-managed caching option for our platform is referred to as memory mode.
References
[1]
Neha Agarwal, David Nellans, Mark Stephenson, Mike O’Connor, and Stephen W. Keckler. 2015. Page placement strategies for GPUs within heterogeneous memory systems. SIGPLAN Not. 50, 4 (March 2015), 607–618.
[2]
Neha Agarwal and Thomas F. Wenisch. 2017. Thermostat: Application-transparent page management for two-tiered main memory. In Proceedings of the 22nd International Conference on Architectural Support for Programming Languages and Operating Systems (ASPLOS’17). ACM, New York, NY, 631–644.
[3]
Shoaib Akram. 2021. Performance evaluation of intel optane memory for managed workloads. ACM Trans. Archit. Code Optim. 18, 3, Article 29 (April 2021), 26 pages.
[4]
ANL. 2019. U.S. Department of Energy and Intel to Deliver First Exascale Supercomputer. ANL. Retrieved from https://www.anl.gov/article/us-department-of-energy-and-intel-to-deliver-first-exascale-supercomputer.
[5]
Gaurav Banga, Peter Druschel, and Jeffrey C. Mogul. 1999. Resource containers: A new facility for resource management in server systems. In Proceedings of the 3rd Symposium on Operating Systems Design and Implementation (OSDI’99). USENIX Association, Berkeley, CA, 45–58.
[6]
Nathan Beckmann and Daniel Sanchez. 2013. Jigsaw: Scalable software-defined caches. In Proceedings of the 22nd International Conference on Parallel Architectures and Compilation Techniques (PACT’13). IEEE Press, 213–224.
[7]
Adam Belay, Andrea Bittau, Ali Mashtizadeh, David Terei, David Mazières, and Christos Kozyrakis. 2012. Dune: Safe user-level access to privileged CPU features. In Proceedings of the 10th USENIX conference on Operating Systems Design and Implementation (OSDI’12). USENIX Association, Berkeley, CA, 335–348.
[8]
Jacob Brock, Chen Ding, Xiaoran Xu, and Yan Zhang. 2018. PAYJIT: Space-optimal JIT compilation and its practical implementation. In Proceedings of the 27th International Conference on Compiler Construction (CC’18). Association for Computing Machinery, New York, NY, 71–81.
[9]
Brad Calder, Chandra Krintz, Simmi John, and Todd Austin. 1998. Cache-conscious data placement. SIGPLAN Not. 33, 11 (October 1998), 139–149.
[10]
Christopher Cantalupo, Vishwanath Venkatesan, Jeff Hammond, Krzysztof Czurlyo, and Simon David Hammond. 2015. memkind: An Extensible Heap Memory Manager for Heterogeneous Memory Platforms and Mixed Memory Policies. Retrieved from https://www.osti.gov/biblio/1245908.
[11]
Sigmund Cherem and Radu Rugina. 2004. Region analysis and transformation for java programs. In Proceedings of the 4th Intl. Symp. on Memory Management (ISMM’04). ACM, New York, NY, 85–96.
[12]
Trishul M. Chilimbi and Ran Shaham. 2006. Cache-conscious coallocation of hot data streams. In Proceedings of the ACM SIGPLAN Conference on Programming Language Design and Implementation (PLDI’06). ACM, New York, NY, 252–262.
[13]
Chiachen Chou, Aamer Jaleel, and Moinuddin K. Qureshi. 2014. CAMEO: A two-level memory organization with capacity of main memory and flexibility of hardware-managed cache. In Proceedings of the 47th Annual IEEE/ACM Intl. Symp. on Microarchitecture (MICRO-47). 1–12.
[14]
Ian Cutress. 2021. Intel to Launch Next-Gen Sapphire Rapids Xeon with High-Bandwidth Memory. Retrieved from www.anandtech.com/show/16795/intel-to-launch-next-gen-sapphire-rapids-xeon-with-high-bandwidth-memory.
[15]
Mohammad Dashti, Alexandra Fedorova, Justin Funston, Fabien Gaud, Renaud Lachaize, Baptiste Lepers, Vivien Quema, and Mark Roth. 2013. Traffic management: A holistic approach to memory placement on NUMA systems. In ACM SIGPLAN Notices, Vol. 48. ACM, Association for Computing Machinery, New York, NY, 381–394.
[16]
Subramanya R. Dulloor, Amitabha Roy, Zheguang Zhao, Narayanan Sundaram, Nadathur Satish, Rajesh Sankaran, Jeff Jackson, and Karsten Schwan. 2016. Data tiering in heterogeneous memory systems. In Proceedings of the 11th European Conference on Computer Systems (EuroSys’16). New York, NY, Article 15, 16 pages.
[17]
T. Chad Effler, Adam P. Howard, Tong Zhou, Michael R. Jantz, Kshitij A. Doshi, and Prasad A. Kulkarni.2018. On automated feedback-driven data placement in hybrid memories. In LNCS International Conference on Architecture of Computing Systems.
[18]
T. Chad Effler, Michael R. Jantz, and Terry Jones. 2020. Performance potential of mixed data management modes for heterogeneous memory systems. In Proceedings of the IEEE/ACM Workshop on Memory Centric High Performance Computing (MCHPC’20). IEEE Computer Society, 10–16.
[19]
T. Chad Effler, Brandon Kammerdiener, Michael R. Jantz, Saikat Sengupta, Prasad A. Kulkarni, Kshitij A. Doshi, and Terry Jones. 2019. Evaluating the effectiveness of program data features for guiding memory management. In Proceedings of the International Symposium on Memory Systems (MEMSYS’19). Association for Computing Machinery, New York, NY, 383–395.
[20]
D. R. Engler, M. F. Kaashoek, and J. O’Toole, Jr.1995. Exokernel: An operating system architecture for application-level resource management. SIGOPS Oper. Syst. Rev. 29, 5 (December 1995), 251–266.
[21]
Jason Evans. 2006. A Scalable Concurrent malloc (3) Implementation for FreeBSD. In the 3rd Annual Technical BSD Conference (BSDCan’06). Ottawa, Canada.
[22]
Matt Fleming. 2021. A Thorough Introduction to eBPF. LWN.net. Retrieved from https://lwn.net/Articles/740157/.
[23]
Andy Georges, Dries Buytaert, and Lieven Eeckhout. 2007. Statistically rigorous java performance evaluation. In Proceedings of the 22nd Annual ACM SIGPLAN Conference on Object-Oriented Programming Systems, Languages and Applications (OOPSLA’07). Assoc. for Computing Machinery, New York, NY, 57–76.
[24]
Rentong Guo, Xiaofei Liao, Hai Jin, Jianhui Yue, and Guang Tan. 2015. NightWatch: Integrating lightweight and transparent cache pollution control into dynamic memory allocation systems. In Proceedings of the USENIX Annual Technical Conference (USENIX ATC’15). USENIX Association, 307–318.
[25]
Samuel Z. Guyer and Kathryn S. McKinley. 2004. Finding your cronies: Static analysis for dynamic object colocation. In Proceedings of the 19th Annual ACM SIGPLAN Conference on Object-oriented Programming, Systems, Languages, and Applications (OOPSLA’04). ACM, New York, NY, 237–250.
[26]
Martin Hirzel. 2007. Data layouts for object-oriented programs. In Proceedings of the ACM SIGMETRICS International Conference on Measurement and Modeling of Computer Systems (SIGMETRICS’07). ACM, New York, NY, 265–276.
[27]
Xianglong Huang, Stephen M. Blackburn, Kathryn S. McKinley, J. Eliot B. Moss, Zhenlin Wang, and Perry Cheng. 2004. The garbage collection advantage: Improving program locality. In Proceedings of the 19th Annual ACM SIGPLAN Conference on Object-oriented Programming, Systems, Languages, and Applications (OOPSLA’04). ACM, New York, NY, 69–80.
[28]
Robert Hundt, Sandya Mannarswamy, and Dhruva Chakrabarti. 2006. Practical structure layout optimization and advice. In Proceedings of the International Symposium on Code Generation and Optimization (CGO’06). IEEE Computer Society, Washington, DC, 233–244.
[29]
Joseph Izraelevitz, Jian Yang, Lu Zhang, Juno Kim, Xiao Liu, Amirsaman Memaripour, Yun Joon Soh, Zixuan Wang, Yi Xu, Subramanya R. Dulloor, Jishen Zhao, and Steven Swanson. 2019. Basic performance measurements of the Intel Optane DC persistent memory module. arxiv:1903.05714. Retrieved from http://arxiv.org/abs/1903.05714.
[30]
H. Jang, Y. Lee, J. Kim, Y. Kim, J. Kim, J. Jeong, and J. W. Lee. 2016. Efficient footprint caching for tagless DRAM caches. In Proceedings of the IEEE International Symposium on High Performance Computer Architecture (HPCA’16). IEEE, Wash., DC, USA, 237–248.
[31]
Michael R. Jantz, Forrest J. Robinson, Prasad A. Kulkarni, and Kshitij A. Doshi. 2015. Cross-layer memory management for managed language applications. In Proceedings of the ACM SIGPLAN International Conference on Object-Oriented Programming, Systems, Languages, and Applications (OOPSLA’15). ACM, New York, NY, 488–504.
[32]
Michael R. Jantz, Carl Strickland, Karthik Kumar, Martin Dimitrov, and Kshitij A. Doshi. 2013. A framework for application guidance in virtual memory systems. In Proceedings of the 9th ACM SIGPLAN/SIGOPS International Conference on Virtual Execution Environments (VEE’13). Assoc. for Computing Machinery, New York, NY, 155–166.
[33]
Jinseong Jeon, Keoncheol Shin, and Hwansoo Han. 2007. Layout transformations for heap objects using static access patterns. In Proceedings of the 16th International Conference on Compiler Construction (CC’07). Springer-Verlag, Berlin, 187–201. http://dl.acm.org/citation.cfm?id=1759937.1759954.
[34]
Anna R. Karlin, Mark S. Manasse, Lyle A. McGeoch, and Susan Owicki. 1990. Competitive randomized algorithms for non-uniform problems. In Proceedings of the 1st Annual ACM-SIAM Symposium on Discrete Algorithms (SODA’90). Society for Industrial and Applied Mathematics, 301–309.
[35]
Ali Khanafer, Murali Kodialam, and Krishna P. N. Puttaswamy. 2013. The constrained ski-rental problem and its application to online cloud cost optimization. In Proceedings of the Proceedings IEEE International Conference on Computer Communications (INFOCOM’13). IEEE, New York, NY, 1492–1500.
[36]
Jonghyeon Kim, Wonkyo Choe, and Jeongseob Ahn. 2021. Exploring the design space of page management for multi-tiered memory systems. In Proceedings of the USENIX Annual Technical Conference (USENIX ATC’21). USENIX Association, Berkeley, CA, 715–728. https://www.usenix.org/conference/atc21/presentation/kim-jonghyeon.
[37]
Yoongu Kim, Ross Daly, Jeremie Kim, Chris Fallin, Ji Hye Lee, Donghyuk Lee, Chris Wilkerson, Konrad Lai, and Onur Mutlu. 2014. Flipping bits in memory without accessing them: An experimental study of DRAM disturbance errors. In Proceedings of the ACM/IEEE 41st International Symposium on Computer Architecture (ISCA’14). 361–372.
[38]
A. Kleen. 2004. A NUMA API for Linux.
[39]
D. Kothe, S. Lee, and I. Qualters. 2019. Exascale computing in the united states. Comput. Sci. Eng. 21, 1 (January 2019), 17–29.
[40]
Mohammad Laghari, Najeeb Ahmad, and Didem Unat. 2018. Phase-based data placement scheme for heterogeneous memory systems. In Proceedings of the 30th International Symposium on Computer Architecture and High Performance Computing (SBAC-PAD’18). IEEE Computer Society, Washington, DC, 189–196.
[41]
Mike Lang. 2021. SICM. Retrieved from https://www.exascaleproject.org/research-project/sicm/.
[42]
Chris Lattner and Vikram Adve. 2005. Automatic pool allocation: Improving performance by controlling data structure layout in the heap. In Proceedings of the ACM SIGPLAN Conference on Programming Language Design and Implementation (PLDI’05). ACM, New York, NY, 129–142.
[43]
Yongjun Lee, Jongwon Kim, Hakbeom Jang, Hyunggyun Yang, Jangwoo Kim, Jinkyu Jeong, and Jae W. Lee. 2015. A fully associative, tagless DRAM cache. In Proceedings of the 42nd Annual International Symposium on Computer Architecture (ISCA’15). ACM, New York, NY, 211–222.
[44]
Charles Lefurgy, Karthick Rajamani, Freeman Rawson, Wes Felter, Michael Kistler, and Tom W. Keller. 2003. Energy management for commercial servers. Computer 36, 12 (December 2003), 39–48.
[45]
Y. Li, S. Ghose, J. Choi, J. Sun, H. Wang, and O. Mutlu. 2017. Utility-based hybrid memory management. In Proceedings of the IEEE International Conference on Cluster Computing (CLUSTER’17). IEEE Computer Society, Washington, DC, 152–165.
[46]
LLNL. 2014. CORAL Benchmark Codes. Retrieved from https://asc.llnl.gov/CORAL-benchmarks.
[47]
Gabriel H. Loh and Mark D. Hill. 2011. Efficiently enabling conventional block sizes for very large die-stacked DRAM caches. In Proceedings of the 44th Annual IEEE/ACM International Symposium on Microarchitecture. ACM, ACM, New York, NY, 454–464.
[48]
Mark S. Manasse. 2008. Ski Rental Problem. Springer US, Boston, MA, 849–851.
[49]
Paul Menage. 2021. CGROUPS. Retrieved September 24, 2021 from https://www.kernel.org/doc/Documentation/cgroup-v1/cgroups.txt.
[50]
M. R. Meswani, S. Blagodurov, D. Roberts, J. Slice, M. Ignatowski, and G. H. Loh. 2015. Heterogeneous memory architectures: A HW/SW approach for mixing die-stacked and off-package memories. In Proceedings of the IEEE International Symposium on High Performance Computer Architecture (HPCA’15). IEEE Computer Society, 126–136.
[51]
Justin Meza, Jichuan Chang, HanBin Yoon, Onur Mutlu, and Parthasarathy Ranganathan. 2012. Enabling efficient and scalable hybrid memories using fine-granularity DRAM cache management. IEEE Comput. Arch. Lett. 11, 2 (2012).
[52]
S. Mittal and J. S. Vetter. 2016. A survey of techniques for architecting DRAM caches. IEEE Trans. Parallel. Distrib. Syst. 27, 6 (June 2016), 1852–1863.
[53]
Anurag Mukkara, Nathan Beckmann, and Daniel Sanchez. 2016. Whirlpool: Improving dynamic cache management with static data classification. In Proceedings of the 21st International Conference on Architectural Support for Programming Languages and Operating Systems (ASPLOS’16). ACM, New York, NY, 113–127.
[54]
Onur Mutlu and Jeremie S. Kim. 2020. RowHammer: A retrospective. Trans. Comp.-Aid. Des. Integ. Cir. Sys. 39, 8 (August 2020), 1555–1571.
[55]
N/A. 2019. Flang. Retrieved June 28, 2019 from https://github.com/flang-compiler/flang.
[56]
NVIDIA. 2016. GP100 Pascal Whitepaper. Retrieved from ttps://images.nvidia.com/content/pdf/tesla/whitepaper/pascal-architecture-whitepaper.pdf.
[57]
Barack Obama. 2015. Executive Order—Creating a National Strategic Computing Initiative. White House. Retrieved from https://obamawhitehouse.archives.gov/the-press-office/2015/07/29/executive-order-creating-national-strategic-computing-initiative.
[58]
M. Olson, Brandon Kammerdiener, Michael Jantz, Kshitij Doshi, and Terry Jones. 2019. Portable application guidance for complex memory systems. In Proceedings of the International Symposium on Memory Systems (MEMSYS’19), Vol. 0. ACM, New York, NY, 156–166.
[59]
Matthew Benjamin Olson, Joseph T. Teague, Divyani Rao, Michael R. Jantz, Kshitij A. Doshi, and Prasad A. Kulkarni. 2018. Cross-layer memory management to improve DRAM energy efficiency. ACM Trans. Arch. Code Optim. 15, 2, Article 20 (May 2018).
[60]
M. B. Olson, T. Zhou, M. R. Jantz, K. A. Doshi, M. G. Lopez, and O. Hernandez. 2018. MemBrain: Automated application guidance for hybrid memory systems. In Proceedings of the IEEE International Conference on Networking, Architecture and Storage (NAS’18). IEEE Computer Society, 1–10.
[61]
ORNL. 2019. U.S. Department of Energy and Cray to Deliver Record-Setting Frontier Supercomputer at ORNL. Retrieved from https://www.ornl.gov/news/us-department-energy-and-cray-deliver-record-setting-frontier-supercomputer-ornl.
[62]
pagemap. 2021. pagemap, from the userspace perspective. Retrieved from https://www.kernel.org/doc/Documentation/vm/pagemap.txt.
[63]
Ivy Bo Peng, Roberto Gioiosa, Gokcen Kestor, Pietro Cicotti, Erwin Laure, and Stefano Markidis. 2017. RTHMS: A tool for data placement on hybrid memory system. In Proceedings of the ACM SIGPLAN International Symposium on Memory Management (ISMM’17). ACM, New York, NY, 82–91.
[64]
kernel.org 2019. perf: Linux Profiling with Performance Counters. Retrieved from https://perf.wiki.kernel.org/index.php/Main_Page.
[65]
Matthew L. Seidl and Benjamin G. Zorn. 1998. Segregating heap objects by reference behavior and lifetime. SIGPLAN Not. 33, 11 (October 1998), 12–23.
[66]
H. Servat, A. J. Peña, G. Llort, E. Mercadal, H. Hoppe, and J. Labarta. 2017. Automating the application data placement in hybrid memory systems. In Proceedings of the IEEE International Conference on Cluster Computing (CLUSTER’17). IEEE Computer Society, 126–136.
[67]
Yefim Shuf, Manish Gupta, Hubertus Franke, Andrew Appel, and Jaswinder Pal Singh. 2002. Creating and preserving locality of java applications at allocation and garbage collection times. In Proceedings of the 17th ACM SIGPLAN Conference on Object-oriented Programming, Systems, Languages, and Applications (OOPSLA’02). ACM, New York, NY, 13–25.
[68]
Jaewoong Sim, Alaa R. Alameldeen, Zeshan Chishti, Chris Wilkerson, and Hyesoon Kim. 2014. Transparent hardware management of stacked DRAM as part of memory. In Proceedings of the 47th Annual IEEE/ACM International Symposium on Microarchitecture (MICRO-47). IEEE Computer Society, 13–24.
[69]
SPEC. 2017. SPEC CPU 2017. Retrieved from https://www.spec.org/cpu2017/.
[70]
Po-An Tsai, Nathan Beckmann, and Daniel Sanchez. 2017. Jenga: Software-defined cache hierarchies. In Proceedings of the 44th International Symposium on Computer Architecture (ISCA’17). ACM, New York, NY, 652–665.
[71]
Zhenjiang Wang, Chenggang Wu, Pen-Chung Yew, Jianjun Li, and Di Xu. 2012. On-the-fly structure splitting for heap objects. ACM Trans. Archit. Code Optim. 8, 4, Article 26 (January 2012), 20 pages.
[72]
Kai Wu, Yingchao Huang, and Dong Li. 2017. Unimem: Runtime data managementon non-volatile memory-based heterogeneous main memory. In Proceedings of the International Conference for High Performance Computing, Networking, Storage and Analysis (SC’17). ACM, New York, NY, Article 58, 14 pages.
[73]
Vinson Young, Prashant J. Nair, and Moinuddin K. Qureshi. 2017. DICE: Compressing DRAM caches for bandwidth and capacity. In Proceedings of the 44th Annual International Symposium on Computer Architecture (ISCA’17). ACM, New York, NY, 627–638.
[74]
Chengliang Zhang and Martin Hirzel. 2008. Online phase-adaptive data layout selection. In Proc. of the 22Nd European Conf. on Object-Oriented Programming (ECOOP’08). Springer-Verlag, Berlin, 309–334.
Index Terms
- Online Application Guidance for Heterogeneous Memory Systems
Recommendations
Nimble Page Management for Tiered Memory Systems
ASPLOS '19: Proceedings of the Twenty-Fourth International Conference on Architectural Support for Programming Languages and Operating SystemsSoftware-controlled heterogeneous memory systems have the potential to increase the performance and cost efficiency of computing systems. However they can only deliver on this promise if supported by efficient page management policies and mechanisms ...
Data tiering in heterogeneous memory systems
EuroSys '16: Proceedings of the Eleventh European Conference on Computer SystemsMemory-based data center applications require increasingly large memory capacities, but face the challenges posed by the inherent difficulties in scaling DRAM and also the cost of DRAM. Future systems are attempting to address these demands with ...
FlexHM: A Practical System for Heterogeneous Memory with Flexible and Efficient Performance Optimizations
With the rapid development of cloud computing, numerous cloud services, containers, and virtual machines have been bringing tremendous demands on high-performance memory resources to modern data centers. Heterogeneous memory, especially the newly released ...
Comments
Information & Contributors
Information
Published In

September 2022
418 pages
Permission to make digital or hard copies of all or part of this work for personal or classroom use is granted without fee provided that copies are not made or distributed for profit or commercial advantage and that copies bear this notice and the full citation on the first page. Copyrights for components of this work owned by others than ACM must be honored. Abstracting with credit is permitted. To copy otherwise, or republish, to post on servers or to redistribute to lists, requires prior specific permission and/or a fee. Request permissions from [email protected].
Publisher
Association for Computing Machinery
New York, NY, United States
Publication History
Published: 06 July 2022
Online AM: 04 May 2022
Accepted: 01 April 2022
Revised: 01 April 2022
Received: 01 September 2021
Published in TACO Volume 19, Issue 3
Check for updates
Author Tags
Qualifiers
- Research-article
- Refereed
Funding Sources
- Exascale Computing Project
- U.S. Department of Energy Office of Science
- National Nuclear Security Administration
- National Science Foundation
Contributors

Other Metrics
Bibliometrics & Citations
Bibliometrics
Article Metrics
- 0Total Citations
- 1,155Total Downloads
- Downloads (Last 12 months)485
- Downloads (Last 6 weeks)41
Other Metrics
Citations
Cited By
View allView Options
View options
View or Download as a PDF file.
PDFeReader
View online with eReader.
eReaderHTML Format
View this article in HTML Format.
HTML FormatGet Access
Login options
Check if you have access through your login credentials or your institution to get full access on this article.
Sign in