
Abstract
In this paper, we propose a method to segment the thyroid from a set of 2D ultrasound images. We extended an active contour model in 2D to generate a 3D segmented thyroid volume. First, a preprocessing step is carried out to suppress the noise present in US data. Second, an active contour is used to segment the thyroid in each of the 2D images. Finally, all the segmented thyroid images are passed to a 3D reconstruction algorithm to obtain a 3D model of the thyroid. We obtained an average segmentation accuracy of 86.7% in six datasets with a total of 703 images.
1 Introduction
Thyroid segmentation is of prime importance when it comes to treatment of staging thyroid diseases (size over time). There have been many research works on how to segment the thyroid in 2D as well as 3D. We propose a technique which extends the segmentation in 2D images to a 3D volume. We make use of the active contours without edge algorithm developed by Chan and Vese [1] to perform the segmentation in the thyroid images.
Numerous approaches for segmentation of medical images like the method by edge detection, by threshold value, region splitting and merging, watershed segmentation, active contours, have been proposed by Zhao et al. [2]. Jaspreet et al. [3] have compared active contour without edges (ACWE), localized region based active contour (LRAC) and distance regularized level set methods (DRLSE) to perform segmentation on ultrasound images. Apart from the 2D segmentation techniques, there have also been numerous researches in 3D segmentation. Dornheim et al. [4] used 3D mass-spring models to create a 3D deformable shape model for segmentation of thyroid cartilage. Similarly, Kollorz et al. [5] used an extension of geodesic active contour level set formulation to obtain a 3D thyroid.
Our approach differs in the way we segment the thyroid as we make use of the 2D segmentation approach and extend it to obtain a final 3D thyroid. The main idea behind active contours is to evolve an initial contour to detect objects in an image. There are two variations of active contours (with edges + without edges). We used the approach without edges, due to the characteristics of the missing ultrasound contrast between highly homogeneous appearance of the thyroid and other structures. The research goal is to perform the thyroid segmentation in the first image slice of the 2D ultrasound sweep and to subsequently perform segmentation in other slices of the sweep. Finally, once all the images from the sweep are segmented, the results are passed to a 3D reconstruction tool [6] and a 3D thyroid volume is generated.
2 Procedure
2.1 Data collection
We started by acquiring thyroid datasets from university hospital sources. Each dataset consisted of more than 100 thyroid images. First, we acquired a total of 21 US datasets (14 human and 7 thyroid phantom datasets - Ethical approval: The research related to anonymised use of human imaging data has been complied with all the relevant national regulations, institutional policies and in accordance the tenets of the Helsinki Declaration, and has been approved by the university chair research committee), that were all electromagnetically tracked. Hence, each image was acquired along with its tracking matrix which gives the transformation from the tracking center to the center of the image.
2.2 Pre-processing
Ultrasound Images usually have low visibility and also contain some noise like speckles [7]. Therefore a preprocessing step is required to enhance the contrast and supress the noise and contrast enhancement (Histogram equalization technique) [8] to improve the visibility of the thyroid region. This helps to recover the lost contrast in the image by remapping the brightness values over all the pixels. Finally a median filter is applied to suppress the speckle noise and preserves edge information. The comparison between the thyroid image before and after the pre-processing step is shown in Figure 1.
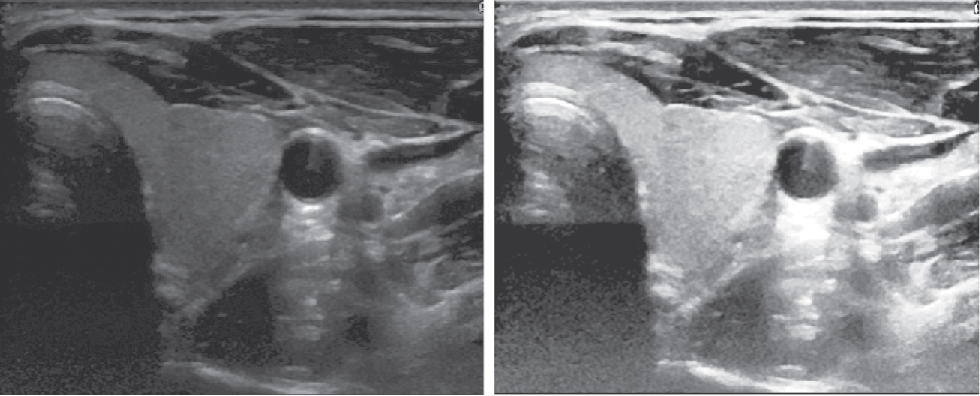
Left: Thyroid image before pre-processing, Right: Thyroid image after pre-processing.
2.3 Segmentation
2.3.1 Initializing a mask
Active contour without edges (Chan-Vese) segmentation algorithm [1] to perform the segmentation, which is started by defining an initial mask with two regions: foreground(=1) and back-ground(=0). The mask (freehand rectangle/square by user) should be inside the thyroid as this algorithm is sensitive to the contour initialization.
2.3.2 Computing Signed Distance Function, SDF (ϕ) from the mask
SDF is computed from the initial mask by using the Euclidean distance. In level set formalism, the contour C is represented by the zero level set of ϕ. Hence,
Figure 2 [1] shows the contour with the signed distance function, where ϕ(x, y) is positive inside the contour and negative outside the contour. Our goal is to evolve ϕ(x, y) when the evolving contour (C) is the zero level set of ϕ(x, y, t) at each time t.
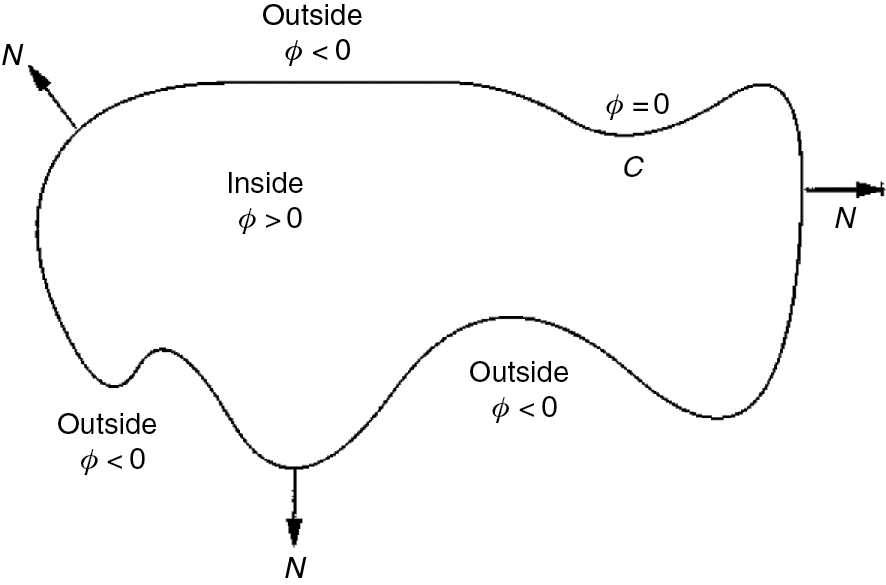
Contour(C) and SDF.
2.3.3 Forces computation
The evolution of the initial con-tour is computed by making use of two different forces, from an image and from a curvature. The first force is computed using Chan-Vese expression [1]:
where, I is the image, μin is the average inside the contour and μout is the average outside the contour.
Similarly, the force from the curvature is computed by using the following equation [9]:
All the derivatives of ϕ are computed using central difference method.
2.3.4 Contour evolution
The evolution of the curve is computed using the Taylor expansion
where,
Here, α represents the smoothing term and ϵ represents the coefficient to satisfy Courant, Friedrichs, Lewy (CFL) condition [10]. It is a necessary condition for convergence while solving partial differentiation equations. The evolution of the contour is done until the given number of iterations is complete.
2.3.5 Extension of segmentation to other images
After segmenting the first image we extend the process to the other images. For that we computed the center of mass of the first segmented thyroid. The tracking matrices (see section II A) can be used to find the center of each image. We also computed the offset (angle and distance) of the center of mass from the center of the first image followed by computing the center of mass in the second image with the associated tracking matrix, traversing along the offset obtained from the previous image. This leads us to the probable center of mass of thyroid in the second image. Then, we generate an initial mask around this center and perform the ACWE to generate a segmented thyroid, which is then extended to all images.
2.4 3D Reconstruction
The segmented images are processed to create an .avi file. Then this video file along with the tracking data is passed to a 3D reconstruction tool [6].
3 Experimental results
We started by taking a thyroid image and improving its contrast as well as reducing the speckle noise using Histogram Equalization and Median Filter. The original and the post-processed images can be seen in Figure 1. Then we used ACWE algorithm to perform the segmentation. The final result of the segmentation in one of the images can be seen in Figure 3.
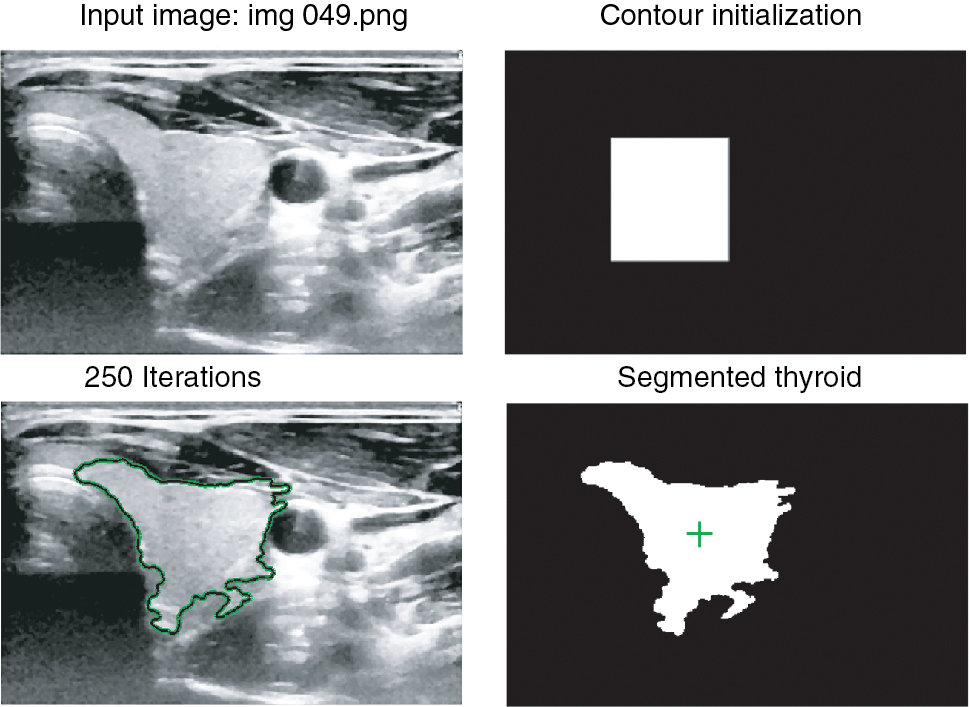
Top Left: Pre-processed thyroid, Top Right: Freehand drawn initial mask, Bottom Left: Segmented region shown by green contour obtained after 250 iterations, Bottom Right: Binary image showing segmented region in white with its center of mass shown by a green mark.
The ground truth is obtained from manual segmentation of thyroid by our medical specialists at the university clinic. The comparison can be seen in Figure 4. The Dice coefficient, a measure to find out how accurate our segmentation was compared to the ground truth, was 0.85 for the segmented image or 85% similar to the ground truth.
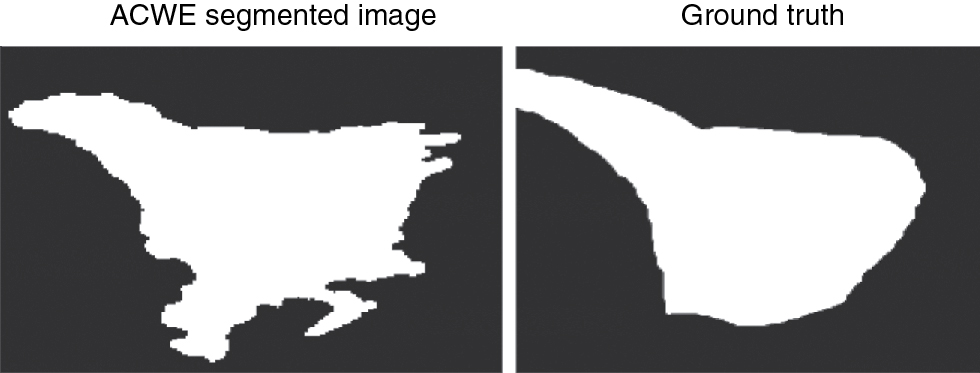
Left: Thyroid obtained from ACWE, Right: Thyroid obtained by manual segmentation by medical personalities.
The extension technique was used to segment all the images in 6 datasets, with the comparison results shown in Table 1. We got an average accuracy of 86.7% with a total of 703 images.
Comparison of ACWE and ground truth thyroid images.
| Dataset | Images | Dice Coefficient | Hausdorff Distance (mm) |
|---|---|---|---|
| Set 1 | 96 | 85.8 | 8.1 |
| Set 2 | 53 | 87.5 | 8.1 |
| Set 3 | 102 | 87.9 | 7.2 |
| Set 4 | 63 | 87.2 | 7.9 |
| Set 5 | 171 | 85.3 | 8.2 |
| Set 6 | 218 | 85.5 | 9.6 |
We also computed Hausdorff Distance (HD) to compare our results with a standard segmentation technique that uses mass spring models [4]. HD measures how far two subsets of a metric space are from each other, which is the greatest of all the distances from a point in one set to the closest point in the other set; so the smaller the distance, the closer the sets. The comparison of our results with [4] is shown in Table 2.
Comparison of ACWE and ground truth thyroid images.
| Approach | Hausdorff Distance (mm) |
|---|---|
| ACWE | 8.2 |
| Volumetric mass spring model | 11.108 |
| Surface mass spring model | 9.843 |
Finally, the result of the 3D reconstruction can be seen in Figure 5. Figure 6 shows the 3D thyroid in different views.
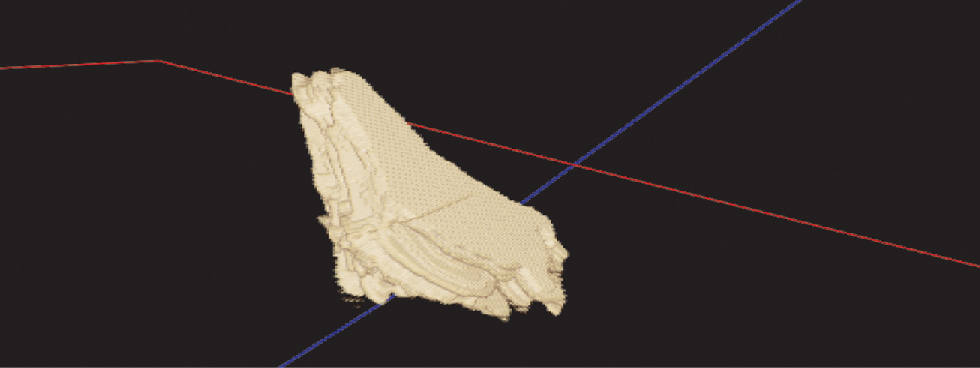
3D reconstructed thyroid volume.
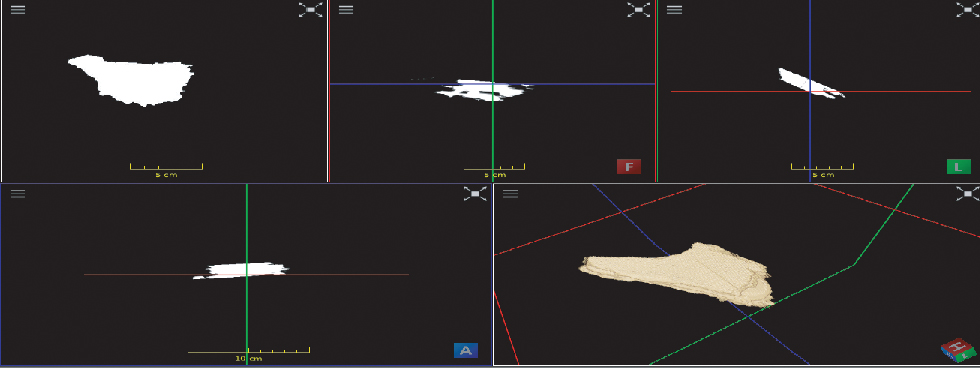
Top Left: A segmented thyroid image, Top middle: Frontal View of 3D thyroid, Top Right: Lateral View, Bottom Left: Axial View, Bottom Right: 3D thyroid.
4 Discussion and conclusion
We tried to extend a 2D segmentation algorithm to generate a 3D segmented object that differs from previous research works that either worked on 2D or 3D models. We combined the two different approaches and the obtained results show a close correlation to the ground truth data.
There can be numerous extensions to the research that we did. For example, the extension of segmentation technique could be further optimized and made more accurate by taking the ‘shape priors’ into consideration, or by controlling the evolution of the contour by adding more shape constraints. Also, the pre-processing steps could be further improved.
Acknowledgement
We thank General Electrics, USA for providing us with financial support to carry out the research. Special thanks to our clini-cal partners at the University of Magdeburg (Prof. C. Arnes) and the University Clinic in Jena (Prof. M. Freesmeyer) for helping to obtain the thyroid ultrasound datasets.
Author’s Statement
Research funding: Financial support by General Electrics, USA. Conflict of interest: Authors state no conflict of interest. Informed consent: Informed consent is not applicable. Ethical approval: The conducted research is not related to either human or animal use.
References
[1] Chan TF, Vese LA. Active contours without edges. IEEE Trans Image Process. 2001;10.10.1109/83.902291Search in Google Scholar PubMed
[2] Zhao J, Zheng W, Zhang L, Tian H. Segmentation of ultrasound images of thyroid nodule for assisting fine needle aspiration cytology.10.1186/2047-2501-1-5Search in Google Scholar PubMed PubMed Central
[3] Weinsten L, Swartz MN. Pathogenic properties of invading microorganisms. In: Sodeman WA Jr, Sodeman WA, editors. Pathologic physiology: mechanisms of disease. Philadelphia: WB Saunders; 1974. p. 457–72.Search in Google Scholar
[4] Dornheim J, Dornheim L, Preim B, Tonnies KD, Hertel I, Strauss G. Stable 3D mass-spring models for the segmentation of the thyroid cartilage.Search in Google Scholar
[5] Kollorz ENK, Hahn DA, Linke R, Goecke TW, Hornegger J, Kuwert T. Quantification of thyroid volume using 3-D ultra-sound imaging. IEEE Trans Med Imaging. 2008;27:457–66.10.1109/TMI.2007.907328Search in Google Scholar PubMed
[6] http://www.imfusion.de.Search in Google Scholar
[7] Chang C, Lei Y, Tseng C, Shih S. Thyroid segmentation and volume estimation in ultrasound images. IEEE Trans Biomed Eng. 2010;57:1348–57.10.1109/ICSMC.2008.4811830Search in Google Scholar
[8] Tay PC, Garson CD, Acton ST, Hossack JA. Ultrasound despeck-ling for contrast enhancement. IEEE Trans Image Process. 2010;19:1847–60.10.1109/TIP.2010.2044962Search in Google Scholar PubMed PubMed Central
[9] Aydi W, Masmoudi N, Kamoun L. Active contour without edges vs GVF active contour for accurate pupil segmentation. Int J Comput Appl. 2012;54.10.5120/8555-2118Search in Google Scholar
[10] Courant R, Friedrichs K, Lewy H. On the partial difference equations of mathematical physics. IBM J. 1967.10.1147/rd.112.0215Search in Google Scholar
©2016 Prabal Poudel et al., licensee De Gruyter.
This work is licensed under the Creative Commons Attribution-NonCommercial-NoDerivatives 4.0 License.