
Abstract
Ultrafiltration (UF) is one of the most widely used membrane technologies for the effective separation of macromolecules in feed solutions. However, despite good separation efficiency, the UF membranes made up of pure polymers suffer to a greater extent because of low flux problem, which affects the process time and load. To handle this limitation, the base polymer is blended with a suitable additive to modify the structural and surface morphology of the membrane to provide better fluxes. In this current study, a series of polyethersulfone (PES) UF asymmetric membranes blended with polyethylene glycol and iron oxide nanoparticles was prepared using the phase inversion technique. Prepared membranes were analyzed for their morphology, thermal stability, and membrane characterization. Morphology studies using scanning electron microscopy and atomic force microscopy confirmed the increase in the number of pores, pore size in support layer, and surface roughness in the blended membranes, ensuring the chances of enhanced flux. Surface hydrophilicity was increased with the increase in the iron oxide concentration in the composite membranes. Thermal analysis studies showed the better thermal stability of the blended membranes. Pure water flux of the prepared composite membranes was improved to a maximum of four times in comparison with pure PES membrane. Dye rejection studies clearly showed that the blended membranes almost had the same rejection as that of pure PES membrane. Thus, the prepared PES composite UF membrane is a promising candidate for the treatment of dye-polluted wastewater, ensuring high fluxes and effective rejection.
1 Introduction
Membrane-based separation techniques are widely used nowadays for concentrating and purifying macromolecular solutions compared with other conventional separation routes (1–3). Ultrafiltration (UF) membranes for water and wastewater treatment are being largely analyzed because they are highly efficient in removing all the suspended and dissolved particles, including molecules and ions present in the feed stream (4). Various membrane materials, especially polymers such as polyvinylidene fluoride (5–7), polysulfone (8–10), polyacrylonitrile (11–13), polyethersulfone (PES) (14–17), poly vinyl alcohol (18–21), and cellulose acetate (22–25), have been used as starting materials for making UF membranes for water and wastewater treatment. PES is one of the better polymers for making UF membranes because of its excellent thermal, mechanical, and chemical properties for membrane processes (26). PES has been successfully used in making asymmetric UF membranes with different pore morphologies (26–28). However, pure PES membranes possessed hydrophobic surface and high fouling nature, which ultimately caused low fluxes with their usage (29). To overcome this limitation, the PES membrane is blended with hydrophilic and inorganic additives to modify the surface and structure of the membrane, which improved the flux (12, 15, 30–36). However, some of existing properties and qualities of pure PES membrane, such as solute rejection, thermal stability, etc., are reduced in blended membranes (31). Among the various hydrophilic polymer additive blended with PES membranes, polyethylene glycol (PEG) is of special interest. PEG increased the cast’s solution viscosity and thus enhanced better pore interconnectivity when applied in correct amount (37, 38). Moreover, the addition of PEG suppressed the macrovoid formation and enhanced the surface hydrophilicity of the membrane (39). PES membrane prepared with low molecular weight PEG (200 Da) exhibited good rejection characteristics in comparison with high molecular weight PEG (38). Several studies have been conducted for PES membranes blended with inorganic additives, especially metal oxide nanoparticles (14–17). In general, the inorganic additives enlarged the pore size, resulting in high permeate flux, but with considerable loss in the solute rejection percentage (40).
Recently, iron oxide nanoparticles are widely used as additives for polymeric and ceramic membranes (41–45). The impregnation of iron nanoparticles provided good dechlorination to a wide range of chlorinated organics (46). Iron nanoparticles are also excellent absorbents, and their presence in the membrane could increase the membrane’s thermomechanical stability. Ceramic/polymeric membranes blended with iron oxide have been studied for the treatment of water polluted with phenol/organic matter (41) and for the removal of arsenic in water (42, 43). Polyvinylchloride membrane blended with iron nanoparticles has showed improved performance for its ion exchange applications. The addition of polyaniline and iron oxide to PES membrane resulted in better rejection of copper ions (44). In our earlier study, PES membrane blended with zerovalent iron nanoparticles, indicated that the permeate flux increased by 2.5 times whereas rejection was decreased by a maximum of 12% when applied to metal ion rejection studies (45).
In this study, a series of PES membrane blended with PEG and iron oxide nanoparticles (FeON) is prepared using the dry/wet phase inversion method. The prepared membranes are characterized for their morphology, thermal characteristics, and UF features. Eventually, the blended membranes are used to study their dye rejection performance. The obtained results for the characterization and performance tests of the composite membranes are compared with the features of pure PES membrane.
2 Materials and methods
2.1 Materials
PES (Veradel 3200P) in powder form was supplied by Solvay Specialities India Pvt. Ltd (India), and it was dried at 120°C for 8 h before being used. Iron oxide nanoparticle (FeON, mean particle size of 20 nm) solution was procured from Reinste Nanoventures Pvt. Ltd (India). N,N-dimethyl formamide (DMF) solvent and PEG (molecular weight, 200 Da) were obtained from SRL Chemicals (India). Orange II (molecular weight, 350.3 g mol-1) and Congo red (molecular weight, 696.7 g mol-1) dye powders were purchased from Avra Synthesis Pvt. Ltd (India). Freshly prepared deionized water was used for gelation bath preparation, dye solution preparation, and membrane storage. All the reagents used in the membrane preparation process were of analytic grade and used as such in the preparation process.
2.2 Membrane preparation
The phase inversion technique is the most widely used membrane preparation method especially for PES-based membranes (47). On the basis of earlier studies, it was understood that the PEG 200 additive would attribute to pore size reduction, and its optimum concentration for PES membrane was observed to be 5 wt% (38). Hence, the PEG additive concentration was fixed at 5 wt%, and the FeON additive concentration varied from 1 to 4 wt%. The cast solution for a given membrane preparation was prepared by dissolving required amounts of the PES, PEG, and FeON in DMF solvent, as shown in Table 1, in a round bottom flask. The solution was mechanically stirred (400 rpm, along with mild heating) for 8 h to ensure complete dissolution. The cast solution was then ultrasonicated for 30 min to ensure the uniform distribution of FeON. Then the solution was allowed to stand for 2 h at room temperature to remove the air bubbles, which would otherwise prove detrimental to the membrane structure. The blended solution was then cast on smooth glass plate with the help of a doctor blade for a fixed thickness of 200 μm. Before casting, a gelation bath of deionized water was kept ready at 20°C. The casted membrane was air dried for 30 s, and then it was immersed in the gelation bath. After 30 min of gelation, the membrane was removed from the gelation bath and washed with distilled water to remove any residual solvent. The composite UF membrane sheet was subsequently stored in a deionized water container.
Composition and characterization results for the pure and blended PES membranes.
| Membrane ID | Membrane composition (by wt%) | Surface roughness, Ra (nm) | Contact angle (°) | Porosity, ε | Decomposition temperature, Td (°C) | |||
|---|---|---|---|---|---|---|---|---|
| Polymer | PEG | FeON | Solvent (DMF) | |||||
| M1 | 15 | 0 | 0 | 85 | 53.76 | 67 | 0.583 | 358 |
| M2 | 15 | 5 | 0 | 80 | 50.44 | 64 | 0.672 | 243 |
| M3 | 15 | 5 | 1 | 79 | 57.12 | 58 | 0.709 | 339 |
| M4 | 15 | 5 | 2 | 78 | 62.29 | 54.5 | 0.727 | 419 |
| M5 | 15 | 5 | 3 | 77 | 66.34 | 52 | 0.742 | 468 |
| M6 | 15 | 5 | 4 | 76 | 70.77 | 52 | 0.746 | 503 |
2.3 Membrane characterization
The surface morphology of the prepared membranes was investigated by scanning electron microscopy (SEM) (Quanta FEG 200, FEI Co., USA). The membrane sample was cut into small pieces, dried using a filter paper, dipped in liquid nitrogen (for 30 s), and sputtered with gold before SEM measurement. SEM observation studies were conducted on the top surface and cross section of the membrane sample.
Atomic force microscopy (AFM; SPM CP-II, Vecco Co., Fort Collins, CO, USA) was used to analyze the surface roughness (Ra) for the prepared membranes. Results obtained were for an effective sampling area of 5×5 μm.
The hydrophilicity of pure and blended membrane surfaces was measured in terms of water contact angle. The contact angle on the membrane surface was measured using a goniometer (DGX Digidrop, France). The mean contact angle of each membrane was obtained by averaging the static contact angle measured at four different positions on the membrane sample’s surface.
The porosity of the prepared membranes was calculated by observing the water uptake capacity of the respective membrane sample. The rectangular cut of membrane sample (30×40 mm) was taken and soaked in deionized water for 24 h. The wet weight was weighed after wiping the excess water on the sample surface using filter paper. Subsequently, the wet sample was placed in a vacuum oven at 80°C for 24 h. The dry weight of the membrane sample was then weighed until the weight became constant. Membrane porosity was calculated using Equation [1] as follows:
where ε is the membrane porosity, Ww and Wd (kg) are the wet and dry weights of the membrane sample, respectively, A (m2) is the membrane surface area, l (m) is the membrane thickness, and ρw (kg m-3) is the density of water. The measurement process was repeated for three times, and the average porosity values were reported.
The thermal stability of the membrane samples was measured using a thermogravimetric analysis (TGA) instrument (STA 409PC; Seiko Instruments Inc., Chiba, Japan). A membrane sample of 5 mg was heated from 50°C to 900°C with a constant heating rate of 10°C min-1 under nitrogen atmosphere. Initially, the membrane sample was vacuum dried for 4 h at 50°C to remove moisture content before the start of the analysis. The weight loss behavior of the sample was obtained, and the decomposition temperature (Td) was defined as the temperature corresponding to 3% weight loss.
2.4 Permeability and rejection studies
Permeability and rejection studies were conducted in a dead-end UF-stirred cell filtration system connected to a nitrogen gas cylinder. The UF-stirred cell (Amicon, Model 8400) had an inner diameter of 76 mm and a volume capacity of 400 ml with a Teflon-coated magnetic paddle. The effective filtration area was 38.5 cm2. The feed side of the UF-stirred cell was pressurized using the nitrogen gas. A constant agitation speed of 400 rpm was maintained to reduce the concentration polarization effect. Before measurement, all membrane samples were compacted at a pressure of 414 kPa for approximately 1 h. Pure water flux of every membrane sample was then measured at an operation pressure of 276 kPa using Equation [2] as follows:
where Jw (L m-2 h-1) is the permeate flux, Q (L) is the volume of water collected, A (m2) is the membrane area, and ΔT (h) is the sampling time.
Rejection studies for the prepared membranes were conducted using Orange II and Congo red dye solutions at an operation pressure 276 kPa. The concentration of the dyes in the feed solution was kept constant at a value of 0.2 g L-1. Permeate was collected over defined time intervals in graduated tubes, and the tube contents were analyzed for dye concentration. Solute rejection percentage (%SR) was calculated using Equation [3] as follows:
where Cp and Cf are dye concentrations in the permeate and feed streams, respectively. The dye concentration in the permeate and feed streams was measured using a UV-Vis-NIR spectrophotometer (UV-3600; Shimazdu Corp., USA) at 486 and 495 nm pertaining to the dyes.
3 Results and discussion
3.1 Characterization of pure and composite membranes
SEM images of the top and cross section of pure and blended membranes are shown in Figure 1. All the prepared membranes exhibited asymmetric phenomena and consisted of a very thin skin layer and support layer. It was also observed that all membranes possessed a finger like cross section, but at the same time, they exhibited morphological differences among them. As evident from the Figure 1, the addition of PEG 200 increased the number of pores on the top surface while the cross section became more crystalline and little denser. Similar results were obtained by other related work (37–39). With the addition of FeON, it was clearly seen that there was a rough aggregation of FeON on the top surface as shown by the SEM image for 1% FeON membrane. This could be due to the availability of lone electron pairs from hydrogen atoms of the PEG polymer chain, which attracted the FeON. However, with the increase in the concentration of FeON, the distribution of the FeON became more uniform throughout the surface. Moreover, the size of the pores increased marginally with FeON addition because of the rapid solidification of the membrane in the gelation bath due to increased FeON concentration. As shown in Figure 2, the support layer, which regulates the flux, became voider with the addition of FeON. This could be due to the demixing of the polymer solution resulted from the nucleation and growth of the polymer rich phase. This in turn regulated the diffusion rates of the coagulant and solvent across the skin layer, which led to macrovoid formation. The SEM images clearly indicated that the addition of PEG and FeON to the base PES polymer has influenced the final morphology of the blended membranes.

SEM images of the top surface (A–D) and cross section (E–H) of membranes; (A and E) 100% PES, (B and F) PES and PEG (0% FeON), (C and G) 1% FeON, (D and H) 3% FeON.

AFM images of the membrane top surface; (A) 100% PES, (B) PES and PEG (0% FeON), (C) 1% FeON, and (D) 3% FeON.
Figure 2 shows the 3-D topographic AFM images of the top surface of the synthesized membranes. The bright high peaks denoted the nodules, and the dark depressions represented the pores present on the surface. It was observed that the nodules merged and became denser with the addition of PEG to the membrane, which is an indication of effective separation (38). However, with further addition of FeON to the blended PES and PEG, slight decoupling of nodules was observed, which was due to the agglomeration of the FeON particles. Surface roughness values of the prepared membranes from AFM analysis are presented in Table 1. The surface roughness of the PES membrane decreased with the addition of PEG 200. This could be due to the nodule coupling, which created a smooth surface. However, with the addition of FeON to the blended membrane, surface roughness increased because of loosely packed nodule aggregation in the active skin layer of the membrane. The high surface roughness values for the PES membrane blended with PEG and FeON indicated the chance of high fluxes associated with them (40).
Water contact angle measurement is one of the most suitable methods for evaluating the surface hydrophilicity of UF membranes. By theory, the contact angle of hydrophilic UF membrane should be less in comparison with hydrophobic UF membrane when the membrane morphologies are similar (48). As shown in Table 1, it could be seen that the contact angle of the blended membranes decreased, which indicated the enhanced hydrophilicity due to the addition of PEG and FeON to PES. This is mainly due to the FeON presence in the membrane, which contains a considerable amount of hydroxyl group responsible for the hydrophilicity enhancement. It was also observed that the surface hydrophilicity improvement almost flattened when the FeON concentration was increased from 3 to 4%.
Results of the membrane porosity studies are presented in Table 1. There was a sharp increase in the porosity values of the blended membranes with the addition of FeON up to 3% concentration. However, the porosity value was almost constant when the FeON concentration varied from 3 to 4%. As the FeON concentration was increased, the support layer resulted with larger size macrovoids (as observed from the SEM images), resulting in a more porous membrane. On the basis of the contact angle and porosity studies, it was understood that the hydrophilicity and porosity enhancements were considerably increased up to 3 wt% of FeON addition to the PES membrane blended with PEG 200, after which the enhancements almost leveled.
The outcome of the TGA analysis, as shown in Figure 3, clearly indicated the improved thermal stability of the membranes blended with FeON in comparison with the membranes blended with pure PES membrane and PES/PEG 200. As shown in Table 1, the decomposition temperature (Td, temperature at 3% weight loss) of the PES membrane blended with PEG 200 (0% FeON) decreased compared with the pure PES membrane. This was due to the weak thermal resistance of the PEG 200 additive. However, with the addition of FeON to the blended membrane, the thermal stability of the membrane increased to a greater extent. The thermal analysis results further ensured the uniform distribution of FeON throughout the membrane and also the good compatibility between FeON and PES.

TGA curves of pure PES and blended PES membranes.
3.2 Separation properties of pure and composite membranes
The pure water flux of all the prepared UF membranes was measured using a dead-end UF-stirred cell, as described previously. As shown in Figure 4, the flux of the blended membranes has a substantial increase than that of pure PES membrane. The pure water flux of the membrane blended with PEG 200 (0% FeON) increased approximately 1.5 times as compared with pure PES membrane. This was in accordance to that of the SEM and AFM analysis results, which clearly indicated the increase in the number of pores on the surface for the membrane blended with PEG 200. With further addition of FeON, it was observed that the water flux was improved sharply and reached a maximum of four times in comparison with pure PES membrane. The predominant reasons for the increase in the flux are due to the enhanced surface hydrophilicity and formation of larger crystalline macrovoid support layer due to the addition of FeON, as evident from SEM and AFM analysis results. It was also noticed that the flux boost almost leveled when the FeON concentration varied from 3 to 4 wt%, as inferred from the contact angle and porosity studies.
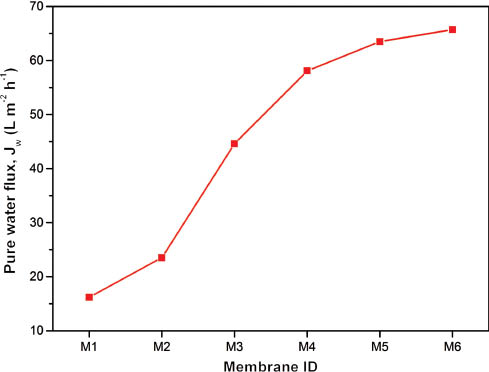
Pure water flux of pure PES and blended PES membranes at 276 kPa.
The results of dye rejection studies are presented in Figure 5. Orange II and Congo red were used as probe molecules for the rejection study. As shown in Figure 5, the rejection percentage of both dyes was almost constant for pure and composite membranes. The rejection of Congo red dye varied from 93.2% for the pure PES membrane to 92.5% for the 3 wt% FeON composite membrane, which was almost constant. However, with the increase of FeON concentration from 3 to 4 wt%, it was seen that the rejection decreased considerably from 92.5 to 89.8% on a comparative scale. Similar results were observed for Orange II rejection. Rejection studies indicated that any further addition of FeON of more than 3 wt% could lead to substantial reduction with regard to solute rejection. This could be due to the slight enlargement in the pore size of the composite membrane. Analyzing the performance results, it was clear that the 3 wt% FeON composite UF membrane had better separation features in comparison with the other synthesized membranes.

Dye rejection studies of pure PES and blended PES membranes at 276 kPa.
4 Conclusions
A series of UF composite membranes was prepared by blending PEG and iron oxide nanoparticles with PES. The prepared membranes were characterized by studying their membrane morphology (porosity and roughness), surface hydrophilicity (water contact angle), porosity (water uptake), and thermal stability. The addition of PEG and iron oxide nanoparticles remarkably influenced their membrane morphology and properties. Results indicated that the blended membranes have improved hydrophilicity, porosity, and thermal stability. This was primarily due to the increased number of surface pores and void thickness in the support layer of the blended membranes due to the iron oxide nanoparticle addition. Moreover, it was understood that the additives were uniformly distributed throughout the membrane with the increase in the concentration of iron oxide nanoparticles. The analysis of separation characteristics showed that pure water flux was greatly enhanced to a maximum of four times as compared with pure polymer membrane. Dye rejection studies using Orange II and Congo red clearly indicated that the rejection was almost constant and comparable with that of pure polymer membrane. A very close analysis on the obtained results revealed the better separation characteristics of 3 wt% iron oxide nanoparticles UF membrane among the synthesized series. It was also understood that any addition of iron oxide nanoparticles of more than 3 wt% would result with a considerable reduction in the rejection percentage. The performance of the prepared blended membranes in terms of fouling resistance, long-term stability, membrane modules, and handling of real-time industrial effluent is to be subsequently conducted as an extension of the current research work. Thus, PES UF membrane blended with PEG and iron oxide nanoparticles seems to be a promising candidate for the treatment of dye-polluted wastewater, ensuring high fluxes and effective rejection.
- Nomenclature
- Ra
Surface roughness average
- ε
Membrane porosity
- Wd
Weight of dry membrane
- Ww
Weight of wet membrane
- ρw
Density of water
- A
Membrane surface area
- l
Membrane thickness
- Td
Decomposition temperature
- Jw
Pure water flux
- Q
Permeate quantity
- ΔT
Sampling time
- % SR
Percentage solute rejection
- Cp
Solute (dye) concentration in the permeate
- Cf
Solute (dye) concentration in the feed
Acknowledgments
The authors thank Solvay Specialities India Private Limited (India) for providing the PES polymer for the research study.
Appendix
Structural formula for Congo red:

Structural formula for orange II:

References
1. Visvanathan C, Aim RB, Parameshwaran K. Membrane separation bioreactors for wastewater treatment. Crit Rev Environ Sci Technol. 2000;30(1):1–48.10.1080/10643380091184165Search in Google Scholar
2. Jiao B, Cassano A, Drioli E. Recent advances on membrane processes for the concentration of fruit juices: a review. J Food Eng. 2004;63(3):303–24.10.1016/j.jfoodeng.2003.08.003Search in Google Scholar
3. Scott K, Hughes R, eds. Industrial membrane separation technology. Glasgow: Blackie Academic and Professional; 1996.10.1007/978-94-011-0627-6Search in Google Scholar
4. Acero JL, Javier Benitez F, Real FJ, Teva F. Coupling of adsorption, coagulation, and ultrafiltration processes for the removal of emerging contaminants in a secondary effluent. Chem Eng J. 2012;210:1–8.10.1016/j.cej.2012.08.043Search in Google Scholar
5. Yuliwati E, Ismail AF. Effect of additives concentration on the surface properties and performance of PVDF ultrafiltration membranes for refinery produced wastewater treatment. Desalination 2011;273(1):226–34.10.1016/j.desal.2010.11.023Search in Google Scholar
6. Yan L, Li YS, Xiang CB. Preparation of poly (vinylidene fluoride)(PVDF) ultrafiltration membrane modified by nano-sized alumina (Al2O3) and its antifouling research. Polymer 2005;46(18):7701–6.10.1016/j.polymer.2005.05.155Search in Google Scholar
7. Zhi SH, Wan LS, Xu ZK. Poly (vinylidene fluoride)/poly (acrylic acid)/calcium carbonate composite membranes via mineralization. J Memb Sci. 2014;454:144–54.10.1016/j.memsci.2013.12.011Search in Google Scholar
8. Merin U, Cheryan M. Ultrastructure of the surface of a polysulfone ultrafiltration membrane. J Appl Polym Sci. 1980;25(9):2139–42.10.1002/app.1980.070250928Search in Google Scholar
9. Zodrow K, Brunet L, Mahendra S, Li D, Zhang A, Li Q, Alvarez PJ. Polysulfone ultrafiltration membranes impregnated with silver nanoparticles show improved biofouling resistance and virus removal. Water Res. 2009;43(3):715–23.10.1016/j.watres.2008.11.014Search in Google Scholar PubMed
10. Ma Y, Shi F, Ma J, Wu M, Zhang J, Gao C. Effect of PEG additive on the morphology and performance of polysulfone ultrafiltration membranes. Desalination 2011;272(1):51–8.10.1016/j.desal.2010.12.054Search in Google Scholar
11. Zhao ZP, Li J, Zhang DX, Chen CX. Nanofiltration membrane prepared from polyacrylonitrile ultrafiltration membrane by low-temperature plasma: I. Graft of acrylic acid in gas. J Memb Sci. 2004;232(1):1–8.10.1016/j.memsci.2003.11.009Search in Google Scholar
12. Nouzaki K, Nagata M, Arai J, Idemoto Y, Koura N, Yanagishita H, Haraya K. Preparation of polyacrylonitrile ultrafiltration membranes for wastewater treatment. Desalination 2002;144(1):53–9.10.1016/S0011-9164(02)00288-6Search in Google Scholar
13. Yang S, Liu Z. Preparation and characterization of polyacrylonitrile ultrafiltration membranes. J Memb Sci. 2003;222(1):87–98.10.1016/S0376-7388(03)00220-5Search in Google Scholar
14. Zhao W, Su Y, Li C, Shi Q, Ning X, Jiang Z. Fabrication of antifouling polyethersulfone ultrafiltration membranes using Pluronic F127 as both surface modifier and pore-forming agent. J Memb Sci. 2008;318(1):405–12.10.1016/j.memsci.2008.03.013Search in Google Scholar
15. Wu G, Gan S, Cui L, Xu Y. Preparation and characterization of PES/TiO2 composite membranes. Appl Surf Sci. 2008;254(21):7080–6.10.1016/j.apsusc.2008.05.221Search in Google Scholar
16. Basri H, Ismail AF, Aziz M. Polyethersulfone (PES)-silver composite UF membrane: effect of silver loading and PVP molecular weight on membrane morphology and antibacterial activity. Desalination 2011;273(1):72–80.10.1016/j.desal.2010.11.010Search in Google Scholar
17. Huang J, Zhang K, Wang K, Xie Z, Ladewig B, Wang H. Fabrication of polyethersulfone-mesoporous silica nanocomposite ultrafiltration membranes with antifouling properties. J Memb Sci. 2012;423:362–70.10.1016/j.memsci.2012.08.029Search in Google Scholar
18. Li RH, Barbari TA. Performance of poly (vinyl alcohol) thin-gel composite ultrafiltration membranes. J Memb Sci. 1995;105(1):71–8.Search in Google Scholar
19. Na L, Zhongzhou L, Shuguang X. Dynamically formed poly (vinyl alcohol) ultrafiltration membranes with good anti-fouling characteristics. J Memb Sci. 2000;169(1):17–28.10.1016/S0376-7388(99)00327-0Search in Google Scholar
20. Wang X, Fang D, Yoon K, Hsiao BS, Chu B. High performance ultrafiltration composite membranes based on poly (vinyl alcohol) hydrogel coating on crosslinked nanofibrous poly (vinyl alcohol) scaffold. J Memb Sci. 2006;278(1):261–8.10.1016/j.memsci.2005.11.009Search in Google Scholar
21. Amanda A, Kulprathipanja A, Toennesen M, Mallapragada SK. Semicrystalline poly (vinyl alcohol) ultrafiltration membranes for bioseparations. J Memb Sci. 2000;176(1):87–95.10.1016/S0376-7388(00)00433-6Search in Google Scholar
22. Qin JJ, Li Y, Lee LS, Lee H. Cellulose acetate hollow fiber ultrafiltration membranes made from CA/PVP 360 K/NMP/water. J Memb Sci. 2003;218(1):173–83.10.1016/S0376-7388(03)00170-4Search in Google Scholar
23. Kutowy O, Sourirajan S. Cellulose acetate ultrafiltration membranes. J Appl Polym Sci. 1975;19(5):1449–60.10.1002/app.1975.070190525Search in Google Scholar
24. Choi JH, Fukushi K, Yamamoto K. A submerged nanofiltration membrane bioreactor for domestic wastewater treatment: the performance of cellulose acetate nanofiltration membranes for long-term operation. Sep Purif Technol. 2007;52(3):470–7.10.1016/j.seppur.2006.05.027Search in Google Scholar
25. Chou WL, Yu DG, Yang MC. The preparation and characterization of silver loading cellulose acetate hollow fiber membrane for water treatment. Polym Advan Technol 2005;16(8):600–7.10.1002/pat.630Search in Google Scholar
26. Crull A. Membranes for the nineties: highlighting surface modification technology. Nonvalk, CT: Business Communications Co.;1990.Search in Google Scholar
27. Shi Q, Su Y, Zhu S, Li C, Zhao Y, Jiang Z. A facile method for synthesis of pegylated polyethersulfone and its application in fabrication of antifouling ultrafiltration membrane. J Memb Sci. 2007;303(1):204–12.10.1016/j.memsci.2007.07.009Search in Google Scholar
28. Wang H, Yang L, Zhao X, Yu T, Du Q. Improvement of hydrophilicity and blood compatibility on polyethersulfone membrane by blending sulfonated polyethersulfone. Chinese J Chem Eng. 2009;17(2):324–9.10.1016/S1004-9541(08)60211-6Search in Google Scholar
29. Van de Ven WJC, Van’t Sant K, Pünt IGM, Zwijnenburg A, Kemperman AJB, Van Der Meer WGJ, Wessling M. Hollow fiber dead-end ultrafiltration: axial transport variations during humic acid filtration. J Memb Sci. 2008;314(1):112–22.10.1016/j.memsci.2008.01.035Search in Google Scholar
30. Xu ZL, Qusay FA. Effect of polyethylene glycol molecular weights and concentrations on polyethersulfone hollow fiber ultrafiltration membranes. J Appl Polym Sci. 2004;91(5):3398–407.10.1002/app.13580Search in Google Scholar
31. Xu ZL, Qusay FA. Polyethersulfone (PES) hollow fiber ultrafiltration membranes prepared by PES/non-solvent/NMP solution. J Memb Sci. 2004;233(1):101–11.Search in Google Scholar
32. Chaturvedi BK, Ghosh AK, Ramachandhran V, Trivedi MK, Hanra MS, Misra BM. Preparation, characterization and performance of polyethersulfone ultrafiltration membranes. Desalination 2001;133(1):31–40.10.1016/S0011-9164(01)00080-7Search in Google Scholar
33. Rahimpour A, Madaeni SS. Polyethersulfone (PES)/cellulose acetate phthalate (CAP) blend ultrafiltration membranes: preparation, morphology, performance and antifouling properties. J Memb Sci. 2007;305(1):299–312.10.1016/j.memsci.2007.08.030Search in Google Scholar
34. Basri H, Ismail AF, Aziz M, Nagai K, Matsuura T, Abdullah MS, Ng BC. Silver-filled polyethersulfone membranes for antibacterial applications – effect of PVP and TAP addition on silver dispersion. Desalination 2010;261(3):264–71.10.1016/j.desal.2010.05.009Search in Google Scholar
35. Maximous N, Nakhla G, Wan W, Wong K. Performance of a novel ZrO2/PES membrane for wastewater filtration. J Memb Sci. 2010;352(1):222–30.10.1016/j.memsci.2010.02.021Search in Google Scholar
36. Balta S, Sotto A, Luis P, Benea L, Van der Bruggen B, Kim J. A new outlook on membrane enhancement with nanoparticles: the alternative of ZnO. J Memb Sci. 2012;389:155–61.10.1016/j.memsci.2011.10.025Search in Google Scholar
37. Méndez ML, Romero AI, Rajal VB, Castro EF, Calvo JI, Palacio L, Hernández A. Properties of polyethersulfone ultrafiltration membranes modified with polyethylene glycols. Polym Eng Sci. 2014;54(5):1211–21.10.1002/pen.23637Search in Google Scholar
38. Idris A, Mat Zain N, Noordin MY. Synthesis, characterization and performance of asymmetric polyethersulfone (PES) ultrafiltration membranes with polyethylene glycol of different molecular weights as additives. Desalination 2007;207(1):324–39.10.1016/j.desal.2006.08.008Search in Google Scholar
39. Arthanareeswaran G, Mohan D, Raajenthiren M. Preparation, characterization and performance studies of ultrafiltration membranes with polymeric additive. J Memb Sci. 2010;350(1):130–8.10.1016/j.memsci.2009.12.020Search in Google Scholar
40. Ahmad AL, Abdulkarim AA, Ooi BS, Ismail S. Recent development in additives modifications of polyethersulfone membrane for flux enhancement. Chem Eng J. 2013;223:246–67.10.1016/j.cej.2013.02.130Search in Google Scholar
41. Harman B I, Koseoglu H, Yigit NO, Beyhan M, Kitis M. The use of iron oxide-coated ceramic membranes in removing natural organic matter and phenol from waters. Desalination 2010;261(1):27–33.10.1016/j.desal.2010.05.052Search in Google Scholar
42. Sabbatini P, Yrazu F, Rossi F, Thern G, Marajofsky A, de Cortalezzi MF. Fabrication and characterization of iron oxide ceramic membranes for arsenic removal. Water Res. 2010;44 (19):5702–12.10.1016/j.watres.2010.05.059Search in Google Scholar PubMed
43. Park H, Choi H. As(III) removal by hybrid reactive membrane process combined with ozonation. Water Res. 2010;45 (5): 1933–40.10.1016/j.watres.2010.12.024Search in Google Scholar PubMed
44. Daraei P, Madaeni SS, Ghaemi N, Salehi E, Khadivi MA, Moradian R, Astinchap B. Novel polyethersulfone nanocomposite membrane prepared by PANI/Fe3O4 nanoparticles with enhanced performance for Cu (II) removal from water. J Memb Sci. 2012;415:250–9.10.1016/j.memsci.2012.05.007Search in Google Scholar
45. Rambabu K, Velu S. Iron nanoparticles blended polyethersulfone ultrafiltration membranes for enhanced metal ion removal in wastewater treatment. Int J Chem Tech Res. 2014;6(10):4468–70.Search in Google Scholar
46. Li F, Vipulanandan C, Mohanty KK. Microemulsion and solution approaches to nanoparticle iron production for degradation of trichloroethylene. Colloids Surf A Physicochem Eng Asp. 2003;223(1):103–12.10.1016/S0927-7757(03)00187-0Search in Google Scholar
47. Strathmann H, Kock K, Amar P, Baker RW. The formation mechanism of asymmetric membranes. Desalination 1975;16(2):179–203.10.1016/S0011-9164(00)82092-5Search in Google Scholar
48. Malaisamy R, Berry D, Holder D, Raskin L, Lepak L, Jones KL. Development of reactive thin film polymer brush membranes to prevent biofouling. J Memb Sci. 2010;350(1):361–70.10.1016/j.memsci.2010.01.011Search in Google Scholar
©2015 by De Gruyter
This article is distributed under the terms of the Creative Commons Attribution Non-Commercial License, which permits unrestricted non-commercial use, distribution, and reproduction in any medium, provided the original work is properly cited.