
Abstract
An improved image enhancement approach via nonsubsampled contourlet transform (NSCT) is proposed in this article. We constructed a geometric image transform by combining nonsubsampled directional filter banks and a nonlinear mapping function. Here, the NSCT of the input image is first decomposed for L-levels and its noise standard deviation is estimated. It is followed by calculating the noise variance and threshold calculation, and computing the magnitude of the corresponding coefficients in all directional subbands. Then, the nonlinear mapping function is used to modify the NSCT coefficients for each directional subband, which keeps the coefficients of strong edges, amplifies the coefficients of weak edges, and zeros the noise coefficients. Finally, the enhanced image is reconstructed from the modified NSCT coefficients. Three experiments are carried out respectively on images from subjective vision quality and objective evaluation measures. The first experiment is the algorithm performed on images. The subsequent experiments are the information entropy and spatial frequency. The experimental results demonstrate that the proposed method can gain better performance in enhancing the low-contrast parts of an image while keeping its clear edges.
1 Introduction
Image enhancement is one of the basic components and important techniques in image processing. Its goal is to improve image quality so that the processed image is better than the original one for a specific application or set of objectives, and more suitable than the primitive image in the human visual system or in a machine recognition system [12, 23]. Thus far, plenty of techniques have been proposed. Among the elementary enhancement techniques is histogram equalization [7]. This is a simple and fast method by which acceptable results for some applications can be achieved. Histogram equalization tends to overenhance the image’s contrast if there is a high peak in the histogram resulting in an undesired loss of visual data, quality, and intensity scale [13]. Adaptive histogram equalization is another technique [8, 22] that brings limited improvement because fixed contextual regions cannot adapt to features of different sizes. This method does not completely eliminate noise enhancement in smooth regions. In an attempt to overcome these limitations, more advanced and widespread enhancement algorithms have been proposed that have a common strategy-edge sharpening [18]. However, techniques of unsharp masking are less efficient for images having a wide range of features because of their single-scale properties. Their major drawback is the lack of an explicit noise suppression model, which could cause amplification of noise or artifacts. Image enhancement methods based on wavelet transforms are being used and give good results [25].
Contourlet transform [4] is a multidirectional and multiscale transform that is constructed by combining the Laplacian pyramid with a directional filter bank (DFB), which can be used to capture the geometrical properties of images. da Cunha et al. [3] developed the nonsubsampled contourlet transform (NSCT), which is a fully shift-invariant version of the contourlet transform, as well as multiscale and multidirectional expansion. The NSCT is based on a nonsubsampled pyramid (NSP) structure and nonsubsampled DFBs (NSDFBs). NSCT allows for a different and flexible number of directions at each scale, also achieving almost perfect sampling. On the basis of the NSCT, we propose a new image method to find the exact edge information that is useful for image enhancement. By using NSCT and the threshold function, we determine the edge information. Each pixel is modified by nonlinear mapping functions that can distinguish noise from weak edges very well.
The article is structured as follows. In Section 2, related works are discussed. The theories of NSCT are introduced in Section 3. Then, in Section 4, a new approach that applies NSCT is described. In this section, we introduce an improved method of image enhancement via NSCT. Furthermore, in Section 5, we present experimental results and compare our algorithm with some existing representative image enhancement methods. Finally, a conclusion is drawn in Section 6.
2 Related Work
Traditional histogram equalization image enhancement methods [1, 7, 22] can improve the perception of information for human viewers to some extent; however, they often amplify noise when they amplify weak edges. The advancement of the wavelet theory promotes its applications in image contrast enhancement, and some promising results are achieved by using the multiscale analysis system [5, 20]. However, the commonly used two-dimensional (2-D) wavelet transform in image processing is a separable extension of the 1-D wavelet transform, which does not work well in capturing the geometry of image edges and is not efficient in representing the contours not horizontally or vertically. Compared with wavelet, contourlet provides a different and flexible number of directions at each scale. It has been successfully employed in image enhancement, denoising, and fusion [6, 19, 16], among which the contourlet transform [4] takes the form of basis elements that exhibit very high directional sensitivity and are highly anisotropic. Accordingly, contourlet-based image enhancement methods have been proposed in Refs. [11, 16] owing to the attractive properties of contourlet transform. However, there still exist two problems for the contourlet-based enhancement schemes [14]: (i) some artifacts may be introduced, partially because the contourlet transform is not shift invariant, which will inevitably affect the reconstructed image after a manipulation of coefficients; and (ii) it is difficult to operate the nonlinear mapping function with many parameters. Unfortunately, because of downsamplers and upsamplers present in both the Laplacian pyramid and the DFBs, the foremost contourlet transform is not shift invariant, which causes pseudo-Gibbs phenomena around singularities. Some shift-invariant contourlet transform have been investigated in Refs. [3, 6]. NSCT [3] is a fully shift-invariant form of the contourlet transform. It leads to better frequency selectivity and regularity than contourlet transform. Furthermore, a directional multiscale modeling of images using the contourlet transform has been studied in Ref. [17]. It demonstrates that coefficients of NSCT are strongly dependent on their neighborhood and cousin coefficients. On the basis of NSCT, we propose a novel image enhancement method. Using NSCT and the threshold function, each pixel is modified using nonlinear mapping functions depending on the properties of the edges.
3 Nonsubsampled Contourlet Transform (NSCT)
The NSCT builds upon nonsubsampled pyramids and nonsubsampled DFBs, which can provide a shift-invariant, directional, and multiresolution image representation. The contourlet transform employs Laplacian pyramids to achieve multiresolution decomposition and DFBs to achieve directional decomposition. Because of downsampling and upsampling, the contourlet transform is shift variant. Figure 1A displays an overview of the NSCT [3]. The structure consists of a bank of filters that splits the 2-D frequency plane in the subbands illustrated in Figure 1B. The transform can be divided into two shift-invariant parts: an NSP structure that ensures the multiscale property and an NSDFB structure that gives directionality.
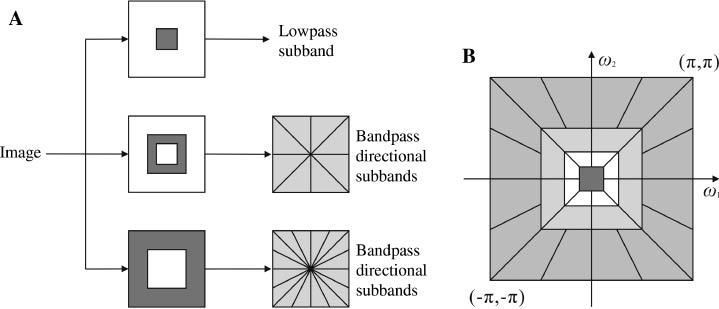
Nonsubsampled Contourlet Transform.
(A) NSFB structure. (B) Idealized frequency partitioning.
The multiscale property of the NSCT is obtained from a shift-invariant filtering structure that achieves a subband decomposition similar to that of the Laplacian pyramid. This is achieved by using two-channel nonsubsampled 2-D filter banks. Figure 2 illustrates the NSP decomposition with j= 3 stages. Such expansion is conceptually similar to the 1-D nonsubsampled wavelet transform (NSWT) computed with the à trous algorithm [21] and has j+ 1 redundancy, where j denotes the number of decomposition stages. The ideal passband support of the low-pass filter at the jth stage is the region [–π/2j, π/2j]2. Accordingly, the ideal support of the equivalent high-pass filter is the complement of the low-pass, i.e., the region [–π/2j–1, π/2j–1]2/[–π/2j, π/2j]2. The equivalent filters of a J-level cascading NSP are given by
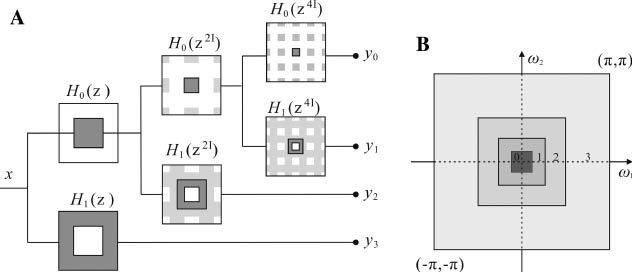
The NSP.
(A) Three-stage pyramid decomposition. (B) Subbands on the 2-D frequency plane.
where H0(Z) and H1(Z) denote the low-pass filter and the corresponding high-pass filter at the first stage, respectively. I is the identity matrix. The filters for subsequent stages are obtained by upsampling the filters of the first stage. This gives the multiscale property without the need for an additional filter design. In particular, one band-pass image is produced at each stage, resulting in j+ 1 redundancy.
The nonsubsampled filter bank (NSFB) [3] is built from the low-pass filter H0(z). One then sets H1(z) = 1– H0(z) and the corresponding synthesis filters G0(z) = G1(z) = 1. The perfect reconstruction condition is given as H0(Z)G0(Z) + H1(Z)G1(Z) = 1. A similar decomposition can be obtained by removing the downsamplers and upsamplers in the Laplacian pyramid and then upsampling the filters accordingly. The advantage of the construction is that it is general and, as a result, better filters can be obtained. In particular, G0(z) and G1(z) are low pass and high pass in design. Thus, they filter certain parts of the noise spectrum in the processed pyramid coefficients.
The DFB is constructed by combining critically sampled two-channel fan filter banks and resampling operations [3]. The result is a tree-structured filter bank that splits the 2-D frequency plane into directional wedges. A shift-invariant directional expansion is obtained with an NSDFB. The NSDFB is constructed by eliminating the downsamplers and upsamplers in the DFB. This is done by switching off the downsamplers/upsamplers in each two-channel filter bank in the DFB tree structure and upsampling the filters accordingly. This results in a tree composed of two-channel NSFBs. Figure 3 illustrates a four-channel decomposition. Note that in the second level, the upsampled fan filters Ui(zQ), i= 0,1 have checkerboard frequency support and, when combined with the filters in the first level, give the four-directional frequency decomposition shown in Figure 3. The synthesis filter bank is obtained similarly. Just like the critically sampled DFB, all filter banks in the NSDFB tree structure are obtained from a single NSFB with fan filters. Moreover, each filter bank in the NSDFB tree has the same computational complexity as that of the building-block NSFB.
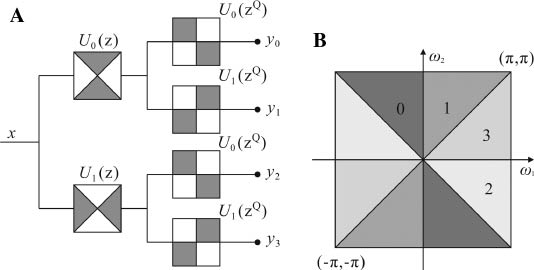
Four-Channel NSDFB.
(A) Filtering structure. (B) Corresponding frequency decomposition.
The NSCT is constructed by combining the NSP and the NSDFB as shown in Figure 3A. In constructing the NSCT, care must be taken when applying the directional filters to the coarser scales of the pyramid. Owing to the tree structure nature of the NSDFB, the directional response at the lower and upper frequencies suffers from aliasing, which can be a problem in the upper stages of the pyramid. The high-pass channel is filtered of the directional filter passband, which results in severe aliasing and, in some observed cases, a considerable loss of directional resolution. Upsampling the NSDFB filters can remedy this. Denote the kth directional filter by Uk(z). Then, for higher scales, we can substitute
Filtering with the upsampled filters does not increase computational complexity. Specifically, for a given sampling matrix S and a 2-D filter H(z), to obtain the output Y[n] resulting from filtering X(n) with H(zs), we use the convolution formula:
This is the à trous filtering algorithm. Therefore, each filter in the NSDFB tree has the same complexity as that of the building-block fan NSFB. Likewise, each filtering stage of the NSP has the same complexity as that incurred by the first stage. Thus, the complexity of the NSCT is dictated by the complexity of the building-block NSFBs. If each NSFB in both NSP and NSDFB requires L operations per output sample, then for an image of N pixels, the NSCT requires about BNL operations where B denotes the number of subbands. If the building-block two-channel NSFBs in the NSP and NSDFB are invertible, then clearly the NSCT is invertible. It also underlies a frame expansion. The frame elements are localized in space and oriented along a discrete set of directions. The NSCT is fiexible in that it allows any number of 2l directions in each scale. In particular, it can satisfy the anisotropic scaling law, which is a key property in establishing the expansion nonlinear approximation behavior [2]. This property is ensured by doubling the number of directions in the NSDFB expansion at every other scale. The NSCT has redundancy given by
Figure 4 shows the NSCT decomposition results of a 512 × 512 image that is decomposed into three scales. The high frequency is decomposed into eight directional subbands in the first scale and two directional subbands in the second scale. As can be seen from Figure 4, the singularity features of the original image obtained a coarse-to-fine presentation from first to third scale, respectively. Moreover, most coefficients in the subbands of the finest scale correspond to useful information of the image.
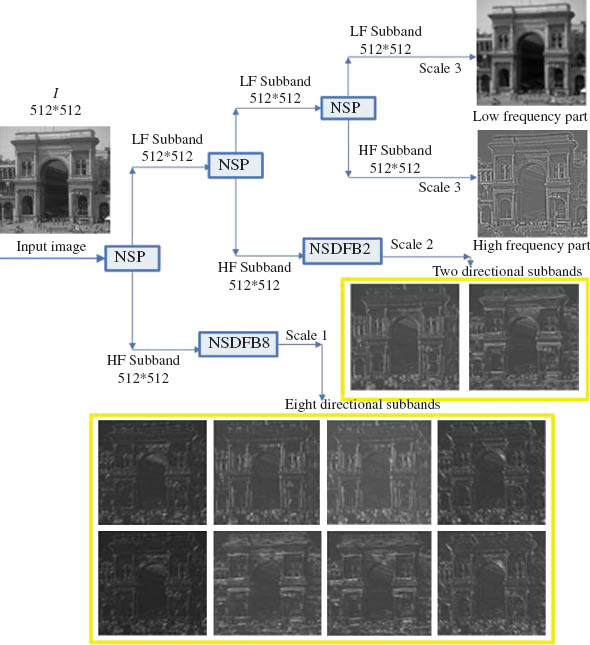
An Example of the NSCT Decomposition on a 512 × 512 Image.
4 Image Enhancement Algorithm via the NSCT
Practically, images contain strong edges, weak edges, and noise. In the frequency domain, both weak edges and noise produce low-magnitude coefficients. The existing image enhancement methods amplify noise while they amplify weak edges, as they cannot distinguish noise from weak edges very well. The NSCT can enhance the contrast between weak information and the background, while suppressing noise and maintaining signals as far as possible without loss. Thus, we propose a novel image enhancement method via the NSCT to enhance images.
The NSCT is shift invariant so that each pixel of the transform subbands corresponds to that of the original image in the same spatial location. Therefore, we gather the geometrical information pixel by pixel from the NSCT coefficients. There are three classes of pixels: strong edges, weak edges, and noise. First, the strong edges correspond to those pixels with large-magnitude coefficients in all subbands. Second, the weak edges correspond to those pixels with large-magnitude coefficients in some directional subbands but small-magnitude coefficients in other directional subbands within the same scale. Finally, the noise corresponds to those pixels with small-magnitude coefficients in all subbands. On the basis of this rule, we can classify pixels into three categories by analyzing the distribution of their coefficients in different subbands. Therefore, the key and difficulty of image enhancement are signal classification through selected threshold and enhancement signals through the generalized nonlinear gain function.
4.1 Noise Standard Deviation Estimation and Threshold Setting
If the threshold is too small, the filtered noise signal is still there. However, if the threshold value is too large, the important image features will be filtered out, thus causing image distortion. We use the similarity of the noise and reflectance component to perform threshold setting independently in each subband [24].
For the coefficient of pixel (x, y) at the dth directional subband of the sth scale, the noise variance σd,s is calculated by Eq. (3):
where
Here,
We can perform threshold calculation independently in each subband and choose the threshold. We set the threshold Td, s to classify the three categories’ coefficients in the NSCT domain. The threshold value Td, s is shown as
Here, λ=1, 2, 3, 4, 5, and we can estimate the noise variance by using the robust median estimator in the highest subband of the transform.
4.2 Nonlinear Mapping Function
An ideal design for a nonlinear mapping function should have the following properties [9]: (i) sharp edges should not be blurred; (ii) low-contrast parts should be enhanced more than high-contrast parts; (iii) the nonlinear function should have monotonicity, keeping the location of the local extremum and avoiding generating a new extremum; and (iv) the nonlinear function should possess antisymmetry, preserving the polarity of phases and avoiding the phenomenon of ringing artifacts. Different nonlinear mapping functions possessing the above properties are used in Refs. [9, 11]. However, the functions are with many preferences and unpractical. In this article, we propose a new nonlinear mapping function in the NSCT domain that suppresses noise while amplifying edges. The proposed nonlinear mapping function is combined with a region energy function.
We define region energy by computing the sum of the coefficients’ square in the eight-neighbor window. Coefficient characteristics of contourlet also have been studied in Ref. [14]. It indicates that the eight neighbor coefficients contain the most information about the coefficients, which can amplify weak edges. Suppose cd,s(x, y) is the high-frequency NSCT coefficient, whose location is (x, y) in the subband of the dth direction at the sth decomposition scale. The region energy is defined as follows:
where WM*N denotes the regional window and its size is M × N (typically 3 × 3). Region energy, rather than single pixel value, will be more reasonable to extract features of the source images by using the neighbors’ information. Large region energy means important image information.
We improve da Cunha et al.’s enhancement method [3] and modify the NSCT coefficient according to the category of each pixel by a nonlinear mapping function described as follows:
Here, the input cd,s(x, y) is the original coefficient, and 0<P<1 is the amplifying gain. Mean and Max are respectively the mean and maximum coefficient in the sth scale and dth directional subband. The nonlinear mapping function Yd,s(x, y) keeps the coefficients of strong edges, amplifies the coefficients of weak edges, and zeros the noise coefficients.
4.3 The Proposed Algorithm
The novel image enhancement algorithm using the NSCT can be summarized in the following steps:
Step 1. Compute the NSCT of the input image for L-levels.
Step 2. Estimate the noise standard deviation of the input image.
Step 3. For each level of the pyramid
Estimate the noise variance with Eq. (3).
Perform threshold calculation of the input image with Eq. (4).
At each pixel location, compute the magnitude of the corresponding coefficients cd,s(x, y) and region energy Ed,s(x, y) with Eq. (5) in all directional subbands at this level, and classify each pixel according to the threshold shown in Eq. (6) into “strong edges,” “weak edges,” or “noise.”
For each directional subband, given the factors P, use the nonlinear mapping function given in Eq. (7) to modify the NSCT coefficients according to the classification.
Step 4. Reconstruct the enhanced image from the modified NSCT coefficients.
5 Experimental Results and Analysis
5.1 Experimental Results
To demonstrate the performance of the proposed algorithm, we carried out several experiments on a number of low-contrast images. Results from the proposed algorithm are compared with other image enhancement algorithms, such as the adaptive histogram equalization (AHE [1]) method, the improved Butterworth filtering (IBF [15]) method, and the NSWT [10] method. In each row of Figure 5, images A to E represent the original image, the result of the AHE method, the result of the IBF method, the result of the NSWT method, and the result of the proposed method. In the proposed method, source images are transformed by a three-scale and four-direction NSCT. The filters should be short to keep the computational burden low and avoid smearing of image details. Therefore, we used “maxflat” NSLP and “dmaxflat7” NSDFB in the NSCT. For enhancing detail and contrast, we set λ = 3 or 4 and P= 0.71 for each respective subband in our experiments for simplification.
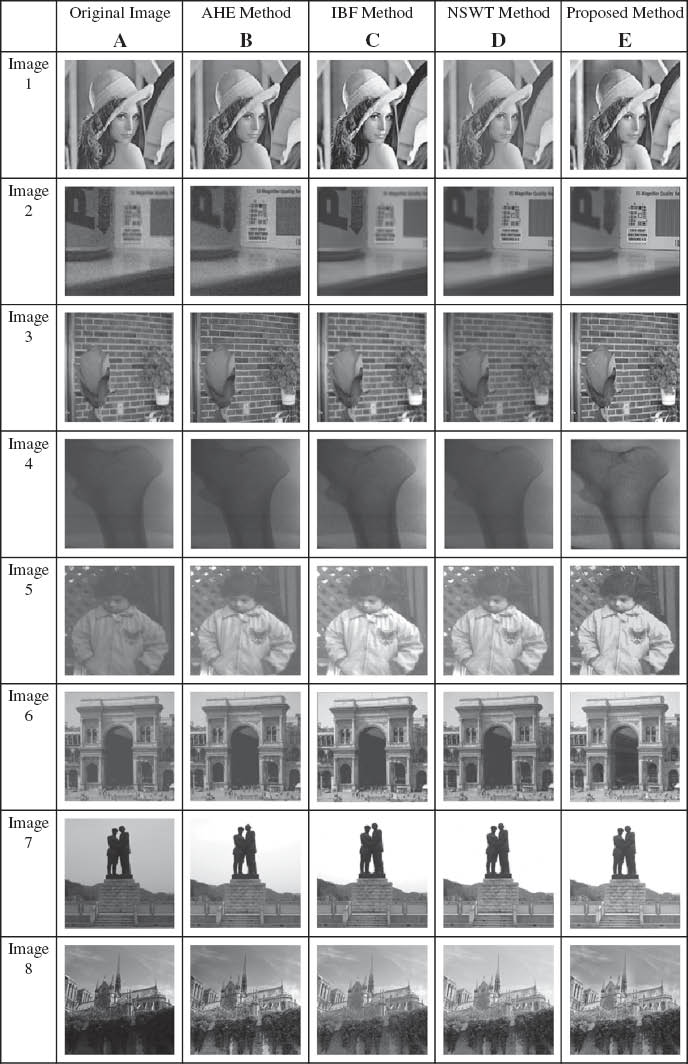
Comparison of Different Methods.
5.2 Discussion and Analysis
From images 1B–8B in Figure 5, we can see that as the original images have large homogeneous regions, the AHE method fails in enhancing the images because the noise in smooth regions has been greatly magnified and the brightness has been largely changed, which makes the enhanced image look rather unnatural. Meanwhile, the IBF method outperforms the AHE method, and there also exists change in brightness from images 1C–8C. The AHE and IBF methods cannot extract geometrical information and find exact edge information that is useful for image enhancement. As a result, they give poor performance than our method in contrast enhancement. Now, we focus on the comparison of our method with the NSWT method. The NSWT method can obtain better result among these representative methods. From images 1D,E–8D,E, we can see that the image using our method is much clearer and presents more subtle tissue that cannot be shown by NSWT. In each row of Figure 5, the comparison of both methods highlights that our method can obtain exact and concrete tissues, and our proposed algorithm can offer better results in enhancing the weak edges in the textures.
To validate our experiments, objective evaluations of the enhanced images were performed. We used measures such as information entropy (IE) and space frequency (SF). The results of the objective testing are summarized in Tables 1 and 2.
Comparison of IE.
| Original Image | AHE Method | IBF Method | NSWT Method | Proposed Method | |
|---|---|---|---|---|---|
| Figure 5.1 | 7.2455 | 3.3673 | 5.1017 | 5.7961 | 7.3157 |
| Figure 5.2 | 7.0514 | 4.2748 | 5.0121 | 5.7486 | 7.0796 |
| Figure 5.3 | 7.0186 | 4.1216 | 4.8112 | 5.6683 | 7.1012 |
| Figure 5.4 | 6.1916 | 3.5375 | 4.3307 | 4.9322 | 6.2204 |
| Figure 5.5 | 3.9925 | 2.8706 | 3.8374 | 4.0421 | 5.8712 |
| Figure 5.6 | 4.5807 | 2.9286 | 4.6844 | 4.7732 | 5.2878 |
| Figure 5.7 | 4.8198 | 2.4394 | 4.4843 | 4.4512 | 6.0213 |
| Figure 5.8 | 5.8109 | 3.6071 | 5.1250 | 5.2597 | 6.8310 |
Comparison of SF.
| Original Image | AHE Method | IBF Method | NSWT Method | Proposed Method | |
|---|---|---|---|---|---|
| Figure 5.1 | 12.8401 | 13.9266 | 14.8751 | 16.6434 | 17.5416 |
| Figure 5.2 | 5.0655 | 4.5655 | 4.8860 | 4.8990 | 5.1508 |
| Figure 5.3 | 4.6374 | 4.9084 | 4.9166 | 5.0333 | 5.2088 |
| Figure 5.4 | 4.3503 | 4.4523 | 4.7289 | 4.5473 | 5.0221 |
| Figure 5.5 | 6.3053 | 7.6296 | 9.8724 | 9.9761 | 11.3262 |
| Figure 5.6 | 10.4951 | 10.9821 | 14.1464 | 15.5746 | 19.8104 |
| Figure 5.7 | 15.3559 | 16.6493 | 18.4654 | 17.8083 | 19.2601 |
| Figure 5.8 | 17.8706 | 18.1095 | 19.9873 | 21.3210 | 23.6527 |
5.2.1 Information Entropy
IE can be used to analyze and compare the enhancement results between our proposed algorithm and those representative methods quantitatively. It can be calculated by the following formula:
Table 1 shows the detailed IE of each image shown in Figure 5. We can see that our method can keep the IE well in contrast to the original image, while all other methods lose certain information to some extent.
5.2.2 Spatial Frequency
The SF, which originates from the human visual system, indicates the overall active level in an image. The human visual system is too complex to be fully understood with present physiological means, while the use of spatial frequency has led to an effective objective quality index for image enhancement. Consider an image of size M× N, where M equals the number of rows and N the number of columns. The spatial frequency of an image is defined as the following formula:
Table 2 shows the detailed SF of each image shown in Figure 5. We can see that the NSCT method can provide larger SF value than other methods. The quantitative measure shows the better performance of our method in contrast enhancement, which is consistent in IE measure. This also indicates that the NSCT-based enhancement approach works well and brings some advantages especially in the applications of images with rich texture.
6 Conclusion
The linear contrast–extension method elevates the brightness of an image and magnifies noise at the same time, so it can hardly enhance all parts of the image simultaneously. Spatial nonuniform methods are single-scale spatial domain methods and can only enhance the contrast of a narrow range of sizes. Image enhancement methods based on wavelet transforms are difficult to use for extracting geometrical information of the decomposed image because they decompose images in a separable way and cannot find exact edge information that is useful for image enhancement. It is proven that NSCT is shift invariant and can overcome the pseudo-Gibbs phenomena around singularities. To improve the contrast of images for further analysis, we proposed an improved algorithm based on the NSCT and the thresholding method in this article. The eight neighbor coefficients contain the most information about the coefficients, which can amplify weak edges. We used region energy function including eight neighbor coefficients, rather than single pixel value, to enhance weak edges of source images. The key and difficulty of image enhancement are signal classification through selected threshold and enhancement signals through the generalized nonlinear gain function. We improved the nonlinear mapping function, which can keep the coefficients of strong edges, amplify the coefficients of weak edges, and zero the noise coefficients. Three experiments were done respectively on images from subjective vision quality and objective evaluations measures such as IE and SF. Experiments on different images have shown that our method performs well in enhancing the local contrast of an image while maintaining its global appearance. The results obtained with the proposed approach are superior to representative methods such as AHE, IBF, and NSWT, both visually and with respect to objective measurements. It may provide some new solutions for existing problems in the image enhancement domain.
Acknowledgments
This work is supported by the National Key Technology Research and Development Program of the Ministry of Science and Technology of China (no. 2012BAC11B01-04) and by the Higher School Funding in Key Discipline Construction in Jiangxi, China. We are grateful to the anonymous referees for useful comments and suggestions.
Bibliography
[1] M. Abdullah-Al-Wadud, M. H. Kabir, M. A. A. Dewan and C. Oksam, A dynamic histogram equalization for image contrast enhancement, IEEE Trans. Consumer Electron.53 (2007), 593–600.10.1109/TCE.2007.381734Search in Google Scholar
[2] E. J. Candès and D. L. Donoho, New tight frames of curvelets and optimal representations of objects with piecewise C singularities, Commun. Pure Appl. Math57 (2004), 219–266.10.1002/cpa.10116Search in Google Scholar
[3] A. L. da Cunha, J. Zhou and M. N. Do, The nonsubsampled contourlet transform: theory, design, and applications, IEEE Trans. Image Process.15 (2006), 3089–3101.10.1109/TIP.2006.877507Search in Google Scholar
[4] M. N. Do and M. Vetterli, The contourlet transform: an efficient directional multiresolution image representation, IEEE Trans. Image Process.14 (2005), 2091–2106.10.1109/TIP.2005.859376Search in Google Scholar PubMed
[5] R. Eslami and H. Radha, Wavelet-based contourlet transform and its application to image coding, Presented at the 2004 International Conference on Image Processing, ICIP ’04, 2004.Search in Google Scholar
[6] R. Eslami and H. Radha, Translation-invariant contourlet transform and its application to image denoising, IEEE Trans. Image Process.15 (2006), 3362–3374.10.1109/TIP.2006.881992Search in Google Scholar PubMed
[7] Y.-T. Kim, Contrast enhancement using brightness preserving bi-histogram equalization, IEEE Trans. Consumer Electron.43 (1997), 1–8.10.1109/30.580378Search in Google Scholar
[8] C. Lee, Y.-Y. Lee and C.-S. Kim, Power-constrained contrast enhancement for emissive displays based on histogram equalization, IEEE Trans. Image Process.21 (2012), 80–93.10.1109/TIP.2011.2159387Search in Google Scholar PubMed
[9] K. Li, X. Chen, X. Hu, X. Shi and L. Zhang, Image denoising and contrast enhancement based on nonsubsampled contourlet transform [C], in: 3rd IEEE International Conference on Computer Science and Information Technology (ICCSIT), Vol. 2, pp. 131–135, 2010.Search in Google Scholar
[10] Z. Liu and H. Xu, Image denoising with nonsubsampled wavelet-based contourlet transform, in: Fifth International Conference on Fuzzy Systems and Knowledge Discovery, pp. 301–305, 2008.10.1109/FSKD.2008.458Search in Google Scholar
[11] Z. Lu, T. Jiang, G. Hu and X. Wang, Contourlet based mammographic image enhancement, in: Fifth International Conference on Photonics and Imaging Biology and Medicine, Proceedings of SPIE, vol. 6534, part 1, p. 65340M, 2007.Search in Google Scholar
[12] L. Meylan and S. Susstrunk, High dynamic range image rendering with a Retinex-based adaptive filter, IEEE Trans. Image Process.15 (2006), 2820–2830.10.1109/TIP.2006.877312Search in Google Scholar PubMed
[13] W. M. Morrow, R. B. Paranjape, R. M. Rangayyan and J. E. L. Desautels, Region-based contrast enhancement of mammograms, IEEE Trans. Med. Imag.11 (1992), 392–406.10.1109/42.158944Search in Google Scholar PubMed
[14] E. Nezhadarya and M. B. Shamsollahi, Image contrast enhancement by contourlet transform, in: Multimedia Signal Processing and Communications, 48th International Symposium ELMAR-2006, Zadar, Croatia, pp. 81–84, 2006.10.1109/ELMAR.2006.329520Search in Google Scholar
[15] J. Oh and H. Hwang, Feature enhancement of medical images using morphology-based homomorphic filter and differential evolution algorithm, Int. J. Control Autom. Syst.8 (2010), 857–861.10.1007/s12555-010-0418-ySearch in Google Scholar
[16] P. Feng, Y. Pan, B. Wei, W. Jin and D. Mi, Enhancing retinal image by the Contourlet transform, Pattern Recognit. Lett.28 (2007), 516–522.10.1016/j.patrec.2006.09.007Search in Google Scholar
[17] D. D. Y. Po and M. N. Do, Directional multiscale modeling of images using the contourlet transform, IEEE Trans. Image Process.15 (2006), 1610–1620.10.1109/TIP.2006.873450Search in Google Scholar
[18] A. Polesel, G. Ramponi and M. V. John, Image enhancement via adaptive unsharp masking, IEEE Trans. Image Process.9 (2000), 505–510.10.1109/83.826787Search in Google Scholar PubMed
[19] M. Qiguang and W. Baoshu, A novel image fusion method using contourlet transform, in: 2006 International Conference on Communications, Circuits and Systems Proceedings, Guilin, Vol. 1, pp. 548–552, 2006.10.1109/ICCCAS.2006.284696Search in Google Scholar
[20] P. Sakellaropoulos, L. Costaridou and G. Panayiotakis, A wavelet-based spatially adaptive method for mammographic contrast enhancement, Phys. Med. Biol.48 (2003), 787–803.10.1088/0031-9155/48/6/307Search in Google Scholar PubMed
[21] M. J. Shensa, The discrete wavelet transform: wedding the à trous and Mallat algorithms, IEEE Trans. Signal Process.40 (1992), 2464–2482.10.1109/78.157290Search in Google Scholar
[22] J. A. Stark, Adaptive image contrast enhancement using generalizations of histogram equalization, IEEE Trans. Image Process.9 (2000), 889–896.10.1109/83.841534Search in Google Scholar PubMed
[23] J. N. Suran, A. Durham, W. Mai and G. S. Seiler, Contrast enhancement of extradural compressive material on magnetic resonance imaging, Vet. Radiol. Ultrasound52 (2011), 10–16.10.1111/j.1740-8261.2010.01734.xSearch in Google Scholar
[24] X. Xie, J. Lai and W. S. Zheng, Extraction of illumination invariant facial features from a single image using nonsubsampled contourlet transform[J], Pattern Recognit.43 (2010), 4177–4189.10.1016/j.patcog.2010.06.019Search in Google Scholar
[25] Y. Xu, J. B. Weaver, D. M. Healy and J. Lu, Wavelet transform domain filters: a spatially selective noise filtration technique, IEEE Trans. Image Process. 3 (1994), 747–758.10.1109/83.336245Search in Google Scholar PubMed
©2014 by Walter de Gruyter Berlin/Boston
This article is distributed under the terms of the Creative Commons Attribution Non-Commercial License, which permits unrestricted non-commercial use, distribution, and reproduction in any medium, provided the original work is properly cited.