
Abstract
Research on internal waves in the coastal ocean is one of the most important tasks both in physical oceanography and ocean monitoring network. Currently, how to quickly and accurately detect the ocean internal waves from the huge ocean surface is still a challenging issue. In this paper, we model the ocean internal wave detection as a task of region classification for texture images and then propose a rapid internal waves detection method based on a deep learning framework (PCANet). In the proposed method, two models have been trained: one is the deep feature representation model, which combines principal component analysis (PCA), binary hashing, and block-wise histograms and can extract more distinguishing features than handcraft feature. Moreover, because the filter learning in PCANet does not require regularized parameters and numerical optimization solver, the training process of the representation model is very fast. The other one is a classification model based on a linear support vector machine. The object proposal method has been applied to get the possible candidates when analyzing a captured image, which dramatically decreases the searching time. Experiment results on the data set captured by unmanned aerial vehicles verify the speed ability and effectiveness of the proposed method.
1 Introduction
To monitor and explore ocean, wide-area secure ocean networks [24], [25], [33] should be designed to collect information from different types of sensors [34] such as largely static with power tether, autonomous underwater vehicles [12], [41], unmanned aerial vehicles (UAV) [3], [7], [40] and satellites. Internal wave phenomenon is widespread in the ocean [10], [14], [15]. Because it can significantly affect oceanic current measurements, undersea navigation, antisubmarine warfare operation [2], [28] and the security of ocean network, internal wave and its side effects have been studied in various aspects. Traditional internal wave detection methods [5], [13], [19], [21] usually obtain data from the synthetic aperture radar (SAR), and then internal wave can be mapped on the SAR image according to the sensitivity of SAR data [1], [23], [31], which changes with small-scale surface roughness. However, it is impossible to repeatedly observe the same wave packet over a short period of time. Though the low-altitude aerial oblique photograph can compensate the shortcomings of SAR image, a very large ocean surface can be covered, and short time change of internal waves can be observed with UAV, how to detect the internal waves rapidly and accurately is still a challenging task right now.
With the development of deep learning and computer vision, the real-time and efficient internal wave detection based on UAV become possible. In this paper, we propose a novel method based on deep learning for internal wave detection. A fast and accurate deep learning network PCANet [9] is used to detect the internal waves. PCANet is a deep feature learning network which can combine principal component analysis (PCA), binary hashing, and block-wise histograms effectively, and experimental results show that the proposed scheme can achieve the state-of-the-art performance in the detection of ocean internal waves.
Our method includes two stages. The first stage is model training stage. With the captured images by UAV, we randomly select image patches to generate a raw data set. To reduce the computation cost, the images in the data set will be converted to gray level and normalized to the size of 28×28. Then the normalized image patches are trained to get a PCANet. The learned deep PCANet can be used to extract the distinguishing feature representation of internal waves under different conditions. Then a linear support vector machine (SVM) classification model can be obtained with the extracted feature. In the matching stage, object proposals method [18], [30], [37] is applied to the input image to get the possible candidates, and then we transfer the candidates patches to the trained PCANet and SVM classification model. According to the positive classification results, the accurate positions of the internal waves can be detected and localized.
There are five sections in this paper. After the introduction section, the nonlinear near surface internal waves was introduced in Section 2. In Section 3, feature learning algorithm with PCANet is introduced. In Section 4, performance of the internal wave detection framework was evaluated with the data set captured by UAV. Final conclusions were addressed in Section 5.
2 Related Works
2.1 Nonlinear Near-Surface Internal Waves
Internal wave is widely observed in the ocean, particularly in the relatively shallow waters such as Yellow Sea [36]. Internal wave occurs within subsurface layers of marine waters that are stratified due to temperature and salinity variations. Internal waves are observed throughout the year since the tropical waters are stratified. Disturbance created within the ocean gives rise to these waves, which represent a significant mechanism for transport of momentum and energy within the ocean [11].
Internal wave plays a significant role in maintaining the ocean circulation and global climate. Moreover, internal wave has certain impacts on human activities, such as platform drillings in industry and submarine voyages in the military field [32]. Sea water would have strong inertia wave and stress force induced by the massive energy of internal wave; thus, it can influence human being activities significantly. In this work, related algorithms and techniques for automated detection of internal wave features from the image of internal waves are discussed. There are many in situ observations of internal waves in the ocean [1], [11], [24], [26]. The parameters of nonlinear internal waves which are founded in the nonlinear theory can be inversed. The nonlinear theory takes advantage of water column data, which are composed from in situ observations. Theories of nonlinear waves could be significantly persuasive when analyzed, based on small but limited amplitudes. The observed wave packets demonstrated almost all the time rank-ordered, and the larger well-separated waves at their leading edge could be segregated as solitary-like waves. After that, the mathematical theory of solitary waves, which are derived under diversified assumptions, probably could be utilized as an effective guidance to their behavior and at the same time motivate impressive accurate predictions occasionally. There are various widely used wave models, such as Korteweg-de Vries (KDV) [29], Benjamin-Ono (BO) [4] and intermediate long wave (ILW). The KDV is the most appropriate model when applied into successful prediction of experimental or observational solitons. Even for large amplitude solitary, for example waves which are outside of the strict assumption of the KDV theory, while BO or ILW theory appears not to do so [8], [20], [22], [35].
Based on the model, numerical simulation was carried out, and the parameters of nonlinear internal waves such as phase speed were inversed. Under the assumption of weak non-linear, weak dispersion, the KDV equation is shown in the following form:
where θ is the vertical displacement of isopycnal surface from its equilibrium level, t is time, and α, γ and C0 are environmental coefficients describing nonlinearity, dispersion and long-wavelength phase speed, respectively. Soliton solutions to this equation take the form of
with phase speed of
and a soliton half width of
where
In situ observations of internal waves have been improved with the development of monitoring sensors and instruments [6], [38]. However, these data sets achieved from these measuring devices are usually not well suited for making precise measurements of wave speed and direction. Sometimes, these measuring devices are expensive and also face the difficulties of the installation influenced by the sea conditions when deployed in the ocean, the measurement of the spatial coverage and resolution also insufficient. On the other hand, photogram metrically rectified oblique photo images from a circling aircraft are used to track a number of internal wave packets for periods of up to 1 h, which makes highly accurate measurements of wave propagation speeds and directions possible.
2.2 Object Detection Methods Based on Deep Learning
Internal wave detection belongs to the object detection problem, and object detection is one of the long-standing and important problems in computer vision, which is a more challenging problem than classification since it intrinsically includes the problem of object localization. With the high capacity of deep convolutional neural networks (CNNs), object detection has recently made ground-breaking advances. Object detection based on deep CNNs [37] can be divided into two branches: region based method [37] and regression based method [30].
2.2.1 Region Based Detection
Region-based CNN (RCNN) [17] framework is the first and most notably region-based method. To address the localization problem, RCNN uses region proposal techniques generating hundreds or thousands of candidate bounding boxes which include an object with high probability and refer to detection as a classification problem which uses deep CNN to classify the candidate boxes. RCNN surpassing traditional deformable parts model framework by a large margin in mAP, it suffers from severe localization errors even though it has exploited bounding box regression as a post-processing step which only helps on small localization errors. Fast RCNN [16] employs several innovations accelerating detection speed while also increasing detection accuracy. By introducing a multi-task loss, it can simultaneously classify objects and regress bounding boxes to target location. Despite the success of fast RCNN, it still struggles with inaccurate localization that causes the most severe errors. This inaccurate localization mainly stems from the proposal method which generates candidates only providing rough localization rather than precise localization. Even though faster RCNN proposes a region proposal networks that can generate better proposal, there is still a large space to further advanced detection performance by refining the bounding boxes.
2.2.2 Regress-Based Detection
Bounding box regression is a commonly used paradigm to refine bounding box coordinates. Even region-based methods described above introduce regression step to refine bounding box and boost the mAP [30]. However, directly regressing the bounding box to the target coordinates is a difficult learning task that cannot yield accurate enough bounding boxes. You only look once frame object detection is viewed as a regression problem, it simply utilizes a single neural network model to predict bounding boxes and class probabilities directly from full images, so that the accuracy is not optimal. But it is less likely to predict false positives in the background due to the use of global features in training and testing stage which implicitly encodes contextual information about classes as well as their appearance.
Single shot multibox detector (SSD) [27] is a unified and fast single shot object detector for multiple categories using a single deep neural network. SSD approach discretizes the output space of bounding boxes into a set of bounding box priors over different aspect ratios and scales per feature map location. At prediction time, the network generates confidences that each prior corresponds to objects of interest and produces adjustments to the prior to better match the object shape. Additionally, the network combines predictions from multiple feature maps with different resolutions to naturally handle objects of various sizes.
PCANet [9] is a very simple deep learning network for image classification which comprises only the very basic data processing components: cascaded PCA, binary hashing and block-wise histograms. PCANet can be designed and learned extremely easily and efficiently. The PCANet serves as a simple but highly competitive baseline for texture classification and object recognition. This simple CNN improves some defects of classic CNNs such as too long training time, need for special tuning parameters and technique problems. This allows for training networks with many features, making them insensitive to variability between classes.
3 Our Method
Our proposed method includes two parts: (1) the first part is the model training: we use PCANet and SVM to train a classification model [see Figure 1 (top)]; (2) the second part is detection: we use selective search method [39] to produce proposals. Then we use trained PCANet models to extract the proposals features and use SVM models to classify them.

The flow chart of internal waves detection framework based on PCANet.
3.1 Model Training
PCANet is a relatively simple deep learning network, which is easy to train for and can be applied in different tasks in computer vision, including face classification and optical character recognition. The basic architecture of PCANet is shown in Figure 2. The training of PCANet has three stages: the first two stages are based on PCA and in the last stage, hashing (in order to produce nonlinear output) and histogram are used to demonstrate the results [9].
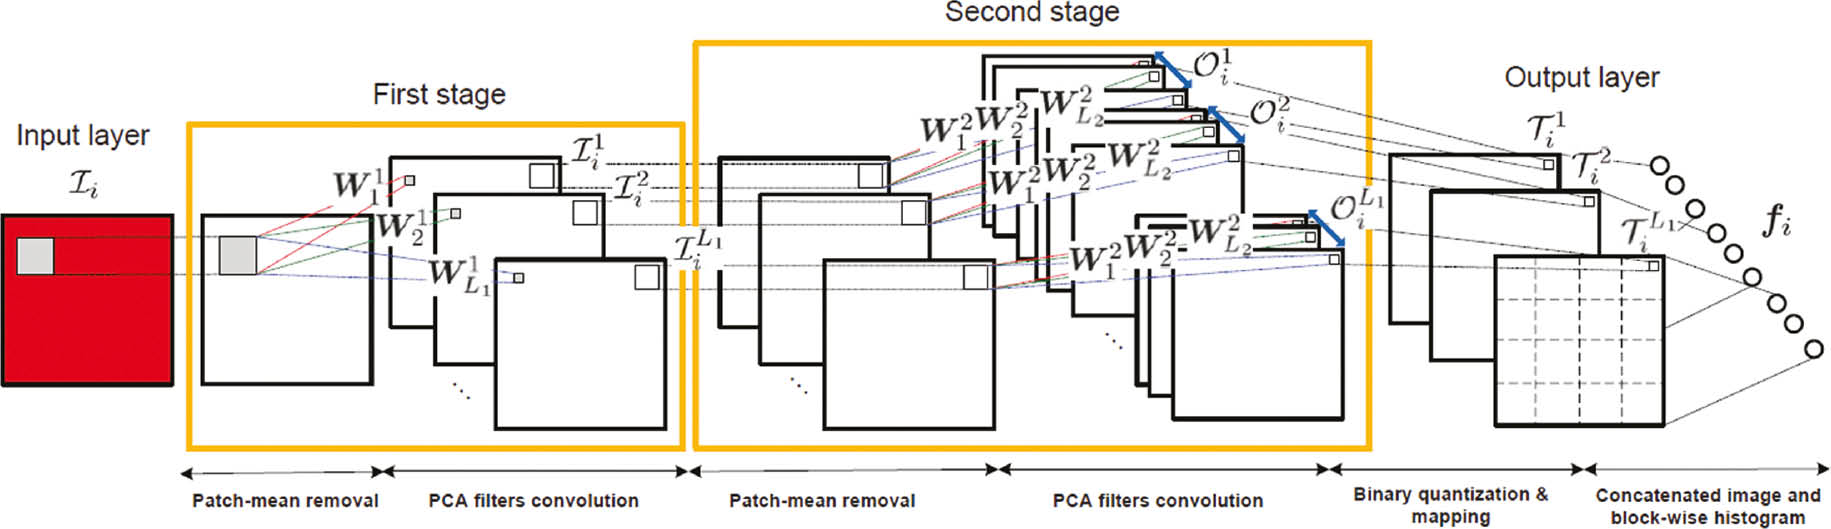
The structure of the two-stage PCANet.
Consider an image with m×n pixels in size C there are N images in the training set. In each image, a patch of size k1×k2 around each pixel was taken, as shown in Figure 3. All the patches are collected, vectored and combined into a matrix of k1×k2 rows and (m−k1+1)×(n−k2+1) columns.
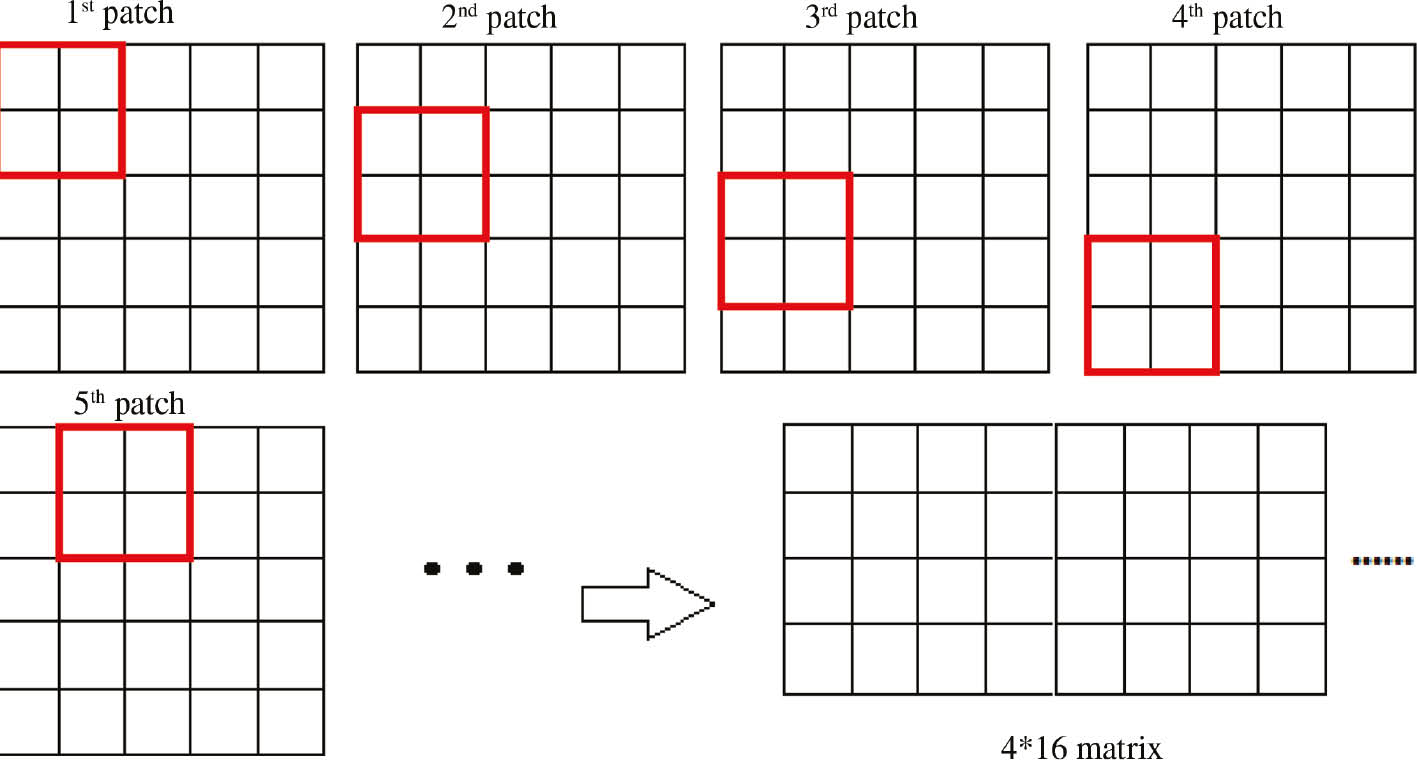
Illustration of patch taking for a 5×5 image.
For example, in the image Ii, a matrix Xi was obtained; thus, the patch mean from each patch was subtracted, obtaining
where c indicates the number of rows of Xi. Then, the eigenvectors of XXT was obtained, and the ones corresponding to the L1 maximum eigenvalues as the PCA filters were saved, which can be expressed as
The leading principal eigenvectors capture the main variation of all the men-removed training patches. The first stage was finished at this stage. At the second stage, a similar process with stage 1 was applied. The input images
the boundary of Ii is zero-padded so that
in which the Yl was combined together as a matrix:
The PCA filters of the second stage are then obtained as
For each input
At the final stage, for each input image of stage 2, and around each pixel, we view the vector of L2 binary bits as a decimal number. This converts the L2 outputs in
The function H(·) binaries output results, i.e. the value of the function is 1 for positive inputs and 0 otherwise. For each of the L1 images
As the PCANet was used to extract the features of the images of internal waves, the normal water surface pictures were labeled with 0 and waves pictures were labeled with 1. The model parameters of PCANet include the patch sizes k1, k2, the filters numbers L1, L2, the number of stages and the block size for histograms. In the experiments, we resize each image into 60×60, patch size 7×7, stage number 2, L1=L2=8 and the block size 7×7 was set. We extract features from PCANet, and then put it into a linear SVM for classification with the attached labels.
Training feature templates consist of train and detect. For the Train part: Firstly, the size of the current template was set. Secondly, the size of positive samples and negative samples were set as the template size, and the samples feature was extracted by PCANet. Then, training was started using linear SVM. As for the detection part: extracting feature vectors and detecting negative images and then overall detection. At this time wrong result was obtained. The result needed to be added to negative samples and trained again. This process may be repeated several times until the error is minimized.
3.2 Matching
Our internal wave detection framework consists of two parts. Category-independent region proposals, which define the set of candidate detections available, will be generated in the first part. The second part is convolutional network that extracts a fixed-length feature vector from each region.
In order to compute features for a region proposal, the image data in the region must be converted into a new one that is compatible with the CNN. Within the many possible transformations of our arbitrary-shaped regions, the simplest one is preferable. Regardless of the size or aspect ratio of the candidate region, we warp all pixels in a tight bounding box around it to the required size. Prior to warping, the tight bounding box is dilated so that at the warped size there are exactly several pixels of warped image context around the original box.
The convolutional networks used in this work require a fixed-size input in order to produce a fixed-size output. For detection, waves proposals that are arbitrary image rectangles are considered. The method encloses each wave proposal inside the tightest square and then scales the image contained in that square to the CNN input size. There is a variant on this method, which means excluding the image content that surrounds the original wave proposal. In the meantime, including additional image context around the original wave proposal should be also taken into consideration.
4 Experiments
This section verifies the feasibility of the technique for internal wave detection. We first introduce the data sets. We then introduce the application of our method on two data sets collected in the lab.
4.1 Data Sets
We evaluate the proposed approach on two different data sets. The two data sets were both taken by the DJI Drone (DJI Innovations, Shenzhen, China). The first data set is composed of the simulative wave images. The second data set consists of the inshore surge wave images. Figure 4 shows some samples of our data sets. In the two data sets, we use both the patches as the positive and negative samples for training. For positive samples, we get the patches from the image after the resize process in order to get the clearer waves. And for the negative samples, because we need more details to distinguish between the wave and no wave, we get the patches from the original image. In the next two experiments, we select both 1000 positive samples and 1000 negative samples.

Image samples of our data set. First row represents simulative wave images, while second row represents the inshore surge wave images.
4.2 Experiment on the Simulative Waves
The data set was taken by the DJI Drone. During the shooting process, the camera took photos by looking straight down from the belly of the drone over the water surface. First, the drone was hovering over the water surface, and photos of calm water surface were taken based on regular intervals. Then the production of waves was simulated, and pictures were taken to track the waves.
To get the best model for wave detection, we cut out the positive and negative samples from an original picture manually. Figure 5 shows some training samples cut from original images. Every image includes three categories of samples: (1) negative samples with labels of 0, which means calm water surface; (2) positive samples with labels of 1, which represent simulating the production of waves; (3) noise samples are the samples that are difficult to distinguish by machine.
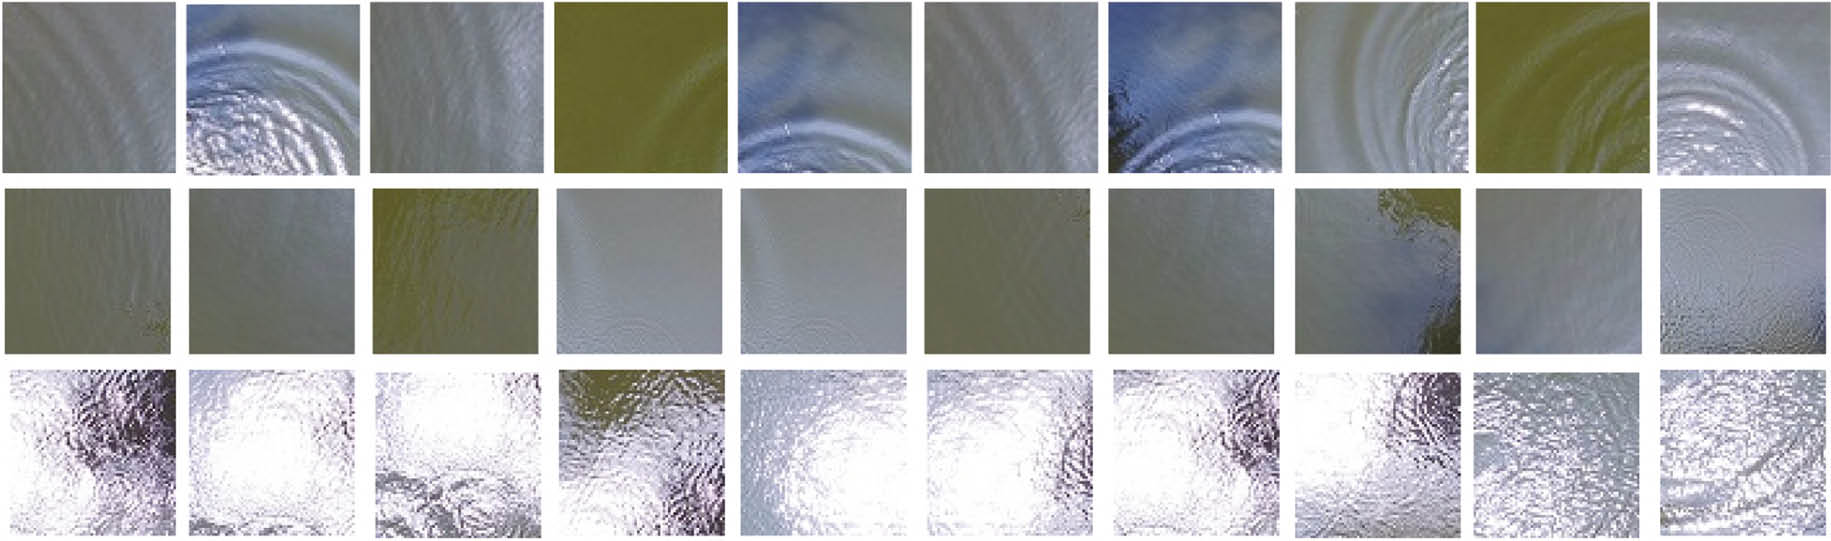
Image patches of three types of simulative wave samples. First row represents positive samples, second row represents the negative samples and third row represents the noises.
In order to reduce the use of memory and increase the contrast, we use binarization and resizing process. An image includes the object, background and noise. To extract directly the target object from the digital image and multiple values, the most commonly used method is to set a threshold of T; image can be divided into two parts by T: the pixel group is greater than T or less than T. After binarization, we resize the samples to 28×28. The result of this process is shown in Figure 6. From the table, we can see that the positive samples are black, while the negative samples are black-and-white. It is easy to distinguish the category of samples. Then the samples were put into PCANet to extract the features, and trained linear SVM classifier to detect the waves.
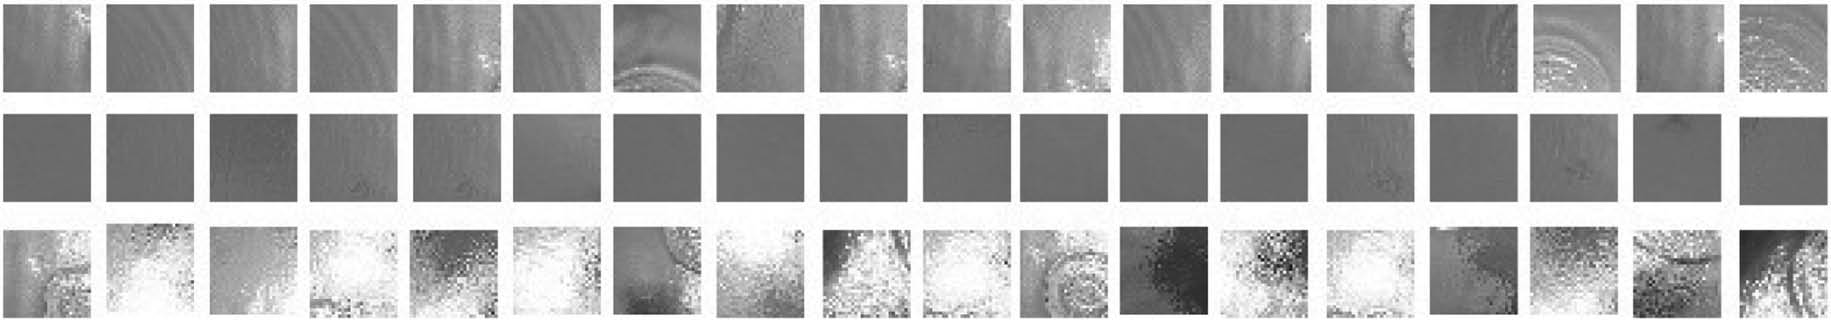
Image patches after binarization processing. First row represents positive samples, second row represents the negative samples and third row represents the noises.
We use selective search method to produce proposals which achieve state-of-art result in proposal domain. For a whole image, we produce 1000 proposals and then, we use trained PCANet models to extract the proposals features and use SVM models to classify them. Experiment results indicate that the proposed method has achieved reliable results to detect internal wave. The detection examples with internal waves detection framework based on PCANet is shown in Figure 7. We use 400 test samples to verify the accuracy of the training model, and the results in this data set achieve 86.5% accuracy of detection.

Detection examples with internal waves detection framework based on PCANet.
4.3 Application on Detective Inshore Surge Waves
Because the appearances of the internal wave and surge wave are similar, we use the waves generated by the inshore surge wave to simulate the generation of internal waves. Similarly, we also use the DJI UAV to get the images. Figure 8 shows some positive samples and negative samples cut from the image. Figure 9 shows the results of binarization process.

Image patches of three types of inshore surge waves. First row represents positive samples, second row represents the negative samples and third row represents the noises.

Image patches after binarization processing. First row represents positive samples, second row represents the negative samples and third row represents the noises.
The same with the experiment on the simulated waves, we use our proposed framework, using PCANet and SVM to train a classification model, using selective search method to produce proposals. Then we use trained PCANet models to extract the proposals features and use SVM models to classify them. We use 400 test samples to verify the accuracy of the training model; results in this data set achieve 94.5% accuracy of detection. Table 1 shows the comparison of the accuracy of the results mentioned in the two experiments.
Comparison of the accuracy rate (%) of the proposed approach on two data sets collected by the DJI drone.
| Data set | Accuracy rate |
|---|---|
| Simulative wave | 86.50 |
| Inshore surge wave | 94.50 |
5 Conclusions
In this paper, a framework for internal waves detection based on feature learning methods was proposed. The internal waves can be detected efficiently by using the PCANet. Experiments demonstrated the feasibility of the proposed technique for internal waves feature detection. Additionally, the result shows that accuracy rate improves along with the sample size increasing. It was believed that the experiment can be further improved when larger scale data set is used.
Funding source: National Natural Science Foundation of China
Award Identifier / Grant number: 61301241
Award Identifier / Grant number: 61602229
Award Identifier / Grant number: 61403353
Award Identifier / Grant number: 61501417
Award Identifier / Grant number: 61271405
Funding source: China Postdoctoral Science Foundation
Award Identifier / Grant number: 2016M590659
Funding statement: This work is supported by the National Natural Science Foundation of China (NSFC) Grants (61301241, 61602229, 61403353, 61501417 and 61271405); Natural Science Foundation of Shandong (ZR2016FM13, ZR2015FQ011 and ZR2014FQ023); China Postdoctoral Science Foundation funded project (2016M590659); Qingdao Postdoctoral Science Foundation funded project (861605040008); and the Fundamental Research Funds for the Central Universities (201511008 and 30020084851).
Bibliography
[1] W. Alpers, Theory of radar imaging of internal waves, Nature314 (1985), 245–247.10.1038/314245a0Search in Google Scholar
[2] W. Alpers, Ocean internal waves, in: Encyclopedia of Remote Sensing, pp. 433–437, Springer, 2014.10.1007/978-0-387-36699-9_118Search in Google Scholar
[3] K. Anderson and K. J. Gaston, Lightweight unmanned aerial vehicles will revolutionize spatial ecology, Front. Ecol. Environ.11 (2013), 138–146.10.1890/120150Search in Google Scholar
[4] T. B. Benjamin, Internal waves of finite amplitude and permanent form, J. Fluid Mech.25 (1966), 241–270.10.1017/S0022112066001630Search in Google Scholar
[5] E. H. Boak and I. L. Turner, Shoreline definition and detection: a review, J. Coastal Res.21 (2005), 688–703.10.2112/03-0071.1Search in Google Scholar
[6] S. Q. Cai, W. J. Zhang and S. A. Wang, An advance in marine environment observation technology, J. Trop. Oceanogr.26 (2007), 76–81.Search in Google Scholar
[7] A. Cavoukian, Privacy and drones: unmanned aerial vehicles, Information and Privacy Commissioner of Ontario, Canada Ontario, Canada, 2012.Search in Google Scholar
[8] L. R.Centurioni, Observations of large-amplitude nonlinear internal waves from a drifting array: instruments and methods. J. Atmos. Ocean. Tech.27 (2010), 1711–1731.10.1175/2010JTECHO774.1Search in Google Scholar
[9] T. H. Chan, K. Jia, S. Gao and J. Lu, PCANet: a simple deep learning baseline for image classification? IEEE Trans. Image Process.24 (2015), 5017–5032.10.1109/TIP.2015.2475625Search in Google Scholar PubMed
[10] C.-Y. Chen, J. R.-C. Hsu, M.-H. Cheng, H.-H. Chen and C.-F. Kuo, An investigation on internal solitary waves in a two-layer fluid: propagation and reflection from steep slopes, Ocean Eng.34 (2007), 171–184.10.1016/j.oceaneng.2005.11.020Search in Google Scholar
[11] W. Choi and R. Camassa, Fully nonlinear internal waves in a two-fluid system, J. Fluid Mech.396 (1996), 1–36.10.1017/S0022112099005820Search in Google Scholar
[12] R. Cristi, F. A. Papoulias and A. J. Healey, Adaptive sliding mode control of autonomous underwater vehicles in the dive plane, IEEE J. Oceanic Eng.15 (1990), 152–160.10.1109/48.107143Search in Google Scholar
[13] X. Gan, W. Huang, J. Yang and B. Fu, Internal wave packet characterization from SAR images using empirical mode decomposition (emd), in: Image and Signal Processing, 2008. CISP’08. Congress on, vol. 4, pp. 750–753, IEEE, 2008.10.1109/CISP.2008.136Search in Google Scholar
[14] C. Garrett and W. Munk, Space-time scales of internal waves, Geophys. Astro. Fluid Dyn.3 (1972), 225–264.10.1080/03091927208236082Search in Google Scholar
[15] C. Garrett and W. Munk, Internal waves in the ocean, Annu. Rev. Fluid Mech.11 (1979), 339–369.10.1146/annurev.fl.11.010179.002011Search in Google Scholar
[16] R. Girshick, Fast R-CNN, in: IEEE International Conference on Computer Vision, pp. 1440–1448, 2015.10.1109/ICCV.2015.169Search in Google Scholar
[17] R. Girshick, J. Donahue, T. Darrell and J. Malik, Rich feature hierarchies for accurate object detection and semantic segmentation. Comput. Sci. (2014), 580–587.10.1109/CVPR.2014.81Search in Google Scholar
[18] R. Girshick, J. Donahue, T. Darrell and J. Malik, Region-based convolutional networks for accurate object detection and segmentation. IEEE Trans. Pattern Anal. Mach. Intell.38 (2016), 142–158.10.1109/TPAMI.2015.2437384Search in Google Scholar PubMed
[19] R. Grimshaw, K. R. Helfrich and E. R. Johnson. Experimental study of the effect of rotation on nonlinear internal waves, Phys. Fluids25 (2013), 1–27.10.1063/1.4805092Search in Google Scholar
[20] J. Grue, A. Jensen, P.-O. Rusås and J. K. Sveen, Properties of large-amplitude internal waves. J. Fluid Mech.380 (1999), 257–278.10.1017/S0022112098003528Search in Google Scholar
[21] C. C. Kao, L. H. Lee, C. C. Tai and Y. C. Wei, Extracting the ocean surface feature of non-linear internal solitary waves in modis satellite images, in: International Conference on Intelligent Information Hiding and Multimedia Signal Processing, pp. 27–30, 2007.10.1109/IIHMSP.2007.4457485Search in Google Scholar
[22] C. G. Koop and G. Butler, An investigation of internal solitary waves in a two-fluid system, J. Fluid Mech.112 (1981), 225–251.10.1017/S0022112081000372Search in Google Scholar
[23] I. Kozlov, D. Romanenkov, A. Zimin and B. Chapron, SAR observing large-scale nonlinear internal waves in the white sea. Remote Sens. Environ.147 (2014), 99–107.10.1016/j.rse.2014.02.017Search in Google Scholar
[24] J. Li, X. Chen, M. Li, J. Li, P. P. C. Lee and W. Lou, Secure deduplication with efficient and reliable convergent key management, IEEE Trans. Parall. Distr. Syst.25 (2014), 1615–1625.10.1109/TPDS.2013.284Search in Google Scholar
[25] J. Li, J. Li, X. Chen, C. Jia and W. Lou, Identity-based encryption with outsourced revocation in cloud computing, IEEE Trans. Comput.64 (2015), 425–437.10.1109/TC.2013.208Search in Google Scholar
[26] A. K. Liu, Y. S. Chang, M. K. Hsu and N. K. Liang, Evolution of nonlinear internal waves in the East and South China Seas, J. Geophys. Res. Atmos.103 (1998), 7995–8008.10.1029/97JC01918Search in Google Scholar
[27] W. Liu, D. Anguelov, D. Erhan, C. Szegedy, S. Reed, C. Y. Fu and A. C. Berg, SSD: single shot multibox detector, in: Proceedings of the European Conference on Computer Vision, 2016.10.1007/978-3-319-46448-0_2Search in Google Scholar
[28] A. R. Osborne, T. L. Burch, R. I. Scarlet, The influence of internal waves on deep-water drilling, J. Petrol. Technol.30 (1978), 1–497.10.2118/6913-PASearch in Google Scholar
[29] L. Ostrovsky, E. Pelinovsky, V. Shrira and Y. Stepanyants, Beyond the KdV: post-explosion development. Chaos25 (2015), 097620.10.1063/1.4927448Search in Google Scholar PubMed
[30] S. Ren, K. He, R. Girshick and J. Sun, Faster R-CNN: towards real-time object detection with region proposal networks, In: Adv. Neural Inform. Process. Syst. (2015), 91–99.10.1109/TPAMI.2016.2577031Search in Google Scholar PubMed
[31] J. A. Rodenas and R. Garello, Wavelet analysis in SAR ocean image profiles for internal wave detection and wavelength estimation. IEEE Trans. Geosci. Remote Sensing.35 (1997), 933–945.10.1109/36.602535Search in Google Scholar
[32] J. A. Ródenas and R. Garello, Internal wave detection and location in SAR images using wavelet transform. IEEE Trans. Geosci. Remote Sensing36 (1998), 1494–1507.10.1109/36.718853Search in Google Scholar
[33] S. Roy, P. Arabshahi, R. Dan and W. Fox, Wide area ocean networks: architecture and system design considerations, in: Wuwnet06 Los, (2015), 25–32.10.1145/1161039.1161046Search in Google Scholar
[34] E. Shi and A. Perrig, Designing secure sensor networks, IEEE Wireless Commun.11 (2004), 38–43.10.1109/MWC.2004.1368895Search in Google Scholar
[35] J. Small, Z. Hallock, G. Pavey and J. Scott, Observations of large amplitude internal waves at the Malin Shelf edge during SESAME 1995. Cont. Shelf Res.19 (1999), 1389–1436.10.1016/S0278-4343(99)00023-0Search in Google Scholar
[36] Z. Sun, R. Zhang and J. Yan, The influence of internal waves on signal fluctuation in the yellow sea, J. Acoust. Soc. Am.105 (1999), 1311–1311.10.1121/1.424781Search in Google Scholar
[37] C. Szegedy, A. Toshev and D. Erhan, Deep neural networks for object detection. Adv. Neural Inform. Process. Syst.26 (2013), 2553–2561.Search in Google Scholar
[38] S. Tharawechrak, In-situ observations of internal waves on the continental slope and shelf of the south china sea, MSc thesis, Florida State University, 2007.Search in Google Scholar
[39] J. R. R. Uijlings, K. E. A. Van De Sande, T. Gevers and A. W. M. Smeulders, Selective search for object recognition, Int. J. Comput. Vision104 (2013), 154–171.10.1007/s11263-013-0620-5Search in Google Scholar
[40] K. P. Valavanis and G. J. Vachtsevanos, Handbook of Unmanned Aerial Vehicles, Springer, Netherlands, 2015.10.1007/978-90-481-9707-1Search in Google Scholar
[41] R. B. Wynn, V. A. I. Huvenne, T. P. Le Bas, B. J. Murton, D. P. Connelly, B. J. Bett, H. A. Ruhl, K. J. Morris, J. Peakall and D. R. Parsons, Autonomous underwater vehicles (AUVs): their past, present and future contributions to the advancement of marine geoscience, Mar. Geol.352 (2014), 451–468.10.1016/j.margeo.2014.03.012Search in Google Scholar
©2019 Walter de Gruyter GmbH, Berlin/Boston
This article is distributed under the terms of the Creative Commons Attribution Non-Commercial License, which permits unrestricted non-commercial use, distribution, and reproduction in any medium, provided the original work is properly cited.